
Abstract
The Francis turbine stability is impacted significantly by the flow characteristics in its draft tube. In the case of a Francis turbine in a hydropower plant, numerical simulations were undertaken at the maximum and rated heads, respectively, under three output scenarios of 20%, 100%, and 120%. The flow characteristics in the turbine draft tube and the evolution mechanism of flow pattern were assessed, as well as the impact of opening on vortex rope. The results demonstrate that with the increasing of the guide vane opening, a progressive transformation is noted for the random large vortex rope located in the conical section at the draft tube inlet into uniformly distributed one. The opening influences the velocity and pressure greatly, and as the opening enlarges, enhancement of the flow pattern is noted in the draft tube. Meanwhile, as the head increases, the influence scope of the vortex rope becomes larger. This research can reveal the operating conditions not suitable for the Francis turbine, thereby offering guidance for ensuring the stability of power station operation.
Introduction
Hydraulic turbines work usually under the off-design scenarios, so that the power demand can be satisfied at various periods, and the flow states inside them are quite intricate. The turbine’s safety and stability are impacted by the fluid entering the draft tube, which varies in swirling velocity and produces vortex ropes to narrow the range of turbine operation.1,2
There have been extensive researches concerning the vortex rope production inside the draft tube, as well as its influence over the stable turbine operation. A numerical model having the flow field forecasting and validation functions was developed by Goyal and Gandhi, 3 which enabled the efficiency enhancement under the off-design scenarios. Zhong et al. 4 considered that the heterogeneous circulation of runner outlet would cause formation of vortices in the draft tube conical section, which would evolve into varying vortex ropes. Through model testing, Skripkin et al. 5 undertook a distribution simulation on the runner flow in various working contexts, discovering that the axial recirculation region was larger when the N/N0 or Q/Q0 ratio exceeded 1, leading to drastic undulations in velocity. Goyal et al. 6 found that the intra-tube vortex ropes could make the unit instable, which was manifested primarily as the cavitation resulting from the high-velocity vortices in creating the cavity vortex ropes and augmenting the degree of pressure pulsation. In the case of a Francis turbine, the flow field at the runner outlet was investigated by Favrel et al.7,8 with the utilization of particle image velocimetry, discovering that the draft tube instability would be exacerbated by the increase of precession frequency, vortex circulation, and vortex trajectory. Meanwhile, the motion of vortices was affected greatly by the emergence of cavitation. Upstreamward transmission of vibration was noted for the intra-tube vortex ropes, and in the pressure undulations surveilled at the runner and its upstream, the low-frequency component could be noticed for the tube vortices.9–11 At the same time, Cheng et al. 12 conducted experimental and numerical studies of vortex rope characteristics, pressure pulsation, and runner outlet velocity under partial load conditions, proposed a new method based on axial velocity gradient profile to evaluate the strength of spiral vortex rope, and verified that the method can be used to determine the characteristics of vortex rope for other runners.
Owing to the persistent development of CFD software, detailed information has been offered for the flow pattern inside the draft tube, with which more precise explanation of the intra-tube vortex rope mechanism was achievable. The intra-tube vortex rope structure was presented in detail by Timo et al. 13 with the utilization of diverse numerical simulation approaches, discovering attenuation of vortex ropes at the elbow terminal to the turbulence flow. According to a study by David et al., 14 the vortex rope would turn unstable in case the frequency of intra-tube vortex rope coincided with the hydraulic circuit’s intrinsic frequency, leading to its erratic development and drastic swing in output power. By means of numerical simulation and experimentation, Zhang et al. 15 explored the flow field in a turbine and evaluated the cavitation issue between the draft tube and the runner. Through comparison of the intra-tube vortex rope under non-cavitation and cavitation scenarios, Yu 16 discovered higher instability of vortex ropes under the cavitation scenario. CFD-assisted optimization of the draft tube morphology was accomplished by Arispe et al., 17 who succeeded in enhancing the turbine efficiency. For a Francis turbine working under the deep part-load condition, the generation process of a twin vortex rope in its draft tube elbow was simulated by Khozaei et al., 18 discovering that the periodic vortex rotation at the elbow would result in oscillation of the draft tube pressure at low frequencies. Working conditions were explored by Khare and Prasad 19 under three guide vane openings, namely the rated load, overload, and low load, discovering that the highest efficiency of draft tube, along with the lowest energy loss, was attainable at the largest guide vane opening. A simulation research on a turbine by Tao and Lixiang 20 in high velocity and small opening settings discovered that the vortex rope produced by the conical section differed immensely from the tangible one, and that the shape of internal flow was intricate. Müller et al. 21 conjectured that under full load scenario, the Francis turbine would probably enter a self-oscillation state, involving the repeated production and thorough collapse of axisymmetric intra-tube cavitation vortex ropes, as well as the prominent periodic alterations of the tangential and axial velocity components in the tube conical section. Pang et al. 22 studied the influence of guide vane opening on cavitation, channel vorticity, and pressure pulsation in the turbine runner, and further analyzed the influence of guide vane opening on the flow field in the turbine. Chen et al. 23 studied the evolution law of PVR in hydraulic turbines, conducted numerical simulation based on MSST PANS (partial mean Navier-Stokes equation based on modified SST) model, and adopted DMD (Dynamic Mode Decomposition). The modal analysis of the unsteady flow in the draft tube is carried out. Hossein et al. 24 carried out the analysis of the model test and numerical simulation results, focusing on the generation of double vortex rope in the elbow of the draft pipe of the Francis flow turbine.
Strategies for realizing vortex rope suppression in the draft tube have been explored by researchers as well. Through the air admission approach, Yu et al. 25 achieved the vortical flow diminishment and pressure undulation mitigation inside the draft tube. Vortex zone development was disrupted by Zhou et al. 26 with the utilization of a conical diffusor, thereby suppressing the intra-tube swirling flow validly and enhancing the Francis turbine instability. The intra-tube flow was improved by Anup et al. 27 with J-grooves, which helped achieve swirling flow minimization and axial flow enhancement along the kernel flow zone. The remedial measures for controlling the intra-tube swirling flow were reviewed by Muhirwa et al. 28 for advantages and drawbacks, concluding that instead of solving the impacts of a preferably-developed vortex rope scattered over the vast tube area, the valid swirling flow control should solve the primary cause of spatially limited self-inflicted instabilities, that is, the momentum deficit in the vicinity of axis. Wang et al. 29 used a damped grid to optimize the flow state of the fluid in the draft pipe and performed unsteady numerical simulations to determine its mechanism. The test results are analyzed in detail to understand the influence of damping grating on the vortex belt of a Francis turbine. Lu et al. 30 studied the influence of different moving blade number on the hydraulic performance and flow control of the draft pipe of a mixed-flow turbine. Ivana et al. 31 performs an extensive analysis of different numerical simplifications to determine the optimal tradeoff between accuracy and required computational resources. In addition, the effects of geometric parameterization in terms of greater geometric flexibility, different objective functions, and optimization parameters are investigated. Kim et al. 32 used a scale-adaptive model to simulate shear stress transport turbulence for unsteady Reynolds mean Navier-Stokes analysis. The model is used to observe the effects of jet in the draft tube on unsteady internal flow and pressure phenomena considering both active and passive suppression methods. Khullar et al. 33 used numerical simulations to analyze the effects of air injection around the draft pipe. The influence of air injection on the flow field of draft pipe under upper and normal load is studied qualitatively and quantitatively.
In the case of a Francis turbine in a hydropower plant, this study simulated its operating conditions at the maximum and rated heads under 20%, 100%, and 120% outputs, assessed the flow characteristics in the draft tube, and investigated the impacts of head and opening on the intra-tube vortex characteristics, which can be used to determine the reasonable opening range for the stable operation of turbines. The research methods and conclusions provide guidance and suggestions for the design and research methods of new power stations.
Mathematical model
The gas-liquid two-phase flow governing equation was adopted for the flow in the turbine, while the basic governing equations of cavitation flow field were the continuity and momentum equations of the mixture. 34
The continuity equation of the mixture:

The momentum equation of the mixture (N-S equation):
where ρ M denotes the mixture density; α L , α V , α G and ρ L , ρ V , ρ G refer separately to the volume fractions and densities of liquid, vapor, and non-condensable gases; V represents the mixture velocity; μ M stands for the mixture’s dynamic viscosity coefficient; x represents the coordinate; subscripts i, j, and k indicate the tensor coordinates; ρ M = αLρL + αVρV + αGρG; and α L +α V + α G = 1.
From the continuity equation, the vapor phase transport equation is derived as:

where γ stands for the effective exchange coefficient; κ e and κ c refer separately to the rates of vapor production and condensation.35,36
When solving the cavitation problem, supplementation of cavitation model is required for closing the equations, so that the flow problem can be solved, and the Zwart cavitation model was adopted:
If P ≤ P v , bubble growth (cavitation) process:
If P > P v , bubble condensation (collapse) process:

where r b denotes the radius of the bubbles in the model, r b = 1 × 10⁻⁶ m; αnue is the volume fraction of cavitation nucleus, αnue = 5 × 10⁻⁴; C e = 50; and C c = 0.01.
Numerical simulation
Geometry model of the computational domain
The selected turbine model of a power station was HLA630-LJ-138, with the 12 MW rated output, 91 m rated head, 102 m maximum head, 14.8 m3/s rated flow rate, and 500 rpm rated speed. Figure 1 depicts the geometric model established for the entire flow passage. The rated output of 12 MW was set as the 100% output. The operating conditions under 20%, 100%, and 120% outputs were simulated at the maximum and rated heads. The three conditions adopted were the common ones for a turbine operation: extreme low load opening, high efficiency opening, and large load opening. The turbine design parameters are shown in the Table 1.

Geometry model of the whole turbine flow passage.
Hydraulic turbine design parameters.

Due to the complex components of the turbine, especially the guide vanes with opening adjustment function, the meshes were generated in five separated computational domains, which were runner, draft tube, spiral casing, as well as stay and guide vanes. 37 The unstructured grids were adopted for the runner blades to suit the large bending degree, guarantee the computational accuracy and reduce the computational time. The mesh generation of the turbine overflow components is shown in Figure 2.
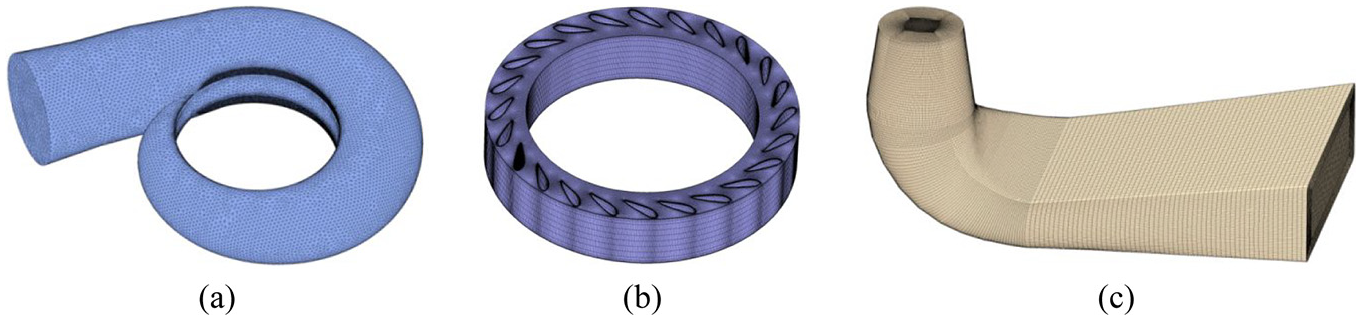
Grid generation of flow passage components: (a) spiral casing, (b) guide vanes, and (c) draft tube.
As shown in the Figure 3, with efficiency as the goal, this study determined to select a grid model with a grid number of 4.53 million. Table 2 details the grid quantity for each component.

Grid independence verification.
Grid quantity statistics in each component.

Setting of boundary conditions
The entire flow field was numerically estimated for the Francis turbine via the CFX software. The calculated flow field result in pure water setting was regarded as the initial computation condition. The standard k-ε turbulence model is used to calculate the steady state of the internal flow under various guide vane openings. Pure water and vapor (25°C) were deemed separately as the dual-phase (gas-liquid) medium, while the phase state was assigned as continuous. The inlet condition adopted was overall pressure inlet, where the headward conversion of inlet pressure was implemented. The volume fractions of pure water and steam for the inlet condition were assigned separately as 1 and 0, while the outlet state was static pressure. In addition, the pressure–velocity coupling throughout the computational process was accomplished using the SIMPLE algorithm, which boasted fast and powerful convergence. The non-slip wall with an “automatic” function was utilized for the rigid wall surface, while the residual standard setting was 10−5.
The boundary conditions for the total pressure inlet Pin and the hydrostatic outlet Pout are determined based on the head and the installation height, respectively. The calculation formulae are as follows:

Where ρ is the water density, kg/m3; g is the local gravitational acceleration, m/s 2 ; H is the rated head, maximum head, and installation height, respectively. The total inlet pressure at rated head and maximum head is 890.2 and 997.8 kPa respectively, and the value of outlet static pressure is 53.8 kPa obtained by equation (6).
Experimental result verification
The purpose of the test is to check whether the performance of the turbine regulation system and the unit in the transition process of load rejection meets the requirements of the standard and regulation guarantee. By adjusting the opening of turbine movable guide vane with 5% amplitude, the output power, pressure fluctuation, and vibration of the unit under different working conditions are monitored throughout the whole process. The experiment execution system is monitored as shown in Figure 4.

Performance test operation interface: (a) test system execution interface and (b) test results feedback interface.
The opening-efficiency curve is shown in Figure 5(a). The variation trend of efficiency with opening and head is basically consistent with the theory, and the turbine’s operation efficiency zone is almost unchanged under various heads, within the opening range of 80%–90%. It is found that the numerical simulations are basically within the real output range, and the output variation trend caused by the opening degree is the same.
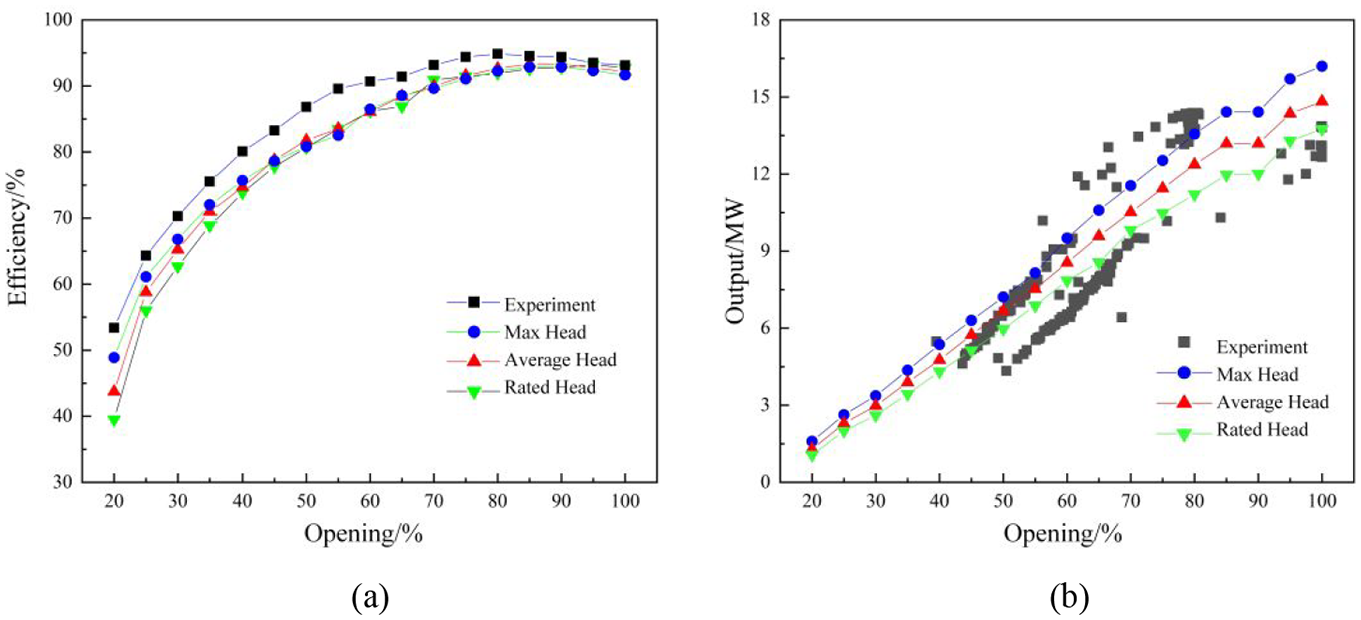
Comparison between numerical simulation and real machine test results of power station: (a) efficiency curve under different working conditions and (b) output change curve under different working conditions.
Computational results and analyses
Inlet conditions at the draft tube
After the fluid flows through the stay and guide vanes, both of its flow circulation and rate exhibit varying degrees of adjustment. The fluid enters the draft tube following energy transformation in the runner. The draft tube reflects the flow patterns in the diversion parts, stay and guide vanes, as well as runner. The intra-tube flow is relatively sophisticated among flows in the rest turbine components, which is influenced by the draft tube morphology and the runner outlet flow pattern. 38 By using CFD analysis, Abraham and Sadasivan 39 proved that a slight regulation of inlet angle is conducive to forming a vortex rope optimal in size in the draft tube center.
To facilitate the flow pattern assessment during the fluid entry into the tube, the directions and velocity of flow on the cross sections are monitored at various blade heights. The distance between runner crown and band is represent by SPAN = (0–1). The velocity vector arrangement on the internal turbine axial plan is surveilled at SPAN = 0.9, which is the cross section near the runner band.
Figure 6 illustrates the flow component speed vector in rated head setting. Clearly, preferable flow pattern is noted during the flow of fluid through the stay vanes in various working scenarios, and the speed is steady devoid of abrupt increase. At the low load opening, the velocity vector varies heterogeneously, small kinetic energy is acquired, and the relative velocity orientation fails to match the intra-runner flow direction, so that enormous impact loss is caused at the runner inlet. In the meantime, low relative velocity is noted at the runner exit, and cross-flow phenomenon emerges in the flow passage, which disallows smooth discharge of the fluid out from the runner. In high efficiency opening context, a homogeneous heightening in the flow velocity at the guide vanes is noted along the flow passage, apparent separation of flow or vortex is absent in the runner passage, and the streamline is smooth devoid of impact. The holistic flow status at the large load opening resembles that at the high efficiency opening, where a maximum runner outflow velocity is observed.

Velocity vectors at the rated head: (a) opening at 20% output, (b) opening at 100% output, and (c) opening at 120% output.
Figure 7 illustrates the velocity vectors in flow components under a maximum head scenario. Given the inflow condition alteration, the head increases and the airfoil-periphery velocity rises in the runner zone. The turbulence traits at the three opening degrees resemble that at the rated head. It is clear from the velocity triangle at the runner entrance that the value of circumferential speed is constant, the absolute speed at the inlet rises, the absolute flow angle is associated with the guide vane opening, and the relative velocity angle is enlarged, resulting in lowered impact loss at the blade entrance.

Velocity vectors at the maximum head: (a) opening at 20% output, (b) opening at 100% output, and (c) opening at 120% output.
To observe the cavitation situation in the runner intuitively and clearly, the volume fractions of cavitation on the flow section are described separately at the maximum and rated heads by setting the blade heights to SPAN = 0.1, 0.5, and 0.9 (Figure 8). Evidently, at the small load opening, severe cavitation takes place at the blade exit in the crown vicinity (SPAN = 0.1), within which cavitation bubbles nearly take up the whole flow passage. Contrastively, cavitation bubbles are almost absent in the runner passage in the central zone and in the vicinity of band (SPAN = 0.5–0.9). At the high efficiency opening, several cavitation bubbles are present, and cavitation takes place merely in the band vicinity (SPAN = 0.9) at the blade exit margin. At the large load opening, the cavitation area at the blade outlet resembles that in the 100% output setting, albeit the relatively serious degree of cavitation. Generally speaking, the cavitation effects produced at the low load opening differs fully from those at the large load and high efficiency openings, which impacts the state of fluid entering the tube drastically. Compared to the rated head condition, the cavitation effect is slightly more pronounced under the maximum head condition.

Volume fractions of cavitation under rated and maximum head conditions: (a) opening under 91 m head and 20% output, (b) opening under 91 m head and 100% output, (c) opening under 91 m head and 120% output, (d) opening under 102 m head and 20% output, (e) opening under 102 m head and 100% output, and (f) opening under 102 m head and 120% output.
In summary, the velocity at the runner exit is impacted by the opening of guide vanes, which leads to alterations in the velocity magnitude and direction at the tube inlet. At the low load opening, such factors as exit cavitation conglomeration and flow impact loss influence the state of intra-passage flow. Velocity circulation assessment at the runner exit reveals high entraining velocity of inflow, as well as low relative velocity, so that the inclination angle between the outflow velocity direction and the entrance is large. Under the large opening condition, the large outflow leads to high relative velocity in the high efficiency zone. Inapparent interference is observed between the cavitation bubbles and the vortex, smooth intra-runner flow is observed, and the streamline at the draft tube entrance is homogeneously distributed.
Distribution of flow pattern in the draft tube
Impacted by diverse factors, the streamline in the draft tube is stochastic, resulting in undesirable streamline surveillance for the entire tube section. Twelve cross sections are chosen on the conical, diverging, and elbow sections as the surveilling sections, with which the velocity distribution, flow pattern, and other fluid features at various sections are observed, and the impact pattern of openings is derived.
Figure 9 depicts the velocity vectors on the surveilling sections at diverse openings under the maximum and rated head scenarios. It can be seen from Figure 9(a) and (b) that at the low load opening, the outflow velocity on the blade in the crown vicinity is low because of the drastic conglomeration by cavitation bubbles. As pinpointed in the enlarged conical section, there forms a dead fluid large in area in the draft tube central zone, and within this section, there takes place the backflow phenomenon. Following departure from the runner, the fluid in the band vicinity retains the circumferential velocity resembling that at the draft tube inlet. The fluid exhibits diagonal downward flow along the wall by the action of inertia and gravity, and with the downward fluid movement, there is a progressive decline in the angle of inclination angle. As revealed by comparison of the two scenarios at small openings, the inflow increases at highest head in contrast to that at rated value, the dead fluid area somewhat contracts, and the angle of inclination at the entrance is enlarged, although the flow pattern remains chaotic and disordered on the whole.
Velocity vectors at different tube sections: (a) opening under 91 m head and 20% output, (b) opening under 102 m head and 20% output, (c) opening under 91 m head and 100% output, (d) opening under 102 m head and 100% output, (e) opening under 91 m head and 120% output, and (f) opening under 102 m head and 120% output.
It can be seen from Figure 9(c) and (d) that under the high efficiency opening scenario, concentration of low-energy fluid outflowing from the runner is observed at the conical section center, and there is progressive expansion of the central low-velocity zone with the conical section. During the flow through the diverging section, the distribution of velocity is no longer axially symmetric and the flow pattern turns intricate. Heterogeneous velocity vector distribution is noted on different segments of the diverging section, and the backflow small in area is present in the outlet part.
According to Figure 9(e) and (f), the outflow velocity at the large load opening is predominated by the relative velocity because of the flow rate heightening. Homogeneous inlet velocity is noted at the draft tube, whose direction is perpendicular to the inlet surface. Concentration of the low-velocity zone is found in the axis in the vicinity of side wall. On the circumference, 13 regular velocity altering cycles are present, which “initially rise and later drop,” showing coincidence with the runner blade quantity. Suggestively, the circumference is influenced by the rotor–stator interplay, resulting in heterogeneous velocity circulation at the tube entrance. With the downward movement of the fluid, this phenomenon is vanished, and comparatively low velocity on side wall is observed at the site with large curvature of elbow section. A distinct low-velocity zone is present at the diverging section, which is attributed probably to the action of intra-tube vortex rope.
To further analyze the intra-tube flow, flow pattern is surveilled at the center of draft tube’s y = 0 section, as depicted in Figure 10. By observing the low load opening condition, it is unraveled that the flow pattern at the conical section inlet is typified by low velocity in the center, high velocity in the wall vicinity, and vortices between two flow patterns, which are indicated in the boxes in Figure 10(a) and (b). It is clear that under this operating condition, the flow separation takes place in the conical section, and there is severe hydraulic loss. Observation of the high efficiency opening condition reveals that the flow separation is inapparent in the draft tube, although asymmetrically-sized vortices are present at the transition from conical to elbow sections, as indicated in the boxes in Figure 10(c). Vortices with particular eccentricity are produced under this operating condition. Under the maximum head scenario, vortices remain observable, which resembles the Karman vortices in distribution form and are accumulated on both sides of the tube axial line, as indicated in the boxes in Figure 10(d). There is possible presence of spiral vortex rope under this condition. By observing the large load opening condition, it can be found that the absolute velocity is prevailing for the fluid, and the rotating motion produces little effect. The elbow section is the primary occurrence site of vortices, which is attributed probably to the abrupt flow passage expansion.

Streamlines at different tube sections: (a) opening under 91 m head and 20% output, (b) opening under 102 m head and 20% output, (c) opening under 91 m head and 100% output, (d) opening under 102 m head and 100% output, (e) opening under 91 m head and 120% output, and (f) opening under 102 m head and 120% output.
Velocity swirling strength is a physical quantity that describes the intensity of eddy currents. On the whole, the flow state at highest head is superior to that at rated head. With the increase of head, the peripheral velocity turn less influential, the flow stability becomes stronger and the inlet flow is enlarged. Among them, the optimal performance is attained at the maximum head in the high load zone, where vortex is nearly absent. The vorticity morphology and position are indicated by physical quantity vorticity, which delineates the velocity vector rotation, as depicted in Figure 11. It is clear that at the low load opening, the whole draft tube is filled with vortices; eccentric rotating vortex ropes are present under the high efficiency opening condition, while under the large load opening condition, there emerges columnar vortex rope, whose influence is weakened as the head increases. By observing the vortex rope shape, it can be found that the vorticity in the vortex rope in the conical section is high. We can be approximate this kind of high-vorticity zone (i.e. bright-yellow colored region in the figure) as the trajectory of vortex. The vortex ropes stay nearly in the conical section center, which migrate to the small-curvature wall in the elbow section vicinity, and turn irregular toward the diverging section, thereby disturbing the draft tube outflow.

Vorticities and vortex ropes at different tube sections: (a) opening under 91 m head and 20% output, (b) opening under 102 m head and 20% output, (c) opening under 91 m head and 100% output, (d) opening under 102 m head and 100% output, (e) opening under 91 m head and 120% output, and (f) opening under 102 m head and 120% output.
The y = 0 section in the draft tube is subjected to the vorticity spread assessment, as described in Figure 12, where the traits and evolutionary orientation of eddy current in the flow process are apparently observable. At the low load opening, the vorticity spreads in the dead fluid zone are symmetrical under the maximum and rated heads. Due to the heterogeneous velocity distribution and the flow field diffusion at the elbow section, this symmetry is disrupted, and the flow instability is affected drastically by the fragmentation vorticity. At the large load and high efficiency openings, there are two forms of vorticity, namely the periaxial alternating distribution and the jet shape, which correspond separately to the spiral vortex region and the non-eccentric columnar vortex region. Besides, according to the negative and positive values of high-vorticity zone, the rotation direction of conical section vortex rope is opposite to that of the runner in the large load setting.

Vorticity distributions at the tube cross section: (a) opening under 91 m head and 20% output, (b) opening under 102 m head and 20% output, (c) opening under 91 m head and 100% output, (d) opening under 102 m head and 100% output, (e) opening under 91 m head and 120% output, and (f) opening under 102 m head and 120% output.
Distributions of pressure and velocity of intra-tube vortex ropes
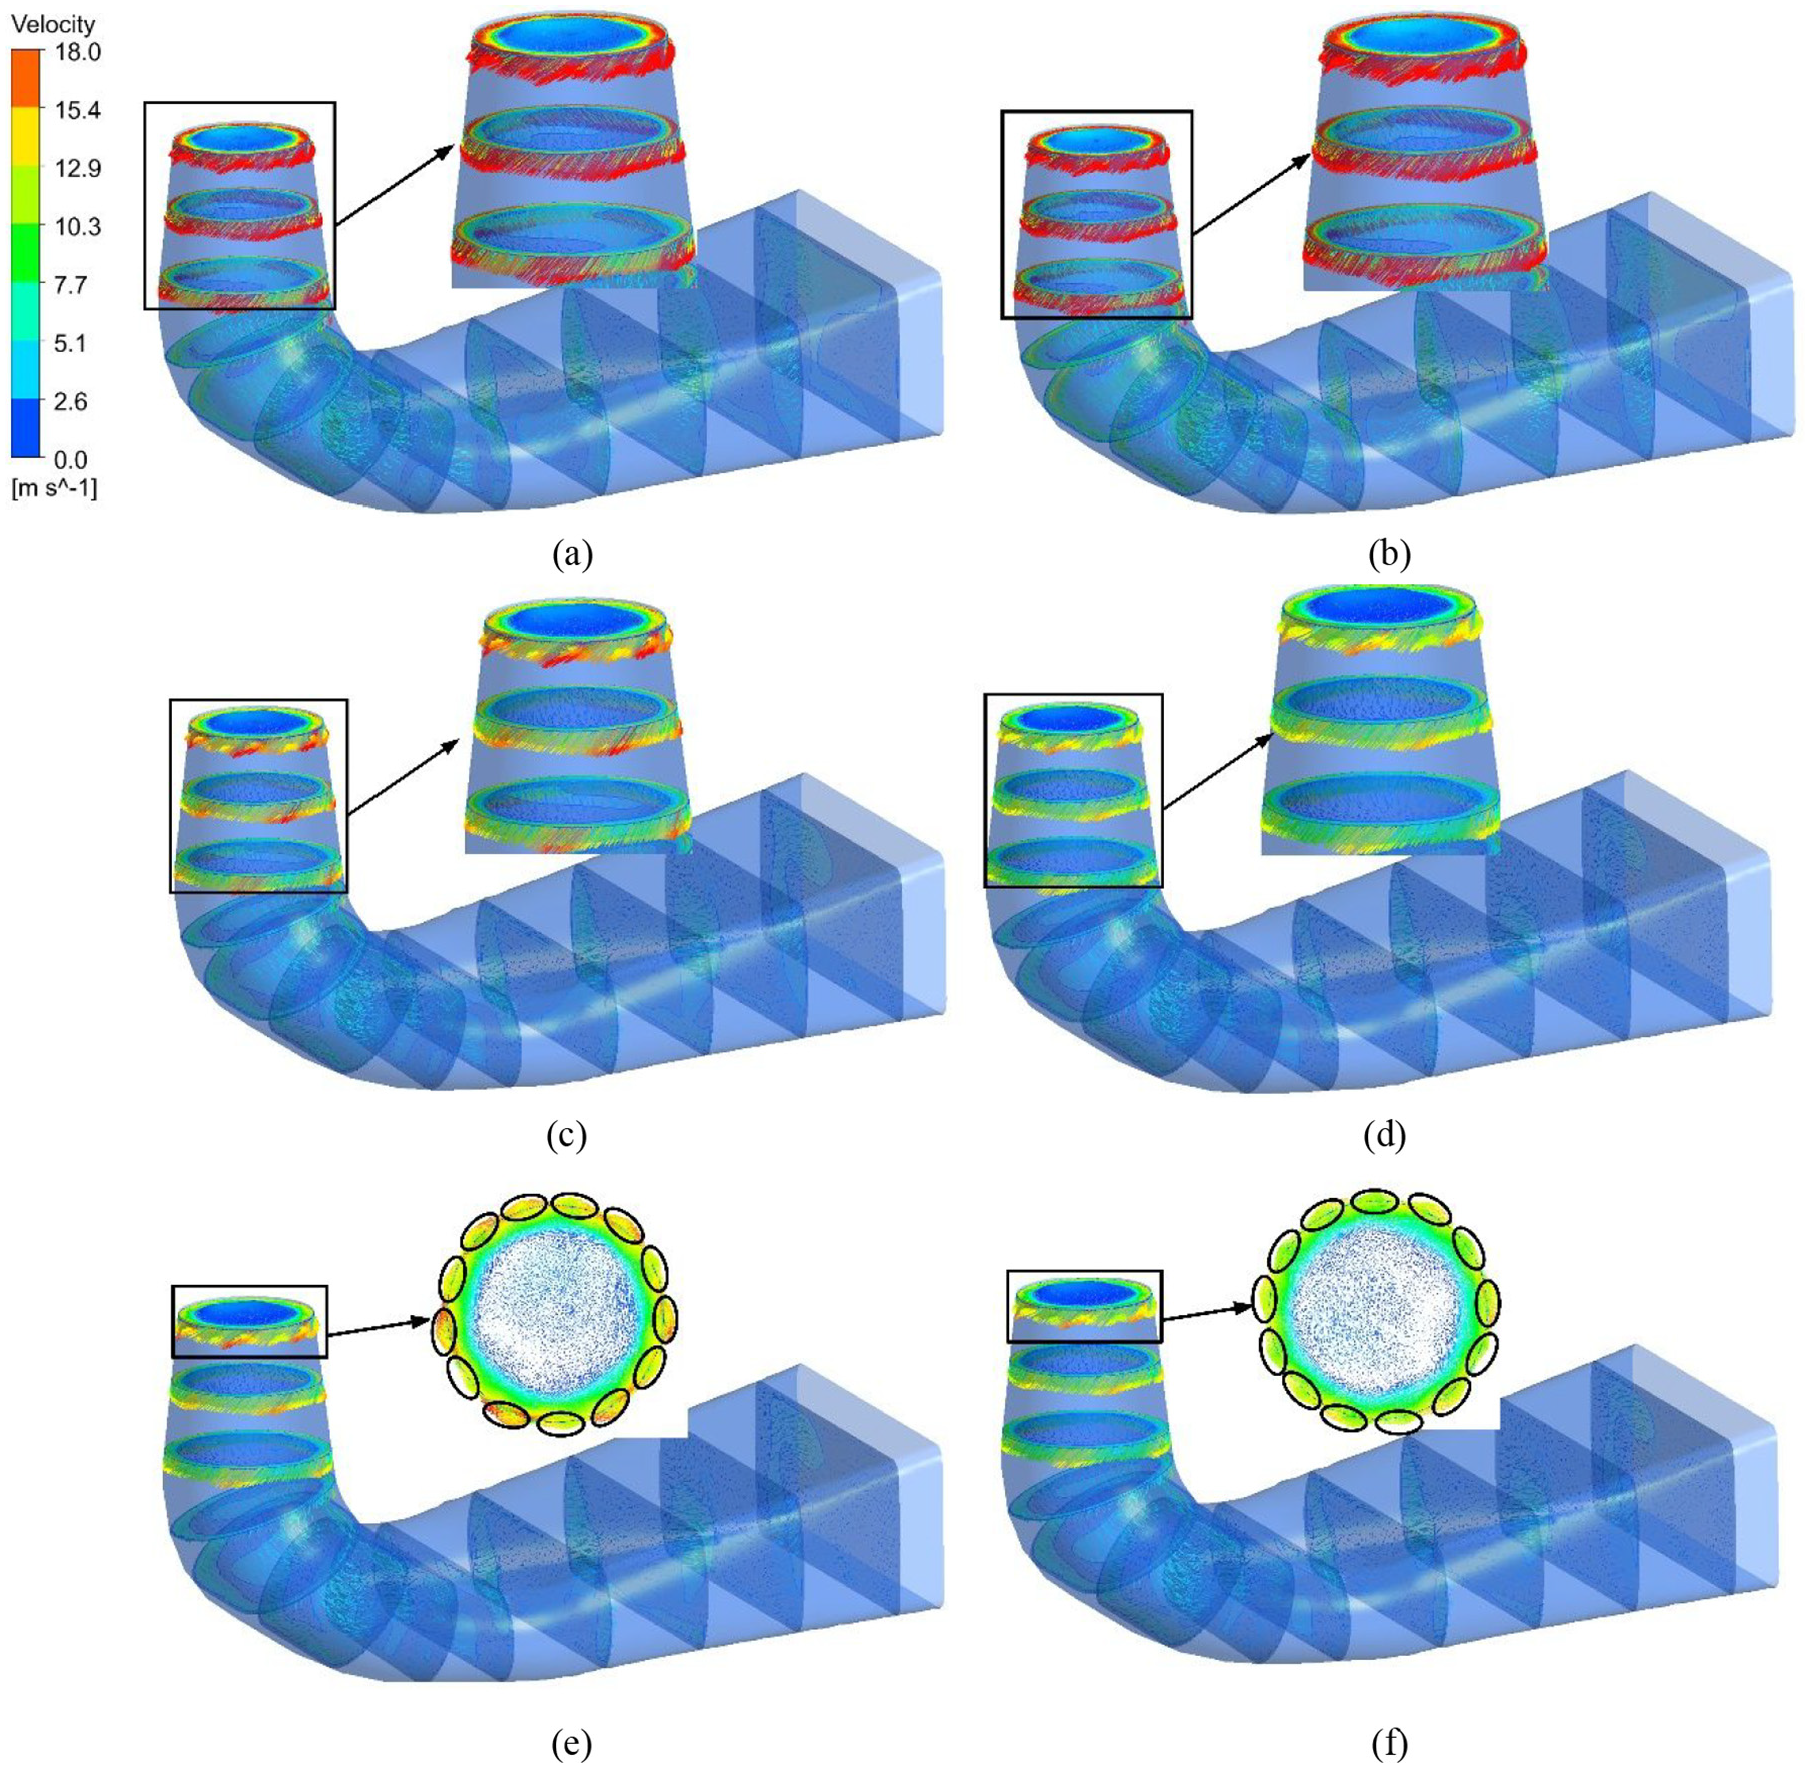
The structures of intra-tube vortex ropes are connected to the upper-part hub, which are somewhat eccentric at the elbow section, 40 showing agreement with the present computational results. According to the Figure 13, the conical section is the primary concentration site of the regular alteration patterns. The flow becomes intricate and irregular after passing through the elbow section, and appearance of intra-tube vortex rope and its impact is noted merely prior to this section. Therefore, four cross sections on the draft tube conical section are taken as the monitoring cross sections, and the cross lines passing through the center of the circle are drawn on these sections. The velocity and pressure in the x-axis and y-axis are extracted to quantitatively analyze the vortex rope. 41

Vortex ropes in the tube conical section: (a) opening under 91 m head and 20% output, (b) opening under 91 m head and 100% output, (c) opening under 91 m head and 120% output, (d) opening under 102 m head and 20% output, (e) opening under 102 m head and 100% output, and (f) opening under 102 m head and 120% output.
By observing the axial pressure in Figure 14, it can be found that the pressures on the sections near the runner inlet change dramatically in each working condition, and the pressures on the sections downward from the conical section tend to be stable. The turning point of the dramatic change of pressure is basically concentrated near the center of the circle. Compared with Figure 13, it can be seen that the turning point is inside the vortex rope. In particular, in the high-efficiency zone under the maximum head, the flow state is smooth and there are no unsymmetrical vortices. Therefore, this area is mainly affected by the rotor-stator interference, and 12 small vortex zones are all distributed around the inlet circle, so the dramatic change point of pressure is considerably distant from the axis. Under the high efficiency and large load working conditions, the rotor-stator interference plays an obvious role on the first monitoring section at the inlet, as shown by the black curve in Figure 14.

Pressures at the axis of the draft tube: (a) opening under 91 m head and 20% output, (b) opening under 102 m head and 20% output, (c) opening under 91 m head and 100% output, (d) opening under 102 m head and 100% output, (e) opening under 91 m head and 120% output, and (f) opening under 102 m head and 120% output.
Figure 15 illustrates the radial velocity component fluctuations at the x-axis along the circumference in the maximum and rated head settings. Under the same working condition, maximum velocity is found at the section in the vicinity of inlet. The area of cross section is enlarged downward along the conical section, while the velocity shows decline. For the identical section, a larger opening indicates more evident fluctuation of velocity, which resembles the pressure fluctuation in trend. Axis is the primary concentration site of the velocity fluctuation region. At the low load opening, enlargement in the dead fluid zone on every flow surface is noted along the diverging conical section, while the downward spiraling velocity along the wall turns lower. At the high efficiency opening, there are drastic decline in the velocity at the inlet section, as well as downward evolution of eccentric vortex rope. A higher degree of offset indicates a larger affected area on the cross section. Given the center–to–wall spread of the vortex rope, the central velocity is not the minimum, which is elevated slightly. At the large load opening, the velocity is impacted less by the columnar vortex rope than the spiral one, which is attributed to the centrifugal force-induced extension of spiral vortex rope tail.

Velocity at the tube x-axis: (a) opening under 91 m head and 20% output, (b) opening under 91 m head and 100% output, (c) opening under 91 m head and 120% output, (d) opening under 102 m head and 20% output, (e) opening under 102 m head and 100% output, and (f) opening under 102 m head and 120% output.
Variation of the absolute velocity on the x-axis is shown in Figure 16. As is clear, the absolute velocity in the conical section is symmetrical. At the low load opening, a dead fluid large in area appears in the center, and only the absolute velocity near the wall changes. At the high efficiency opening, the velocity changes uniformly, and the direction reverses at the center. The absolute velocity of the section near the elbow area no longer changes uniformly. At the large load opening, the reverse of absolute velocity near the center occurs several times, which may be caused by the vortex rope disturbance.

Absolute velocity at the tube x-axis: (a) opening under 91 m head and 20% output, (b) opening under 102 m head and 20% output, (c) opening under 91 m head and 100% output, (d) opening under 102 m head and 100% output, (e) opening under 91 m head and 120% output, and (f) opening under 102 m head and 120% output.
In some Francis turbine operating conditions, in order to reduce the pressure pulsation and the tail water pipe vibration caused therefrom, and to destroy the tail water pipe’s vacuum state, it is usually used for making up the gas in the runner area, which will have a favorable effect on the work of the turbine, the dynamic load will be reduced, and the vacuum below the runner will be lowered.
There are two types of replenishment methods; one is natural replenishment, when the tailpipe pressure is below the atmospheric value can be used in this category, but this approach to replenishment is often difficult to control the amount of gas. The second is forced to make up the air with a pressure machine or jet pump to the tailpipe into the air, which is currently used more of a kind, when the pressure near the tailpipe wall exceeds the atmospheric value must be used in this category. It can make up different amounts of air according to the different conditions, in order to maintain the vibration damping effect and the impact on the operating efficiency of the unit in an optimal state. Make up air position is usually in the straight cone section. It has been proved that the deeper the mouth of the filler tube, the less filler gas is required, and the more significant the effect. In order to increase the strength of the make up air tube, the cross-shaped make up air frame structure is used.
Conclusions
(1) For a Francis turbine, the inlet flow patterns impact the flow characteristics in its draft tube drastically. At the low load opening, cavitation bubbles are conglomerated at the runner outlet in the crown vicinity, and the state of inflow is poor, so that dead fluid large in area is formed in the draft tube. At the large load and high efficiency openings, the fluid flowing down the passage is restricted by the smooth inflow, and complicated flow conditions like vortices are generated at various parts due to the flow pattern alteration.
(2) At the low load opening, the vortex rope is random; at the large load and high efficiency openings, the rope morphology is greatly affected by the head. In the rated head setting in the high efficiency zone, there exist spiral vortex ropes in the draft tube, and as the head increases, a decline in the vortex rope eccentricity is noted. In the large load and rated head settings, columnar vortex ropes are present, and the influence of rotor-stator interference is more obvious with the increase of head.
(3) Through assessment of axial velocity and pressure distributions on the conical section, the pattern of vortex rope distribution evolution is explored over an axis–to–wall scope. The effects of vortex rope at the draft tube entrance are found to be concentrated in the center, while the eccentric vortex rope produces broader effects on the pressure and velocity downward along the flow direction.
(4) The research results obtained the stable operating range of the unit by analyzing the flow field characteristics of the unit in diverse operating scenarios, unraveled the unit vibration mechanism in the unstable operation context, and provided a basis for unit transformation and safe operation.
Footnotes
Handling Editor: Zhi-gang Zuo
Declaration of conflicting interests
The author(s) declared no potential conflicts of interest with respect to the research, authorship, and/or publication of this article.
Funding
The author(s) disclosed receipt of the following financial support for the research, authorship, and/or publication of this article: The research was supported by the National Natural Science Foundation of China Regional Innovation and Development Joint Fund project “Air doping erosion reduction mechanism and control of cavitation wear coupling damage of pump turbine in high altitude area” (No: U23A20669).