
Abstract
Rationale. We hypothesized that certain dietary components such as increased fat intake are associated with severity of obstructive sleep apnea (OSA). Methods. A total of 104 patients, diagnosed with OSA completed a validated dietary survey. The apnea-hypopnea index (AHI) was used to measure the severity of OSA. Subjects were divided using body mass index (BMI) into obese and overweight categories. Regression analysis was performed to predict severity of OSA from gender, BMI, age, % energy from fat, and the individual dietary components of the survey. Results. Overweight subjects who ate a diet high in fat (>35% of their total diet) had twice the severity of sleep apnea (AHI 18.2 ± 10.1 vs 36.6 ± 27.5; P = .001). There was a strong trend (P = .056) in OSA severity between subjects eating processed meats “often” (AHI 42.5 ± 30.7) versus those eating “rarely/never” (AHI 28.9 ± 22.7). Eating greater than 2 servings of dairy daily was associated with worsening severity of OSA (AHI 26.2 ± 15.6 vs 39.7 ± 31; P = .04]. Conclusions. Dietary components such as fat intake and processed meats were associated with increased risk of OSA severity. In addition, 2 servings of dairy foods were associated with a decreased severity of OSA at presentation.
‘Obesity is the strongest risk factor for OSA [obstructive sleep apnea], and racial, age, and gender differences exist as well.’
Sleep apnea is a worldwide problem. The estimated prevalence of sleep apnea is between 7% and 10% in adult men and between 3% and 9% among women, with the prevalence increasing with age.1,2 Obstructive sleep apnea (OSA) is defined by the occurrence of daytime sleepiness, loud snoring, witnessed breathing interruptions, or awakenings due to gasping or choking in the presence of at least 5 obstructive respiratory events (apneas, hypopneas, or respiratory effort–related arousals) per hour of sleep. 3 The apnea-hypopnea index (AHI) is the number of hypopneas or apneas recorded per hour of sleep. Based on the AHI, the severity of OSA is classified as follows: An AHI of 5 to 15 is mild, 15 to 30 is moderate, and more than 30 events per hour characterize severe sleep apnea. 3
Risk factors for OSA include male sex, older age, being overweight or obese, neck girth, snoring, and frequent breathing pauses. 4
Treatment is generally a continuous positive airway pressure device which the patient wears at night to keep their airways open. This is an expensive treatment and annual charges for sleep apnea are estimated to be about 100 billion dollars.5,6
Obesity is the strongest risk factor for OSA, and racial, age, and gender differences exist as well. In the United States, only one-third of the population is of normal weight. As body mass index (BMI) increases, sleep apnea prevalence increases, and can go up to as high as 50% of a population in patients with a BMI >40 kg/m2. 7 Asians also seem more affected by increases in body weight than other races do regarding risk of sleep apnea. In patients who already have sleep apnea, it was observed that for each unit increase in BMI (kg/m2), the mean AHI increased by 19.7% for Chinese, 11.6% for whites and blacks, and 10.5% for Hispanics. 8 There are emerging data that central obesity is also related to insomnia and/or OSA. 9 There are also racial, age, and gender differences. African Americans have more severe sleep apnea than whites, although this may be related to a delay in diagnosis. 10 In addition, as age increases, so does sleep apnea prevalence. There are gender differences, and recent research suggested stronger association of OSA in contributing to incident cardiovascular disease and cardiac remodeling in women than men. 11
Sleep apnea is emerging as a risk factor for a number of chronic diseases. There is an increased risk of hypertension, diabetes, stroke, and cardiovascular disease in patients with moderate to severe OSA. 12 Additionally, there is an increased prevalence of congestive heart failure in patients with sleep apnea. Interestingly, it was noted that an increased sodium intake was related to this prevalence. 13
Weight loss contributes to improvement in sleep apnea. 14 It is unknown whether certain macronutrients or specific foods in the diet contribute to sleep apnea risk. The primary purpose of this investigation was to examine if there are particular foods that those who have sleep apnea eat. A secondary purpose of the study was to determine any specific food seemed to be protective in the development of sleep apnea. This information would be helpful in preventing or treating this chronic and costly disease.
Methods
Sample size was calculated for trend tests between AHI severity and % energy from fat as well as various numerical scores. Spearman correlations tests were selected because of the ordinal nature of AHI severity and concerns that relationships might not be linear. Assuming 1-sided tests at the .05 levels, a power of 70%, a sample size of 29 was needed to detect a correlation of 0.4, a sample size of 52 to detect a correlation of 0.3 and a sample size of 117 to detect a correlation of 0.2. A sample size of 100 was selected as a compromise between detects a correlation of interest and feasibility. This sample size gives a 92.2% power to detect a correlation of 0.3.
The George Washington University Institutional Review Board approved the study and all participants provided written informed consent (#021442). All invited participants had a new diagnosis of OSA at the George Washington Medical Faculty Associates Center for Sleep Disorders. The study cohort is presented in Table 1.
Study Cohort.
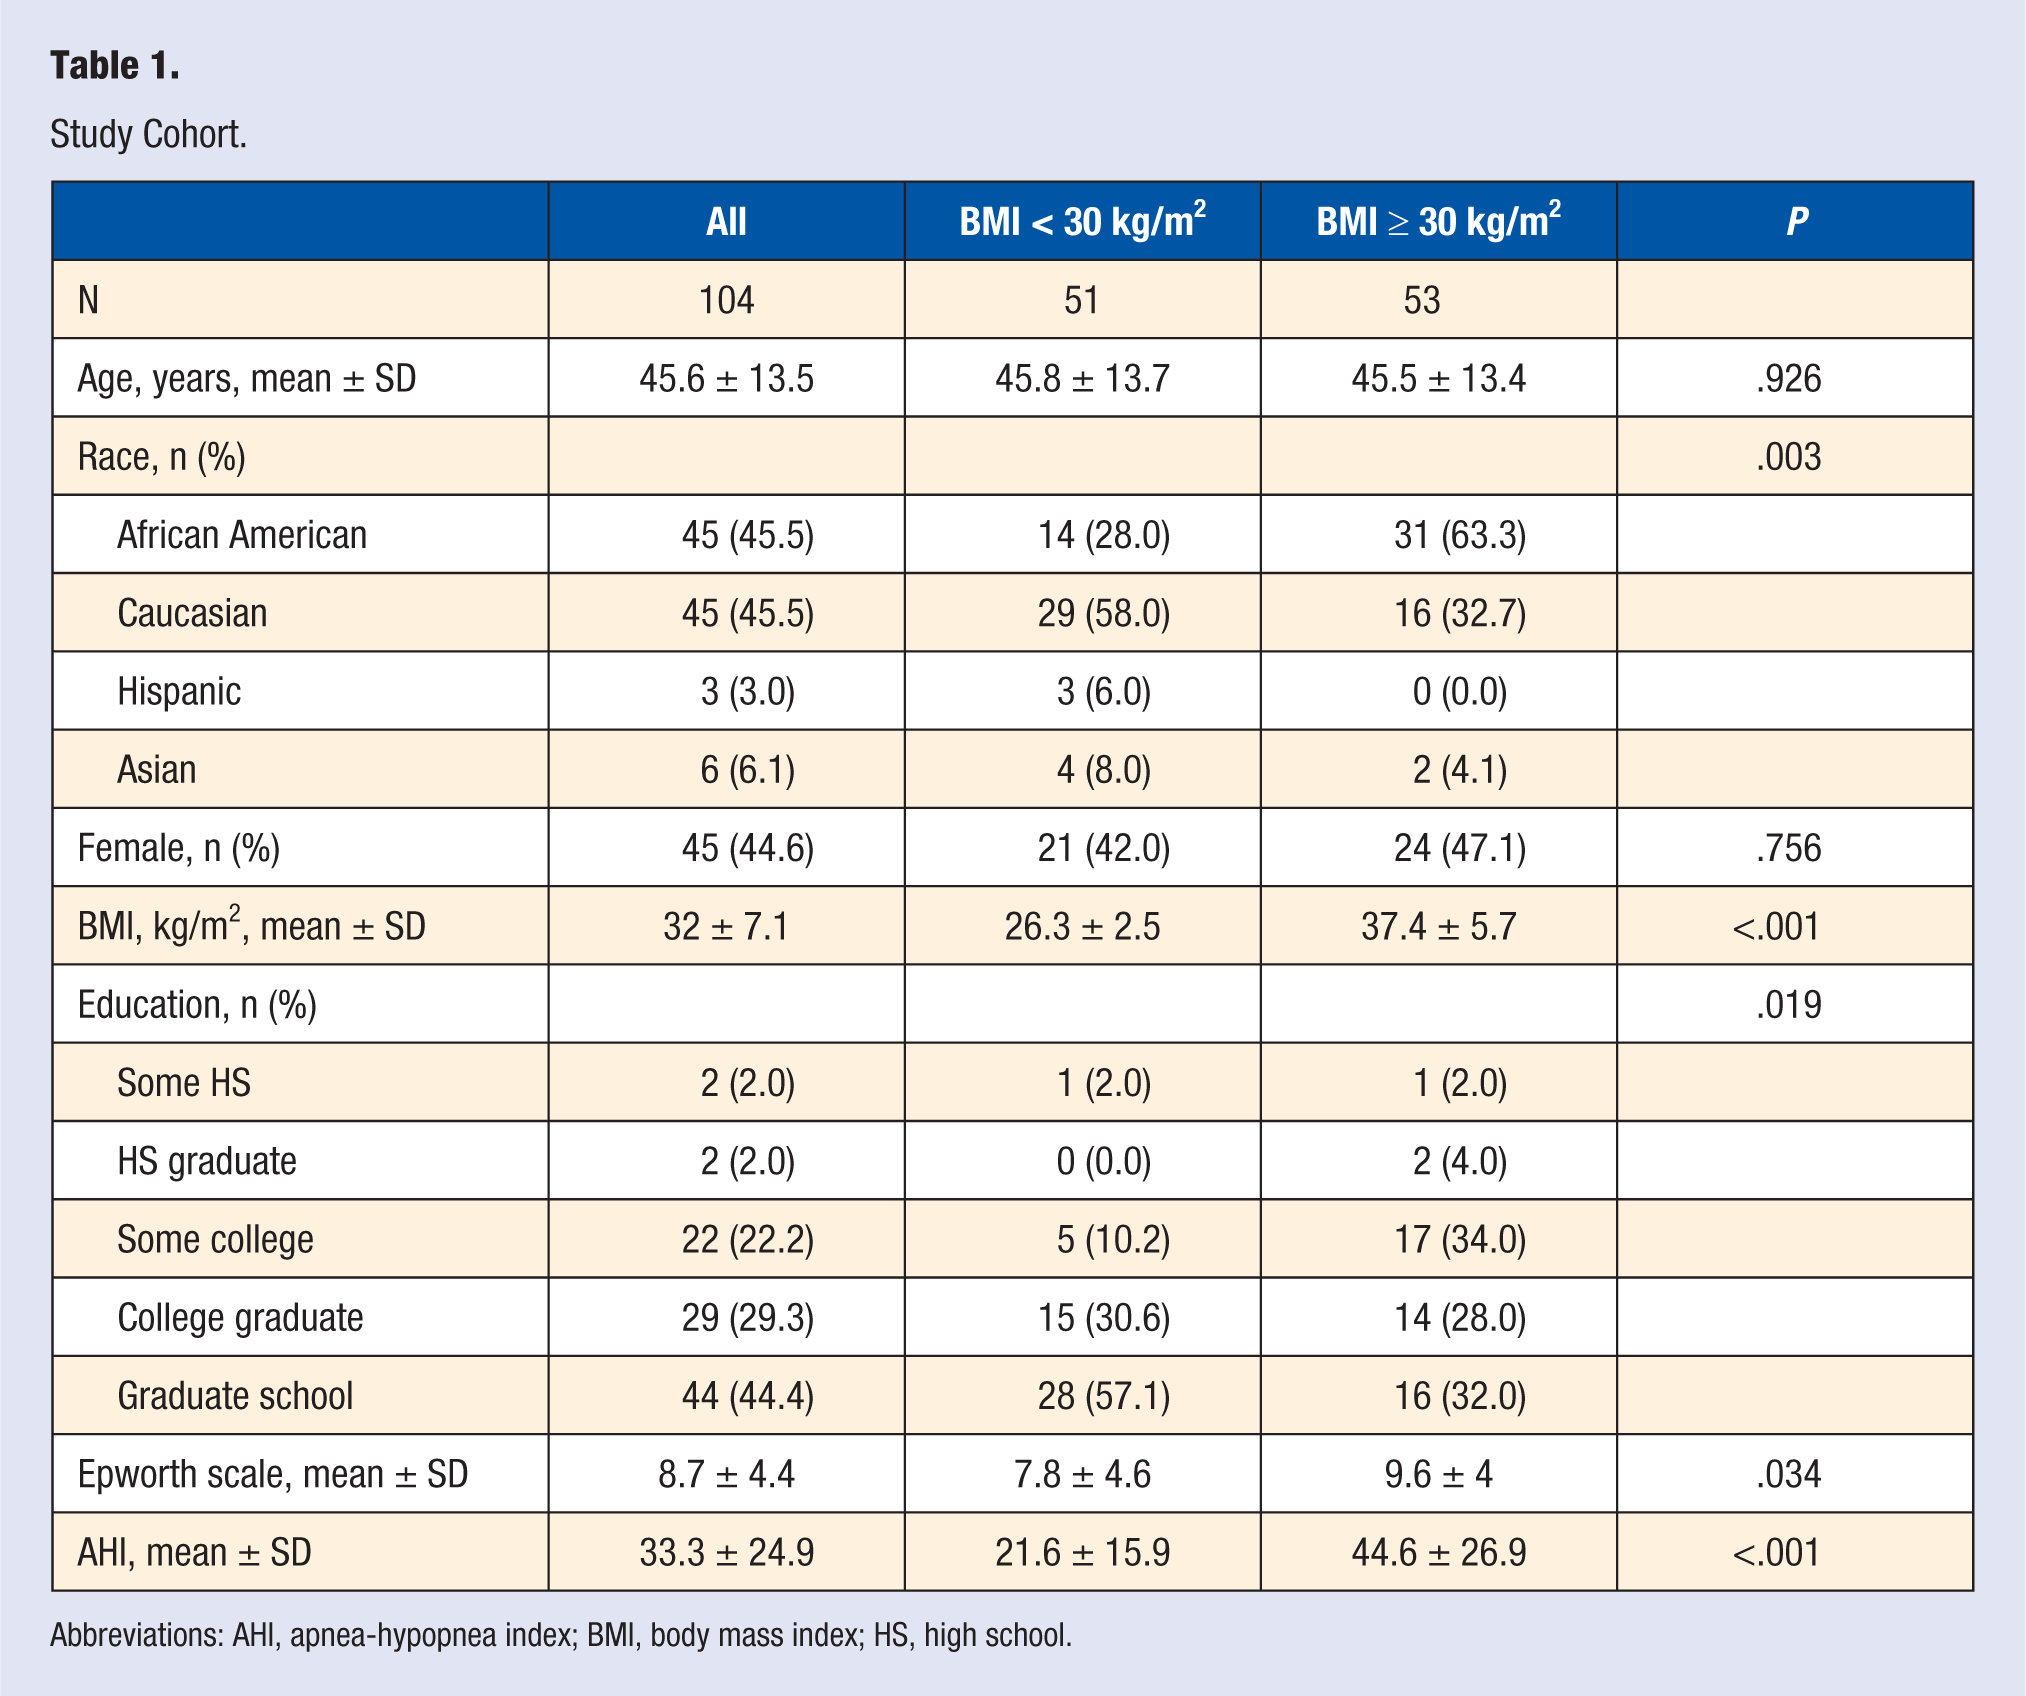
Abbreviations: AHI, apnea-hypopnea index; BMI, body mass index; HS, high school.
The participants had recently completed an overnight polysomnogram and were arriving to hear the results of their testing. Every patient arriving for his or her appointment was offered to participate in the study, and all enrolled participants completed the following validated surveys: Rapid Eating Assessment for Patients (REAP/shortened version 15 ) the Quick Food Scan, 16 the Fruit and Vegetable Screener, 17 the Rapid Assessment Disuse Index (RADI), 18 and the Epworth Sleepiness Scale. 19 If they did not complete all the surveys, their results were excluded.
To be eligible, they had to be adults, ages 18+ years and older who were newly diagnosed with at least mild-severity OSA (AHI ≥ 5 at screening). All patients were CPAP naive. The voluntary surveys were offered at the first patient visit only after the polysomnography was completed and before the patients were being diagnosed and treated for OSA. We began recruiting in August 2014 and continued for a period of 24 months. Everyone who came into the clinic for a visit was given the option of filling out the 4 surveys. The only exclusion criterion was the inability to read English.
Outcome Measures
OSA severity was diagnosed with one night of laboratory polysomnography at the George Washington University Sleep Center. The AHI was used as a measure of the severity of OSA. The AHI is the number of apneas or hypopneas recorded during the study per hour of sleep. It is generally expressed as the number of events per hour.
Subjects with OSA were divided using BMI into obese (BMI > 30 kg/m2) and overweight (BMI >25 but <30 kg/m2) categories and height and weight were measured at the first visit. The categories were separated because as obesity increases, AHI severity in generally increases as well. It is also not known as to why patients who are not obese suffer from OSA, and if there were factors related to food intake, for the nonobese patient, this information would be helpful.
Statistical Analysis
Participant characteristics were described using number (percentages) for categorical variables and means (SD) or median (interquartile range) for quantitative variables with normal and skewed distributions, respectively. Differences between participants with BMI < 30 and BMI ≥ 30 kg/m2 were tested using the chi-square test for independence for categorical variables and t test or the nonparametric Wilcoxon test, as appropriate, for continuous variables.
The relationship between the AHI and each of the dietary components of the REAP instrument was tested using a proportional odds logistic regression model to take into account the ordinal nature of the components. Since AHI is very skewed with a few participants having values greater than 100, there was concern that the results may be distorted by a few influential observations. To minimize this, the log of AHI was used in the models. As a sensitivity analysis, all regression models were repeated using the untransformed AHI. Since the relationship between AHI and diet was expected to be different for overweight and normal weight participants, separate models were fitted to participants with BMI < 30 and with BMI ≥ 30 kg/m2.
To investigate the relationship between elevated fat consumption and sleep apnea, the participants were classified as having elevated fat in their diet if their calculated percent energy from fat was above the 75% percentile of the data. A logistic regression model was used to test the relationship between elevated fat consumption and the log of AHI, separately for participants with BMI < 30 kg/m2 and participants with BMI ≥ 30 kg/m2. As sensitivity analyses, this was repeated using the untransformed AHI (Figure 1).
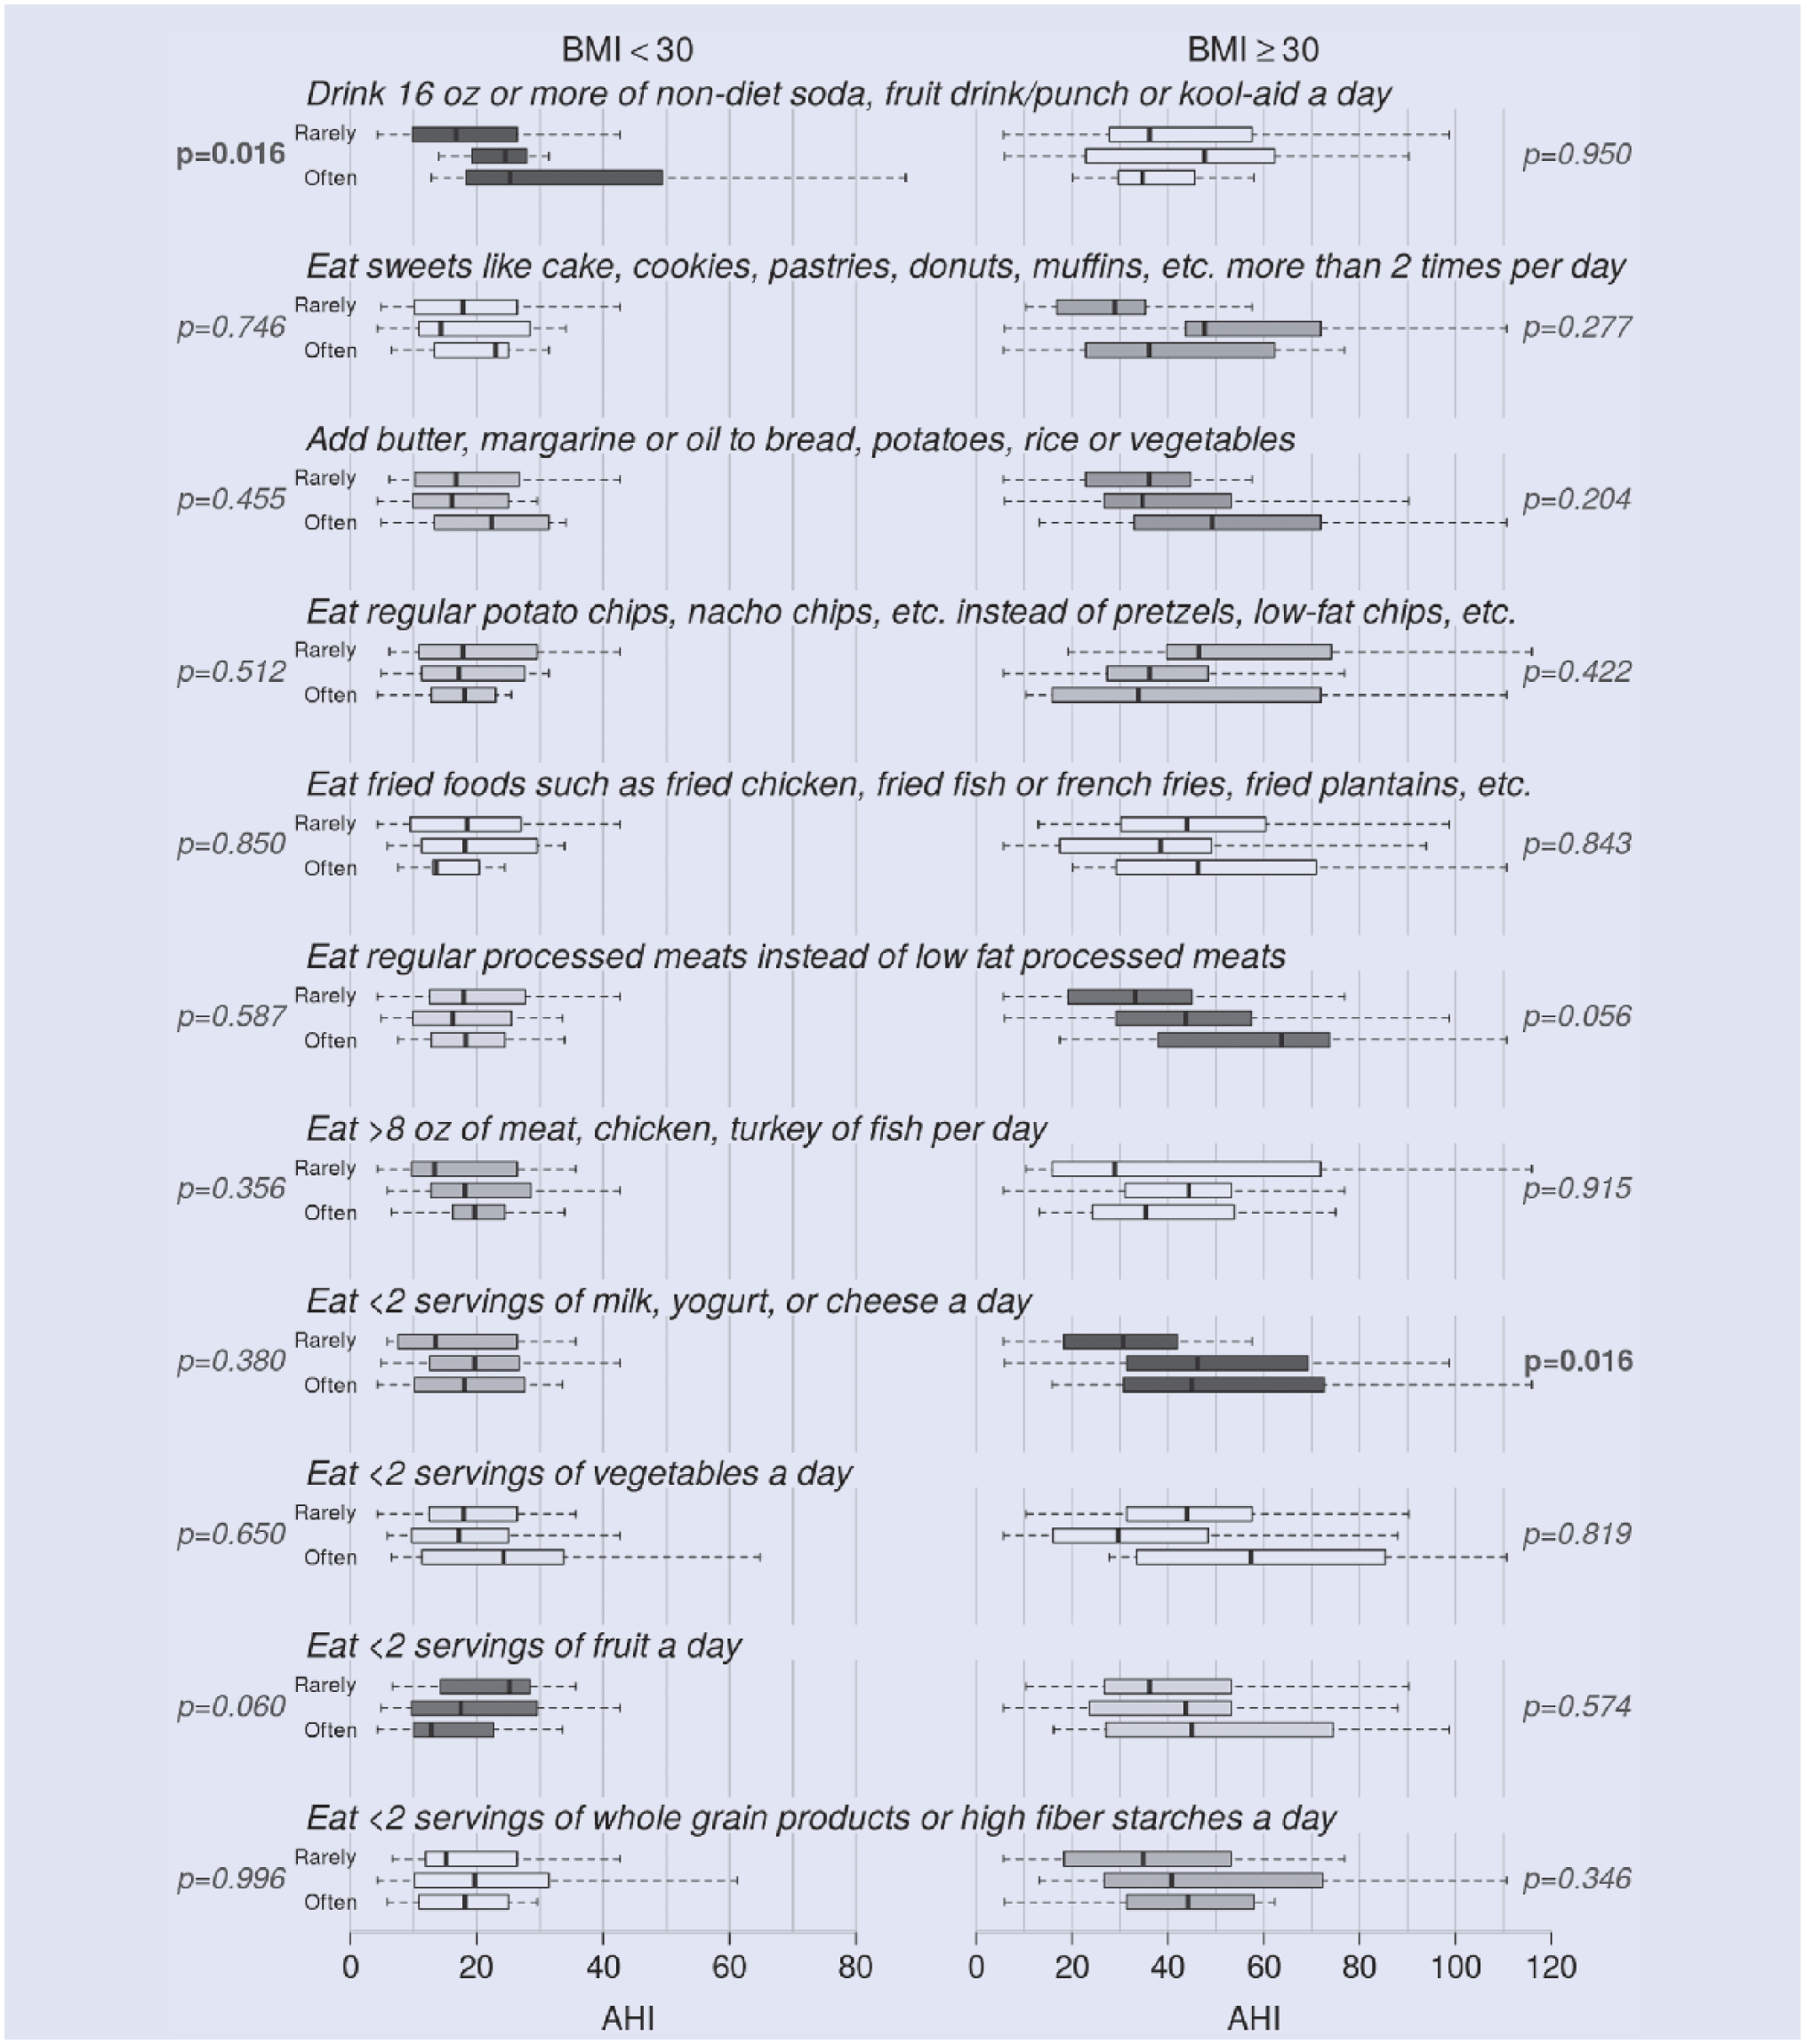
Relationship between apnea-hypopnea index (AHI) and diet components of Rapid Eating Assessment for Patients (REAP).
Results
Association With Fat
The 75% percentile for calculated energy from fat was 34.1%. For simplicity, subjects were divided into those who derived less than 35% energy from fat, and those who derived 35% or more energy from fat. The results using 34.1% were essentially the same.
Participants with BMI < 30 kg/m2 who received 35% or more energy from fat had significantly higher AHI than those with less than 35% energy from fat (P = .022). Among those with BMI ≥ 30 kg/m2, elevated fat intake is associated with a higher AHI although the difference is not significant.
Repeating these analyses with the untransformed AHI yields a consistent result (P = .016) (Figure 2).
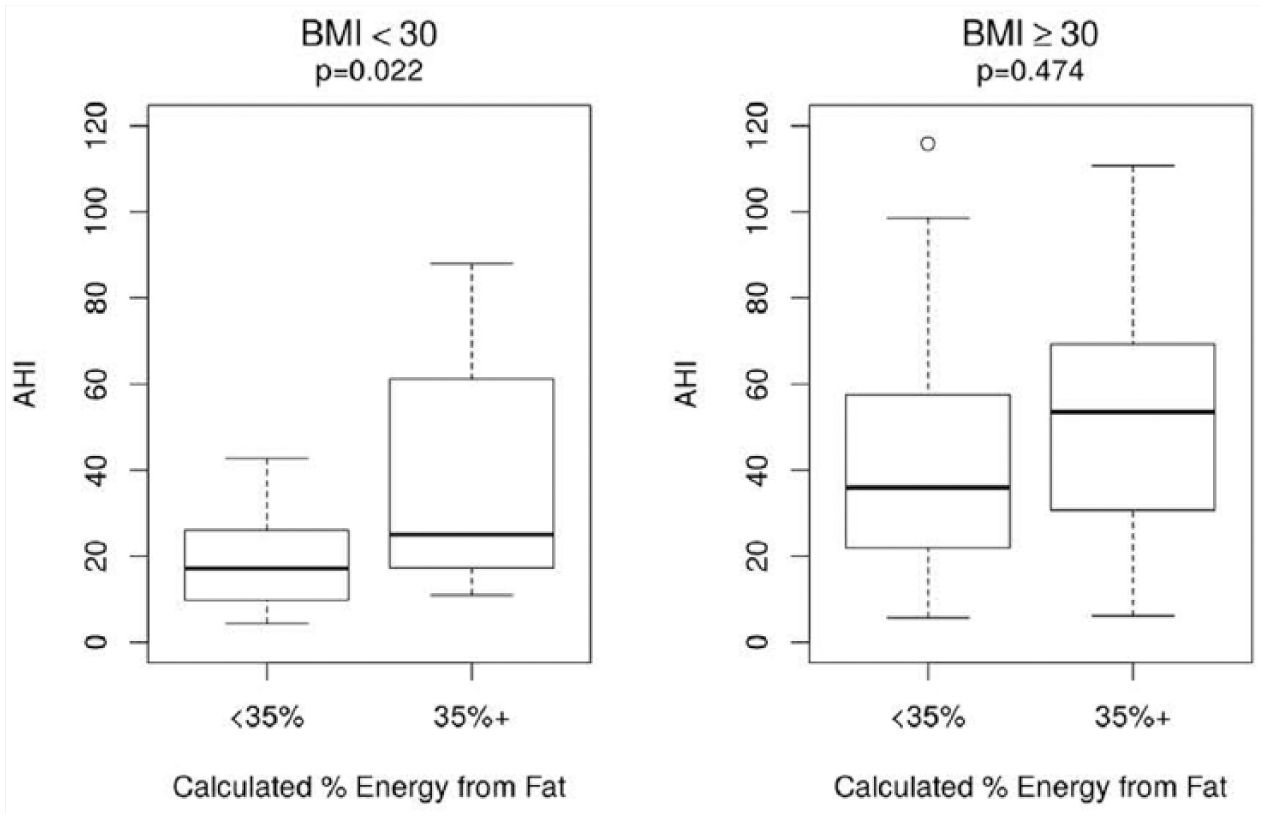
Relationship between elevated fat and apnea-hypopnea index (AHI).
Processed Meats
Although not significant, the intake of processed meats appears to be associated with sleep apnea (P = .056 in the proportional odds model with log[AHI], .052 for the rank transformed AHI, and .060 for the untransformed AHI).
Dairy
Low-fat dairy was found to be associated with less severity of sleep apnea at presentation of overweight subjects with P = .016 in the proportional odds model with log(AHI). Sensitivity analyses yielded P = .027 for the rank transformed AHI and .006 for the untransformed AHI.
Snacks
Consumption of snacks is associated with increased apnea in subjects with BMI < 30 kg/m2 (P = .016 from the proportional odds model with log[AHI]) but not in subjects with BMI ≥ 30 kg/m2. The sensitivity analyses yielded P = .019 with the untransformed AHI and .020 for the rank transformed AHI.
Discussion
Our study was consistent with other studies showing that as BMI increases, sleep apnea worsens, and that African Americans and older persons have a greater severity of sleep apnea.
We had 3 main new findings to our research: (a) that for overweight patients, severity of sleep apnea was related to an increased intake of saturated fats (b) that intake of processed meats was associated with sleep apnea, and (c) that low-fat dairy was associated with a decreased severity of OSA on presentation.
There is limited research on overweight (BMI = 25-29.9 kg/m2) patients who have sleep apnea. We found that overweight patients with sleep apnea have high intakes of saturated fats. Unfortunately, the current treatment for sleep apnea, CPAP administration, is associated with significant weight gain. 20
The relationship of what patients with OSA eat has not been studied. Fat intake has not been studied in detail, and there are few studies that look at the overweight patient (BMI = 25-29.9 kg/m2) in sleep apnea. Many studies have inferred that in these patients who are not obese the sleep apnea is related to craniofacial morphology.21-23
It has been suggested that dietary intakes of individuals undergoing short sleep predisposes to obesity. Less sleep time is associated with increased saturated fat intake. In a small study, it was noted that those subjects with 4 hours of sleep increased their consumption of fat, mostly saturated fat. 24
In patients with OSA, there are studies that show that these patients prefer fatty foods and dislike high fiber foods. 25 In addition, a fatty meal before bedtime increased total sleep time and the number of apneas in these subjects.26,27 One study in obese subjects with sleep apnea showed that in the average food ration of the men and women surveyed, the percentages of energy derived from fat reached 37%. 28 In the APPLES study, it was found that the results indicated that even after adjusting for BMI, age, and daytime sleepiness, subjects with very severe and extremely severe sleep-disordered breathing (RDI ≥ 50) consumed a diet that was higher in cholesterol, protein, total fat, and total saturated fatty acids. These findings were most evident among women. 29 The quantity and quality of dietary fat intake are main factors in the development of obesity and diabetes by increasing insulin resistance.
These observations suggest that the timing and/or the macronutrient content of meals may influence sleep features. Trakada et al 27 found that a fatty meal before bedtime significantly increased total sleep time and the number of apneas in these subjects. The exact mechanism is currently unknown; however, the authors suggest that an early dinner and avoidance of high-fat food may foster some symptomatic improvement in OSA.
Interestingly, there are no studies that look at macronutrient intake of patients after treatment has been initiated: What is known is that those on CPAP gain weight during treatment, but why this happens is not known.
Interestingly, intakes of saturated fats in the rat have shown effects on sleep. For example, intermittent hypoxia during sleep as occurs in sleep-disordered breathing, induces spatial learning deficits associated with regulation of transcription factors associated with learning and memory in the hippocampal CA1 region in rats. Notably, a high fat/refined carbohydrate diet can induce similar deficits and associated changes in signaling pathways under normoxic conditions. 31 In addition, sleep fragmentation in mice after 8 weeks has been shown to cause increased caloric intake without changing caloric expenditure. Plasma leptin levels initially decreased and subsequently increased, making them hungrier. Furthermore, increases in both visceral and subcutaneous adipose tissue volumes occurred. 32
The gut microbiota is now getting much attention in obesity research. Interestingly, on normal chow diet, OSA had no effect on blood pressure; however, in rats fed a high-fat diet, blood pressure increased 24 and 29 mm Hg after 7 and 14 days of OSA, respectively. High-fat diets and OSA led to significant alterations of the gut microbiota, including decreases in bacterial taxa known to produce the short chain fatty acid butyrate (P < .05). 33 In addition, saturated and n-6 polyunsaturated fatty acids have been shown to stimulate the innate immune response. Thus, increased circulating NEFA may contribute to systemic inflammation, thereby increasing susceptibility of individuals to chronic diseases such as respiratory disease.34,35
Processed meats are now getting much attention in the literature because of their relationship with inflammation and disease. Processed meat is defined as products usually made of red meat that are cured, salted, or smoked. Several large cohort studies have shown that a high consumption of processed (red) meat is related to increased overall and cause-specific mortality. Many studies have associated high intake of processed red meats with a risk of colorectal cancer, stroke, coronary heart diseases, and diabetes. In addition, processed red meat consumption is associated with more visceral fat, which is emerging as a risk factor for sleep apnea. 36 The etiology is unknown, but a recent study suggested an inverse association between both processed meat and unprocessed red meat with inflammation markers of the tumor necrosis factor pathway. 37 The largest numbers of estimated diet-related cardiometabolic deaths were related to high sodium (9.5% of all cardiometabolic deaths), low nuts/seeds (8.5%), high processed meats (8.2%), low seafood omega-3 fats (7.8%), low vegetables (7.6%), low fruits (7.5%), and high sugar-sweetened beverages (7.4%). 38
Most recently, there was an association noted between chronic obstructive pulmonary disease and processed meats. Although several compounds might be responsible for this finding, the authors believed that nitrites provide a very plausible biologic mechanism. 35
There are no studies that have looked at sleep apnea and processed meats.
In our study, patients who had at least two servings a day of dairy had lower sleep apnea scores Studies of dietary intake of low-fat dairy and disease protection have mostly centered on gout. Interestingly, in a Harvard study, 2 cups of milk per day was found to be preventative of gout. 39
Dairy intake has been shown to be anti-inflammatory in a few studies. In a small study of patients with metabolic syndrome, 3 servings of dairy per day was found to lower systemic inflammation and liver enzymes. 40 In another study, it was shown to be preventative of type 2 diabetes, particularly with yogurt consumption. 41 Overprotective activities of dairy are likely mediated through improvements in nitric oxide bioavailability, oxidative stress, inflammation, and insulin resistance. Controlled studies are needed. Low-fat dairy has been found to be protective of gout and has a urate lowering effect. Certain dairy fractions, 42 particularly glycomacropeptide and G600 milk fat extract, have anti-inflammatory properties in experimental models of acute gout. Other mechanisms are also postulated, such as inhibition of the inflammatory response to monosodium urate crystals within the joint. 43 A recent evidence-based review included encouragement of low-fat dairy in the management of gout. 44
Conclusion
In patients with newly diagnosed OSA, fat intake should be less than 10% per day, and monounsaturated fats such as avocado and olive oil encouraged. This is in keeping with the 2016 Dietary Guidelines already in place. Saturated fats should be limited. Processed meats should be discouraged in patients with sleep apnea.
If dairy products are eaten, they should be of the low-fat variety. Patients should be referred to a registered dietician for dietary counseling and weight reducing diet, similar to chronic renal disease and diabetes. This should be covered by insurance and Medicare/ Medicaid.
Footnotes
Declaration of Conflicting Interests
The author(s) declared no potential conflicts of interest with respect to the research, authorship, and/or publication of this article.
Funding
The author(s) received no financial support for the research, authorship, and/or publication of this article.
Ethical Approval
The George Washington University Institutional Review Board approved the study (#021442).
Informed Consent
All participants provided written informed consent.
Trial Registration
Not applicable, because this article does not contain any clinical trials.