
Abstract
In the literature archive, the intestinal microbiome is now considered as a discrete organ system. Despite living symbiotically with the human body, the gut microbiome is represented as potential drug targets because of its ability to modify the pharmacokinetics of orally administered drugs. Structural biology analysis indicates the existence of homology between transport proteins of microbial cells and membranes of enterocytes. It is speculated that structural similarity in the protein transporters may provoke an unwanted phenomenon of drug uptake by the gut microbiome present in the small intestine of the host. Considering this hypothesis, we analyzed the absorbance of orally administered caffeine by the gut microbiota in in vivo albino rat model through the RP-HPLC-UV approach. Microbiome absorbed the caffeine maximally at 2 hours and minimally at 5 hours post-drug administration following first-order absorption kinetics in a nonlinear way. Drug absorbance of microbial pellet and percent dose recovery was found significantly higher (P ≤ .05) at 2 hours post-administration as compared to all other groups. As speculated, our findings advocated the phenomenon that the gut microbiome influences the absorption of caffeine molecules. Members of the gut microbiome exhibited grouped behavior following first-order absorption kinetics in a nonlinear pattern.
Introduction
Caffeine (Figure 1), a methylxanthine derivative, acts centrally on the nervous system as stimulant to improve cognitive function and used clinically as a psychoactive drug worldwide.
1
The intestinal microbiome is a blended and highly rich source of diversified microbial genes having 150 times greater spectra than the human genome. The intestinal microbiome can be considered as a new body organ without which the host is unable to perform many vital functions.2,3 Among various membrane transport proteins, proton-dependent oligopeptide transporters (POTs) which actively absorb nutrients are present in organisms belonging to all kingdoms of life. Such POTs are responsible for actively transporting di and tri peptides from dietary sources.
4
Various transport proteins in the cell membrane of enterocytes have been identified as drug transporters that modulate pharmacokinetics and pharmacodynamics of nutrients as well as drug molecules.5,6 Among various drug transporters, human peptide transporter-1 (hPept-1) found in the apical side of the enterocyte membrane is a low affinity and high-capacity transporter.
7
Human peptide transporter-1 has been reported to mediate the transport of many drugs from the gut into the systemic circulation.
8
Absorption attributes of any orally administered drug exhibit complex dynamics and are influenced mainly by the physicochemical properties of the drug as well as diversity and population of the gut mucosa.9,10 Chemical structure of caffeine.
Both G +ve and G-ve bacterial cells abundantly inhabiting the gut contain membrane transporters 5 such as OmpC and OmpF channels in the outer membrane of E. coli 11 and S. typhi 12 are involved in protein mediated transport of different drugs. Uptake of drug molecules by microbial cell into cytoplasm may involve the mechanism of passive diffusion and secondary transport.13,14 Moreover, E. coli genome has been characterized with four more protein transporters such as YdgR and its orthologues; YhiP, YjdL, and YbgH that specifically mediate the transport of dipeptide and tripeptide 15 and peptidomimetic drugs. 16 Recently, in vivo trials, paracetamol (1364%) and sulpiride (3.91%), were absorbed by gut microbiome at different transit time after oral administration of therapeutic dose of drugs.10,17
In the current study, we aimed to assess the drug absorption ability of the gut microbiome in adult rodent models. In particular, we selected caffeine as widely used in the form of tea, coffee, and cola drinks. Caffeine was administered orally and analyzed since it is absorbed rapidly and completely in the gastrointestinal tract after oral ingestion and most commonly used as a neurostimulant. 18
Materials and Methods
Animals, Housing, and Diet
In vivo experiment was conducted in selected adult (aged 8–10 weeks, average weight 160 ± 20 gm) male healthy Wistar albino rats (n = 36) raised through chow maintenance diet in a strict hygienically controlled environment (25 ± 2 C temperature, 40–60% humidity and 12-hour light/12-hour dark cycle) in alcohol cleaned cages in an isolated station at Animal Research Lab, Department of Physiology, Government College University, Faisalabad. Rodent diet also known as chow maintenance diet consists of starch (76%), protein (10%), and oils (10%) was offered and consumed (46 g/kg of body weight daily) by experimental animals. Autoclaved water was served during the acclimatization period of 7 days and abandoned feed to a period of 8 hours until administered with an oral dose of the caffeine. All experiments were conducted following the guideline of the Ethical Review Board, Government College University, Faisalabad with Reference No. GCUF/ERB/131.
All 36 rats were randomly divided into six groups, namely, the control group (A1) which receives deionized water instead of any drug and caffeine-treated groups A2, A3, A4, A5, and A6 with equal rats (n = 6) in each group based upon transit time of caffeine in small bowl. A single dose of caffeine 25 mg/kg b.w. was administered orally to the groups A2–A6 by a gastric feeding tube (18-gauge, .79–1.18 cm in length) and were allowed to feed freely. Treated groups were killed by decapitation with a sharp knife following time intervals of 2, 3, 4, 5, and 6 hours after oral drug ingestion. These time intervals also depict the particular group of animals, that is, 2 hr = A2, 3 hr = A3, 4 hr = A4, 5hr = A5, and 6 hr = A6. The microbial mass pallet from the intestinal digesta was harvested and cleaned to obtain microbial lysate. Animals in the control group (A1) were also decapitated to collect the small intestinal length to prepare microbial lysate and preserved at −20°C till further analysis.
Isolation of the Microbial Mass and Microbial Lysate
Methods for the isolation of intestinal microbial mass pallet from the small intestine of rats were adopted as described previously. 10 The supernatant of microbial lysate was dried through a vigorous nitrogen gas stream. The resulted mass was dissolved in 800 μL of required mobile phase and filtered (pore size, .45 μm, Milli Pore®, USA) to preserve at −20°C till subsequent high-performance liquid chromatography (HPLC) analysis.
HPLC System and Conditions
To detect the caffeine from treated microbial samples, HPLC method was adopted as described previously by Franeta et al. with some procedural amendments. 19 Acetonitrile and water (25:75 v/v) were used as mobile phase by adjusting the pH (2.5) of the solution with H3PO3. Fresh mobile phase was prepared daily for HPLC analysis.
HPLC system (Perkin Elmer®, USA) along with reverse phase C18 column (5 μm, 250 × 4.6 mm) and UV/VIS detector (Shelton CT®, 06 484 USA) setting the oven at 30°C accompanied Chromera software version 4.1.2.6410 were used to quantify caffeine. For the detection of caffeine, a volume of 10 μL was injected by syringe at a flow rate of 1.5 mL/min to examine the drug concentration comparing calibration curve (Figure 2) with regression equation (Y = 375x + 65) measured against each of seven caffeine standards (1, 5, 10, 15, 20, 30, and 50 μg/mL) at given HPLC conditions with referenced wavelength at 207 nm showing retention time of 2.53 ± .3 min. The correlation coefficient (R2) was .969, while percentage recovery was 92.2% showing linearity. The chromatograms (Figures 3–6) showing up the peak areas of samples harvested at different transit times (i.e., 3, 4, 5, and 6 hr) were used to calculate the concentration of caffeine in each sample set. Precision of the current method was ensured by calculating both intra-day and inter-day. Precision (.69, .89, and 1.66) of the method was evaluated by both intra-day and inter-day precision. Intra-day precision was .69, .89, and 1.66 calculated by using 10 samples each of 3 different levels of caffeine working standards of 10 and 15 and 20 μg/mL, respectively, to find the respective peak areas. Similar protocols were repeated after five days with the same standards of caffeine to calculate inter-day precision 2.15, 1.65, and .78, respectively. Accuracy and recovery of caffeine (5 μg/mL) from spiked samples was 92.2% within the range of 92–100%. Calibration curve of caffeine is linear over the concentration range (1–50 μg/mL). Chromatogram of the caffeine-treated sample at 2 hours post-caffeine oral treatment (25 mg/kg of BW) sampling time. Chromatogram of the caffeine-treated sample at 3 hours post-caffeine oral treatment (25 mg/kg of BW) sampling time. Chromatogram of the caffeine-treated sample at 4 hours post-caffeine oral treatment (25 mg/kg of BW) sampling time. Chromatogram of the caffeine-treated sample at 5 hours post-caffeine oral treatment (25 mg/kg of BW) sampling time.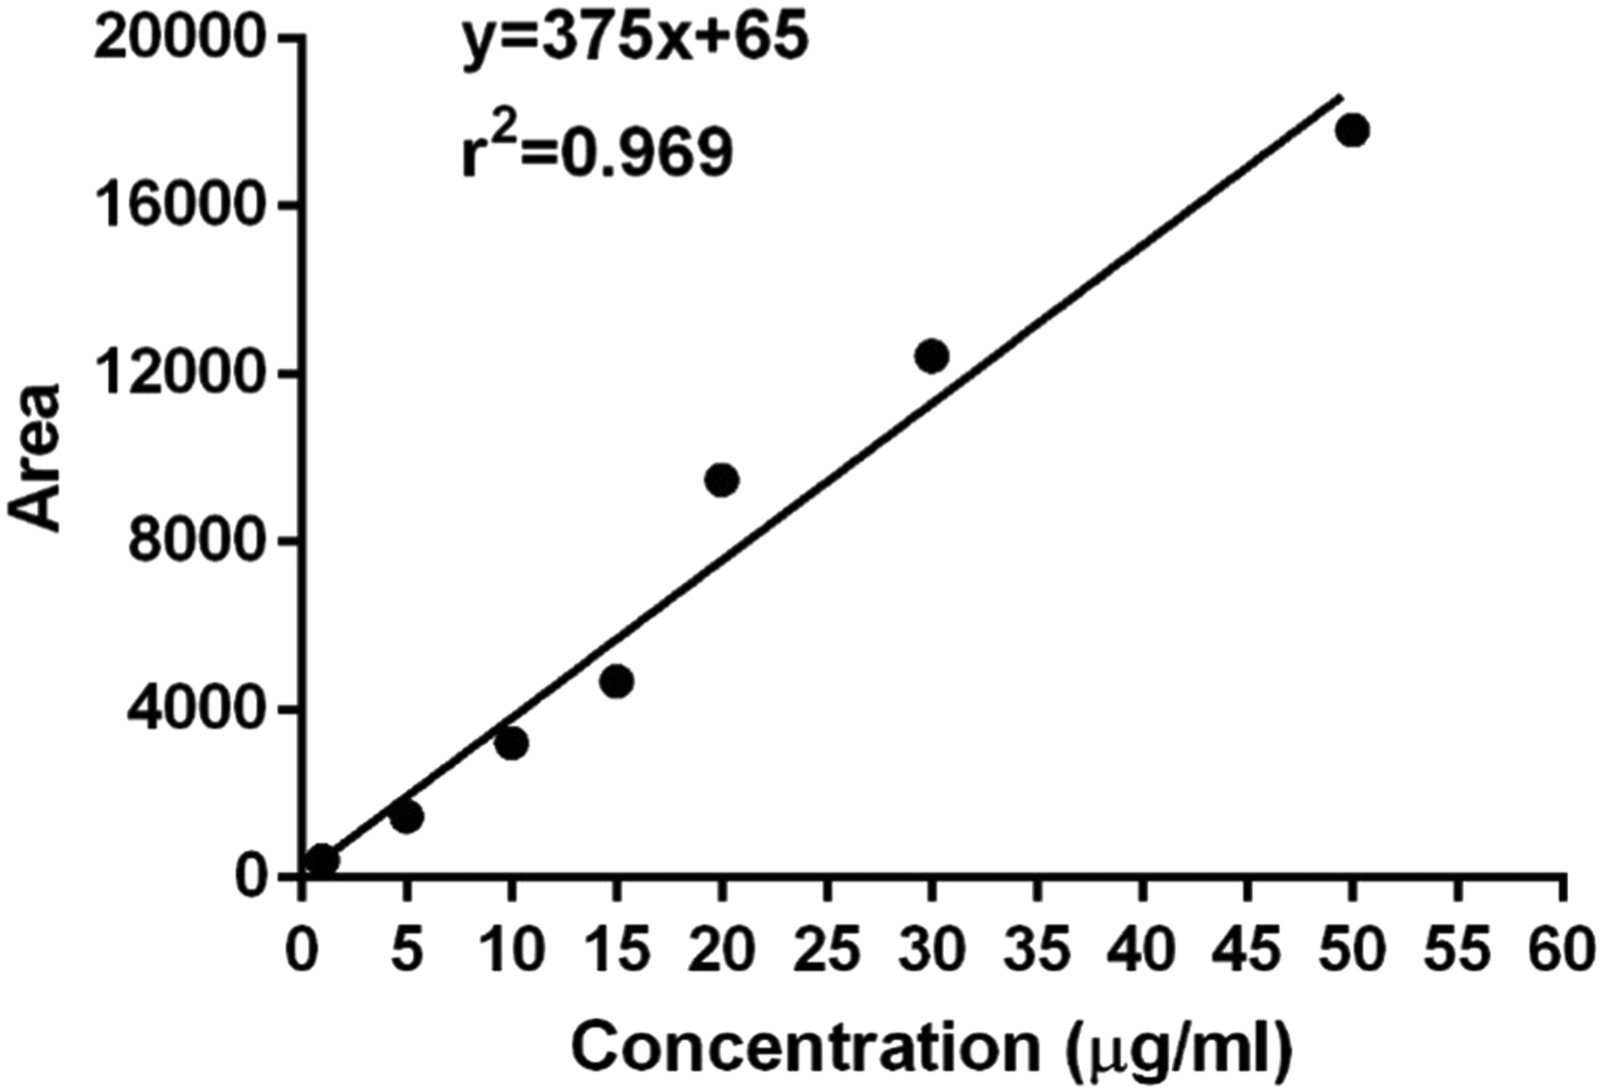


Statistical Analysis
Data generated were analyzed statistically by applying ANOVA (one-way analysis of variance) through GraphPad Prism 6 San Diego, CA 92108, USA Duncan multiple range test was employed as a post hoc test to determine the significance among various groups by adjusting (P ≤ .05) through Costat 6.4 software.
Results
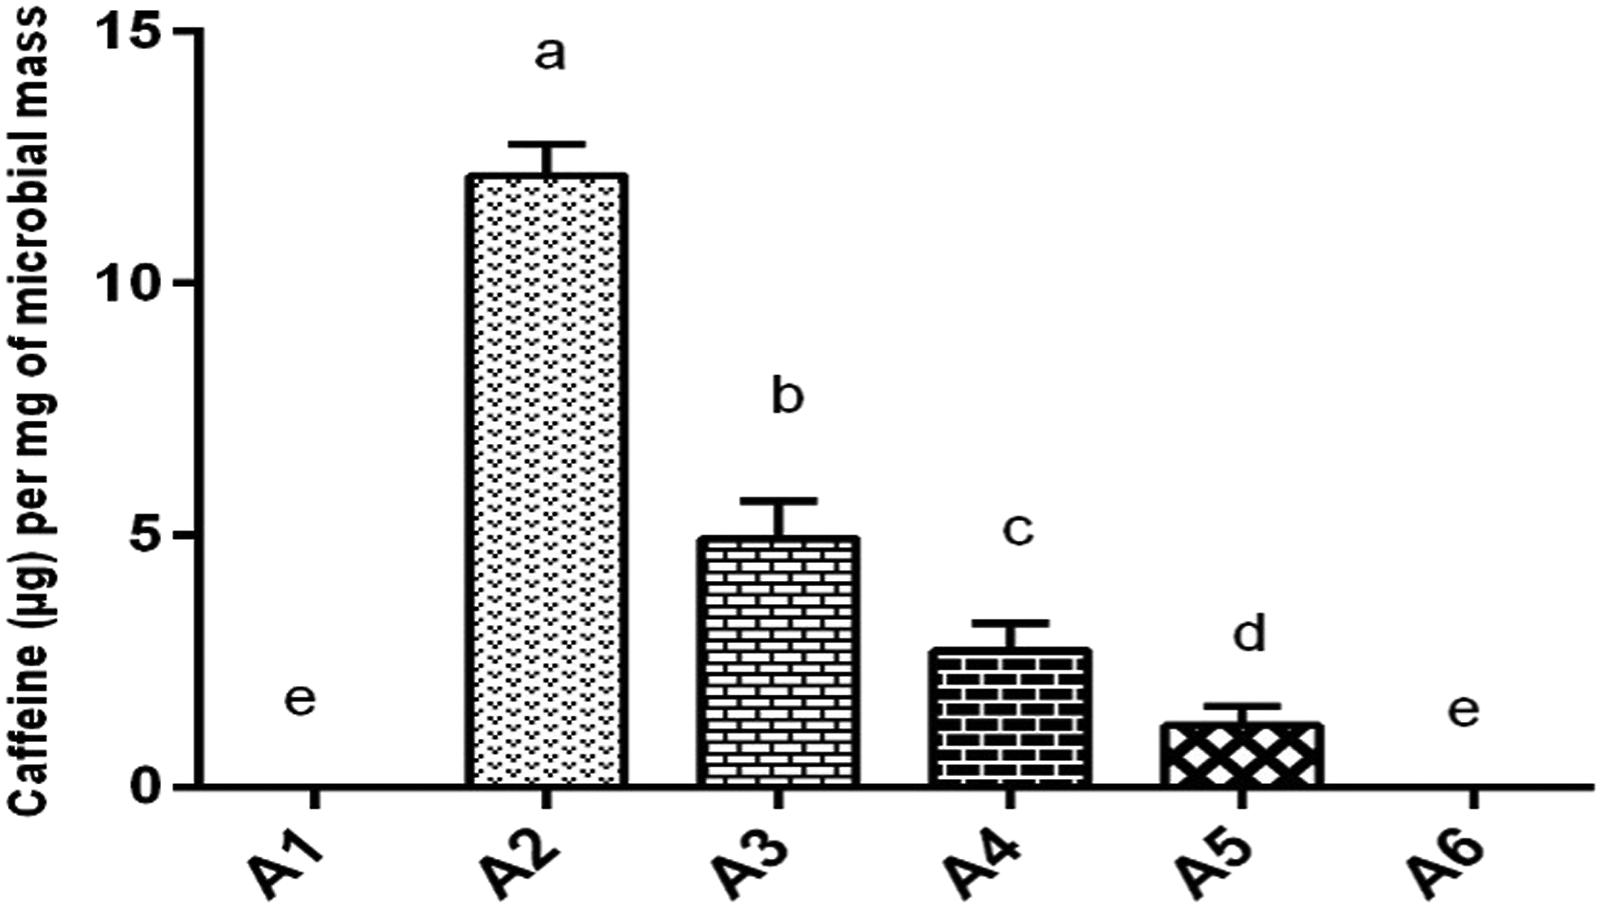
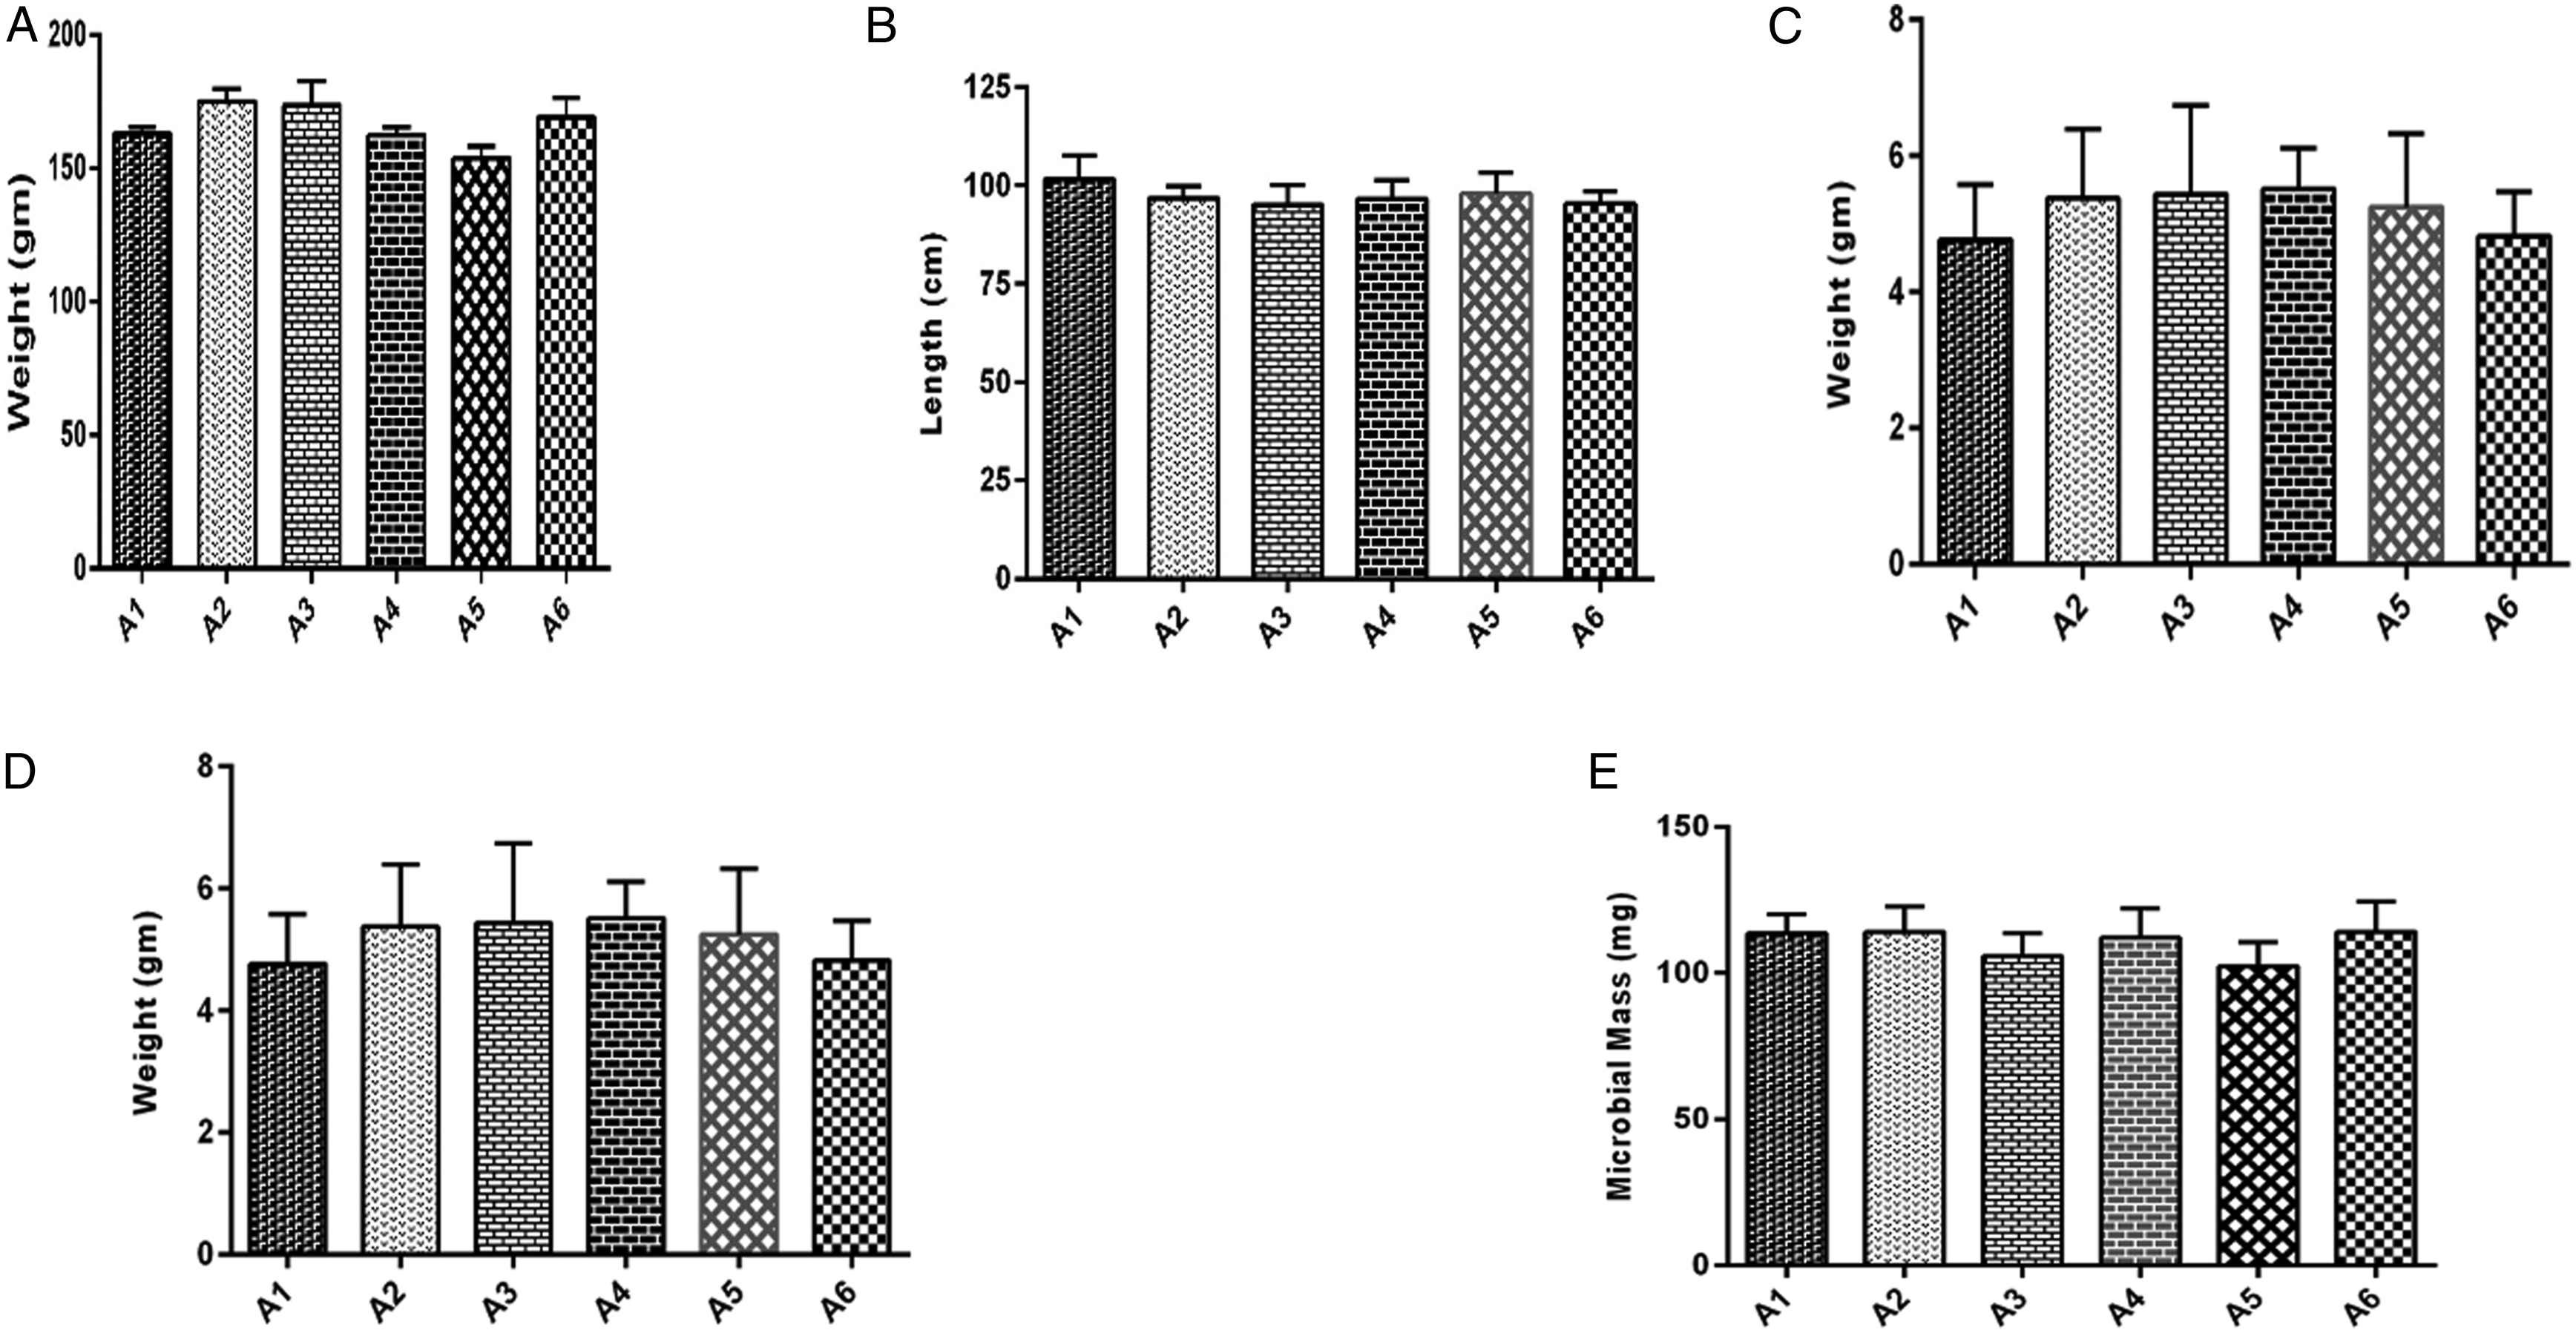
The gut microbiome was able to absorb the maximum concentration of caffeine after 2 hours of intestinal transit time (group A2). Although the caffeine absorption by the microbiome continued till 3 (A3), 4 (A4), and 5 (A5) hours post-drug administration but not at high concentrations. Caffeine was not found in the microbial lysate of microbiome isolated from animals in the control group, without drug treatment (A1) and caffeine-treated group A6 (6 hours intestinal transit time). Caffeine concentration absorbed by the intestinal microbiome was significantly higher (P ≤ .05) in group A2 at 2 hours transit time as compared to all other groups. The intestinal microbiome isolated from group A3 also absorbed caffeine significantly higher (P ≤ .05) as compared to groups; A4, A5, and A6 at transit time of 4, 5, and 6 hours and control group. Caffeine was also found in the microbiome of group A4 which was caffeine significantly higher (P ≤ .05) as compared to groups; A5, A6, and A1 designated as control. Caffeine was also measured in group A5 significantly higher (P ≤ .05) as compared to A6 and A1 (Figure 7). Caffeine absorbance (μg) per mg of microbial mass was found to be significantly higher (P ≤ .05) as exhibited in A2 > A3 > A4 > A5 at 2, 3, 4, and 5 hours post-intestinal transit sampling time (Figure 8). The maximum percentage of administered caffeine dose was recovered from the microbiome of group A2 at 2 hours post intestinal transit sampling time was found significantly higher (P ≤ .05) as compared to groups A3, A4, and A5 at 3, 4, and 5 hours post-intestinal transit sampling time (Figure 9). However, body weight (gm), small intestine length (cm), small intestine weight (gm), wet content weight (gm), and microbial mass pallet weight (mg) were insignificantly different within groups (Figure 10) showing a strict control of the experiment. Principal component analysis analysis of different observed attributes (Figure 11) depicts the maximum contribution of the F1 and F2 components. Extracted component F1 contributed (39.72) followed by F2 (19.21) with a total contribution of 58.93%. Total caffeine absorption shows a significant positive correlation with drug absorption per mg of microbial mass (.996∗∗∗) and given a dose of caffeine (.974∗∗∗) shown in (Table 1). Total caffeine absorbance (n = 6, μg ± SE) by the whole small intestine microbiome measured in different groups: A1 = control (untreated), groups based upon post-caffeine oral treatment (25 mg/kg of body weight) at sampling times A2 = 2 hours, A3 = 3 hours, A4 = 4 hours, A5 = 5 hours, and A6 = 6 hours. Alphabets on mean bars show a significant difference between groups (P ≤.05). Caffeine absorbance (n = 6, μg ± SE) per mg of microbial mass measured in different groups: A1; control (untreated), groups based upon post-caffeine oral treatment (25 mg/kg b-w) sampling time: A2 = 2 hours, A3 = 3 hours, A4 = 4 hours, A5 = 5 hours, and A6 = 6 hours. Alphabets on mean bars show a significant difference between groups (P ≤.05). Percentage dose recovery (n = 6, % ± SE) for a given dose of caffeine measured in different groups: A1 = control (untreated), groups based upon post-caffeine oral treatment (25 mg/kg of body weight) at sampling times A2 = 2 hours, A3 = 3 hours, A4 = 4 hours, A5 = 5 hours, and A6 = 6 hours. Alphabets on mean bars show a significant difference between groups (P ≤ .05). Different physical attributes: (A) body weight (gm), (B) small intestine length (cm), (C) small intestine weight (gm), (D) wet content weight (gm), and (E) microbial mass pallet weight (mg) measured insignificantly in different groups: A1; control (untreated), groups based upon post-caffeine oral treatment (25 mg/kg of body weight) sampling time: A2 = 2 hours, A3 = 3 hours, A4 = 4 hours, A5 = 5 hours, and A6 = 6 hours. Principal component analysis of various attributes observed for a given dose of caffeine measured in different groups: A1 = control (untreated), groups based upon post-caffeine oral treatment (25 mg/kg of body weight) at different sampling times. PDR indicates percent dose recovery. Correlation Among Different Attributes in Control and Caffeine (Single Oral Dose 25 mg/kg of Body Weight) Treated Groups. Abbreviations: B wt, body weight; SI Length, small intestine length; SI weight, small intestine weight; MM, microbial mass; Con wt, wet content weight; TDA, total drug absorption; DA/mg MM, drug absorption per mg of microbial mass. *, **, *** = significance at .05, .01, and .001 levels, respectively. NS = non significant.


Discussion
Previously it has been reported that gut microbiome–drug interactions might result in the drug biotransformation mainly due to the presence of microbial enzymes in the intestinal lumen. These microbial enzymes can influence the permeation and bioavailability of various drugs. 20 Moreover, drugs are rapidly biotransformed when they stay in the intestinal lumen for longer duration.21,22
In the current study, body weight, small intestine length, small intestine weight, wet content weight, and microbial mass pallet weight in caffeine-treated and control groups were found similar as a positive indicator to ensure strict control of experiment and reliability of results. The maximum concentration of caffeine was absorbed at transit time 2 hours and continued till 5 hours post-drug administration confirming a maximum transit time of 5 hours for orally administered drugs. This is in concordance with intestinal transit times of drugs in oral solution is 3 ± 1 hours post-drug administration independent of the fed or non-fed status. 23 Caffeine contains peptide bond structurally (Figure 1) and bears a size of dipeptide which is proposed to absorb through POT present in the genome of Gram-positive gut microbe lactobacilli. 24 Thereby, caffeine emerges as a substrate of the POT family found in the intestinal microbiome as percent dose recovery was about 30% of the given dose in accordance with our previous studies showing uptake of 13.64% and 3.91% of administered dose of paracetamol and sulpiride, respectively.10,17 Moreover, previously reported in vitro data also reveal the absorbance of multiple drugs belonging to different pharmacological classes in YdgR overexpressed and normal E. coli strains. 16
The intestinal microbiome absorbed variable quantities of caffeine at different transit time slots in the current study indicating the first-order drug absorption kinetics following the nonlinear pathway (Figure 12). WHO biopharmaceutical classification system categorized caffeine to class 1 drugs with high solubility and permeability.
25
Thus, caffeine might be absorbed readily via passive transport in the small intestine.26,27 The low molecular weight of caffeine 194.14 also favors its passive transport through OmpF, OmpC, and PhoE porins present in the outer membrane of Gram-negative microbial cell.
27
Such results emphasize to further find the metabolism of caffeine inside the microbial cells as well as in vitro studies for efflux mechanisms in microbial cells as the bioavailability of caffeine is 99% after oral ingestion.
27
Clinically, concomitant use of orally administered drugs may manipulate absorbance of various drugs by microbiome in chronic diseases such as psychosis, hypertension and cardio metabolic diseases. However, caffeine was absorbed initially by the gut microbiome as a competitive substrate with enterocytes, followed by effluxed back into the small intestine for systemic absorption showing maximum bioavailability. Caffeine absorbance by the gut microbiome showing first-order absorption kinetics in a nonlinear pattern.
Conclusion
In the current in vivo microbial drug absorption assay, we hypothesized that the caffeine serves as a novel substrate of the gut microbiome. Caffeine absorption decreased significantly by the gut microbiome after every passing hour during its transit through the small intestine that suggests a first-order nonlinear pattern of absorption. It implies to intrigue further in vitro trials with different gut microbial members individually to find its role in group behavior of the microbiome.
Footnotes
Acknowledgments
Research work is part of the Higher Education commission grant no 7548/Punjab/NRPU/R&D/HEC/2017. Authors are thankful to HEC for providing this grant.
Declaration of conflicting interests
The author(s) declared no potential conflicts of interest with respect to the research, authorship, and/or publication of this article.
Funding
The author(s) disclosed receipt of the following financial support for the research, authorship, and/or publication of this article: The research was conducted through internal funds of the Department of Physiology, Government College University Faisalabad, Faisalabad.