
Abstract
It has been proven a close relationship between intestinal microbiota and hypertension. Valsartan is a widely used ARB antihypertensive drug; so far, the effect of valsartan on intestinal microbiota remains largely unexplored. Herein, we evaluated the composition, structure and metabolites of intestinal microbiota of spontaneously hypertensive rats (SHRs) after valsartan administration. In the present study, valsartan administration decreased intestinal microbiota diversity, altered gut microbiota composition, leading to 192 unique OTUs deficiency (vs WKY rats) and 10 unique OTUs deficiency (vs SHRs) and did not prove impaired intestinal mucosal barriers. Valsartan decreased the production of isobutyric acid and isovaleric acid in SCFAs. Our findings revealed valsartan administration induced far-reaching and robust changes to the intestinal microbiota of SHRs and provided a better understanding of the relationship between efficacy of valsartan and gastrointestinal tract reaction.
Introduction
Hypertension is considered to be a kind of systemic chronic low-grade inflammation. 1 Intestinal mucosal barrier is the first line of defense for non-specific infections. 2 The impair of intestinal mucosal barrier always makes the harmful substances of intestinal contents enter the body more easily, which is considered as one of the development factors of chronic low-grade inflammation. 3 Intestinal mucosal barrier, contact with a large number of intestinal microbiota directly, is closely related to the occurrence and development of hypertension and intestinal microbiota, 4 which plays an important role in the pathogenesis of hypertension. 5,6 Therefore, it is necessary to evaluate the effect of antihypertensive drugs on intestinal mucosal barrier.
Valsartan, one of the ARB antihypertensive drugs, is a first-line antihypertensive drug with relatively clear pharmacological mechanism, but its effect on intestinal mucosal barrier remains unclear. Several cases reported that valsartan had untoward effects of gastrointestinal tract reaction. 7 As such a widely used hypotensor, the gut microbiota affected by valsartan remains largely unexplored.
This study focused on intestinal mucosal barrier of spontaneously hypertensive rats (SHRs), the diversity, functional composition and metabolites of SHRs fecal microbiome when valsartan exposure.
Results and Discussion
Valsartan effectively decreased the systolic blood pressure and diastolic blood pressure of SHRs during the 6-week observation period (Figure 1C and D) (P < 0.05), while demonstrated no significant effect on heart rate (P > 0.05) (Figure 1B). The level of serum NT-pro BNP, NE, NPY, CRP and Ang II of SHRs was higher than that of WKY rats (P < 0.05). After 6-week valsartan administration to SHRs, the levels of serum NT-pro BNP, NPY and CRP were decreased (P < 0.05), while Ang II was increased (P < 0.05) and NE was kept steady (P > 0.05) (Figure 1E). Obviously, our data still supported the previous results as valsartan has widely clinical application due to the excellent antihypertensive effects. Many patients who take valsartan have a loss of weight. 8 In the present study, despite no difference in food consumption among the groups, the body weight of SHRs was decreased significantly after 6-week valsartan treatment (P < 0.01) (Figure 1A). Therefore, we speculated that valsartan may have effect the intestinal microbiota.

General character of rats, including body weight, heart rate, systolic blood pressure and diastolic blood pressure, level of serum NT-pro BNP, NPY, NE, CRP, and Ang II after valsartan administration for 6 weeks. (A), Body weight of 3 groups showing differences are statistically significant (P < 0.05); (B), heart rate; (C and D), blood pressure is measured by non-invasive rat tail method; (E), the level of serum NT-pro BNP, NPY, CRP are significant decreased (P < 0.05), while Ang II is increased (P < 0.05) and NE is kept steady (P > 0.05). * P < 0.05, vs SHRs. (F), The level of serum D-lactate level is increased, vs WKY. * P < 0.05.
Hypertension is the result of a multifactorial interaction. The microbiota is a diverse microbial ecosystem that has coevolved with the host, which plays an important role in multiple physiological processes. The influence of the intestinal microbiota extends further beyond the gastrointestinal tract. 9,10 It has been proven that the microbiome participates in BP regulation and the pathogenesis of hypertension. 11 -13 Yang et al reported that hypertensive patients (SBP: 144 ± 9 mmHg) had decreased bacterial abundance and altered bacterial compositions as compared with normotensive individuals (SBP: 119 ± 2 mmHg). 14 Experimental zoology also verified the associations between features of essential hypertension and alterations in the intestinal microbiota. Fecal microbiota analysis revealed profound differences in the bacterial composition between the SHRs and WKY rats, 14 with the former featuring as reduced taxa abundance and compositional alterations. Durgan et al transferred hypertension from obstructive sleep apnea (OSA) induced-hypertensive rats to healthy rats by fecal microbiome transplantation. 15 Fecal microbiome transplantation from salt-resistance rats might further exacerbate Dahl salt-sensitive rats’ hypertension and adversely affected their lifespan due to the change of level of acetate and heptanoate in cecal content. 16 However, the potential role of the microbiome after antihypertensive drug administration was urgent to further study.
To study the effect of valsartan on intestinal microbiota composition, we performed a GraphlAn analysis to summarize the variation in response variables at the operational taxonomic units (OTUs) level. GraphlAn plot showed that Euryarchaeota phylum was “lost” in SHRs as compared with WKY rats, and this tendency did not reverse while Actinobacteria phylum was over-presented in valsartan exposure SHRs (Figure 2A-C) in phylum level. The relative abundance of intestinal microbiota of 3 groups showed that, as compared to WKY rats, SHRs had more Firmicutes, and less Bacteroidetes (Figure 2D); while valsartan unexpectedly aggravated this vicious tendency (Figure 2D). The abnormal proportion of bacterial flora, which is a manifestation of intestinal flora imbalance, was represented as Firmicutes: Bacteroidetes (F/B) ratio. F/B ratio was positively correlated with blood pressure level in the absence of drug intervention. 17 In the present study, the F/B radio of SHRs was 2 folds higher than that of WKY rats, which was consistent with Yang’s report (5 folds). However, valsartan did not demonstrate powerful efficacy on F/B radio (P > 0.05). Although the blood pressure decreased after valsartan treatment, the irreversible F/B ratio suggested that the intestinal microbiota diversity did not recovery. The Cyanobacteria was decreased in SHRs and SHRs with valsartan administration as compared with WKY rats. According to a study of Bakir EM et al, 18 the cyanobacterial extract, produced an inhibitory effect on isoproterenol-induced changes in arterial pressure indices and antioxidant capabilities of the heart, showed the beneficial effect on blood pressure protection. Obviously, the “lost” of Cyanobacteria of SHRs may partially detrimental to blood pressure regulation. Similarly, SHRs with valsartan administration did not showed the recovery tendency on Cyanobacteria. In total, valsartan administration leaded 192 unique OTUs deficiency (vs WKY rats) and even 10 unique OTUs deficiency (vs SHRs) (Figure 2E). Confusingly, valsartan aggravated the decrease tendency in the diversity of intestinal microbiota in hypertension. According to our data, valsartan, to a certain extent, demonstrated some effect similar to antibiotics on intestinal microbiota.

OTU clustering and survey of species annotation of 3 groups. A (WKY rats), B (SHRs), and C (valsartan administrated SHRs) showing respective dominant strains; D, Top 10 species at the phylum level, in which others stand for the sum of the relative abundance of all the other genera outside the 10 gates in the graph. E, Venn plot shows that the common and different intestinal microbiota of 3 groups.
To explore the differences in microbial communities between the groups, we performed an analysis of α-diversity and β-diversity. Estimation of α-diversity of bacterial 16 S rRNA (Figure 2A and B) suggested a decreased α-diversity in SHRs after valsartan treatment. Valsartan decreased powerfully the OTUs and phylogenetic diversity whole tree (PD whole-tree) of SHRs (P < 0.05). PCoA plots, which was a kind of β-diversity analysis between groups, showed that intestinal microbiota compositions of the WKY group, valsartan group, and SHRs group were significantly separated, indicating that administration of valsartan contributed to changes incomposition of the intestinal microbiota (Figure 2C). LEfSe analysis was used to discover high dimensional biomarkers and to reveal the characteristics of the genome. The strict version of LEfSe (all against all) revealed 27 different bacterial clades among groups (LDA scores > 4) (Figure 3D). Screening of intestinal microbiota suggested that Bacteroidetes, Proteobacteria (at phylum level) and Escherichia-Shigella (at genus level) were the potential biomarkers of WKY rats. Firmicutes (at phylum level) and Lactobacillus (at genus level) were the potential biomarkers in valsartan group while Romboutsia (at genus level) was the potential biomarkers in untreated SHRs. Remarkably, valsartan significantly increased the abundance of Lactobacillus in the present study and Lactobacillus had beneficial effect on decreasing blood pressure according to recent studies. 19,20 Nevertheless, the ability of probiotic microbiota to improve blood pressure remains uncertain. It was largely depended on intestinal microbial disorders and increased intestinal permeability. 21,22 According to our data, despite of the rehabilitation of Lactobacillus, the balance of intestinal microbiota of SHRs after valsartan administration was not powerful enough. So, we further focused on the intestinal mucosal barrier.

Valsartan administration decreased intestinal microbiota diversity. (A and B) ACE plots and PD whole tree are 2 of α-diversity indexes. The black line in the middle of the rectangle in every group represents the median. The larger the area, the larger the value. (C) PCoA analysis by β-diversity analysis. The more similar the composition of different groups, the closer the position in the plot. The plot showing large distance between 3 groups; (D) Potential biomarker by LeFSe analysis. Linear discriminant analysis value distribution histogram. The prefixes of p, c, o, f, g, s before the species represent six different taxonomic levels: phylum, class, order, family, genus and species.
Intestinal mucosal barrier has the functions of biological barrier, chemical barrier, immune barrier and mechanical barrier under physiological and pathological conditions. Zonula occludens protein 1 (ZO-1) plays an important role in coordinating the function of cell bypass barrier and balancing the permeability of intestinal epithelial cells. Our study showed that ZO-1 was significant down-regulated under hypertension state while valsartan did not substantially renovate the impaired intestinal mucosal barrier. Density of ZO-1 was at very low level in SHRs and did not increase much after valsartan administration (Figure 4A). Notably, there was no significant visually necrotic and ulcerative changes in the colon tissues of SHRs after valsartan administration (Figure 4B). Furthermore, qRT-PCR showed that ZO-1 mRNA expression in the small intestine was significantly decreased in SHRs as compared with WKY rats, while there was no significant changing after valsartan treatment (Figure 4C). Thus, we thought the imbalance of intestinal microbiota mentioned above as the one of manifestation of the biological barrier damage. D-lactate was the metabolite of intestinal microbiota, 23 D-lactate passes into peripheral blood when intestinal mucosal barrier function is impaired. 24 Therefore, we determined the level of serum D-lactate to assess intestinal barrier function (Figure 4D). Higher level of serum D-lactate of SHRs indicated higher intestinal permeability of SHRs. While, although valsartan increased the abundance of Lactobacillus, the level of serum D-lactate was not altered significantly in valsartan group. Several researches. 25,26 showed that prebiotics produced by probiotics which were benefit for blood pressure worked by oral rather than intravenous or intraperitoneal injection. 27 So, the impaired intestinal mucosal barriers were undoubtedly against the expected effects of valsartan. The specific mechanism of how lactate worked in the intestine deserves further attention.

Immunohistochemistry of ZO-1 and morphology. A, The positive expression of ZO-1 is brown granules. B, Morphologic changes of colon tissues in HE staining after 6-week administration (× 200). C, ZO-1 mRNA expression in the intestinal mucosa was assessed using qRT-PCR. D, The levels of serum endotoxin are shown. * means that significant differences between groups.
To throw an insight on the regulatory mechanism, we performed GC-MS assay to determine the microbial-derived bioactive metabolites (Figure 5). Short chain fatty acids (SCFAs) played an important role in metabolic control, appetite regulation and immune function, especially in the gut barrier integrity and host’s immune response. 28 Intestinal SCFAs are main metabolites of intestinal microbiota. 29 The present study showed that SHRs had higher level of fecal butyric than WKY rats regardless of whether valsartan treatment or not. Valsartan administration decreased the level of isobutyric acid and isovaleric acid in SHRs. There was no significant difference in acetic acid, propionic acid, valeric acid and caproic acid among the 3 groups. Several studies showed that higher SCFA concentrations were associated with a measure of gut permeability, lower levels of microbial diversity and hypertension. 30 SCFAs, including butyrate in particular, are used preferentially as important fuel for colonic epithelial cells and have trophic effects on the epithelium. 29 Isobutyric acid and isovaleric acid demonstrate an important effect on the balance of lipid metabolism by inhibiting the phosphorylation of hormone sensitive lipase and adipogenesis induced by insulin and isoproterenol. 31 Our data suggested SCFAs, as main metabolites of intestinal microbiota, may partly contribute to the efficacy of valsartan. Wu et al reported that candesartan treatment increased the amount of fecal SCFAs (particularly acetic acid, propionic acid, and butyric acid) in SHRs, while valsartan decreased the amount of isobutyric acid 32 and isovaleric acid and aggravate intestinal microbiota imbalance in the present study. We speculated that this might be one of the reasons why clinical evaluation of ARB drugs was not superior to other antihypertensive drugs.
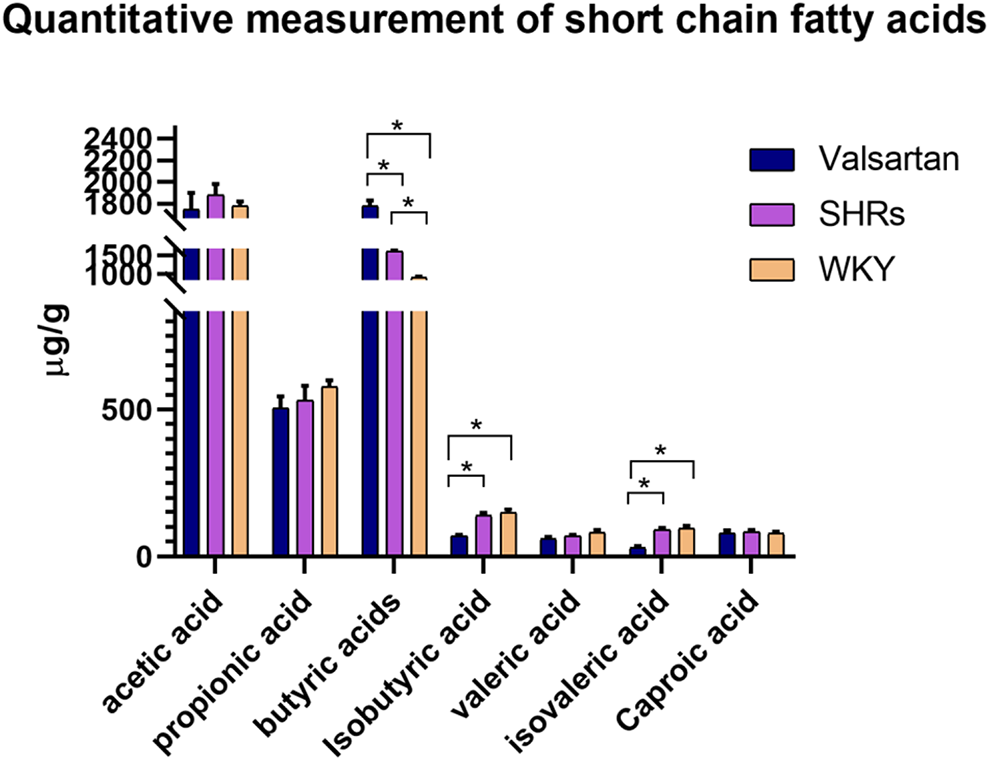
Quantitative measurement of fecal short fatty acids by GC-MS analysis (μg/g). P value < 0.05 was regarded statistically significant. * means significant differences between groups.
Conclusion
Valsartan decreased intestinal microbiota diversity, altered gut microbiota composition, the production of SCFAs, and intestinal mucosal barrier, which may, at least partly, related to the effect of valsartan. Valsartan may bring more clinical benefits if effective measures are taken to prevent the destruction of intestinal microbiota and protect the intestinal mucosal barrier.
Materials and Methods
Rats and Preparation
The study was approved by the Faculty of medicine & health sciences ethics committee for animal research (No. AF/SC-08/02.0), affiliated hospital of Shandong university of traditional Chinese medicine (Jinan, China). All animal and experimental procedures in this study were performed in accordance with the Regulations on the Management of Experimental Animals of People’s Republic of China (revised version March 1st, 2017). 12 male spontaneously hypertensive rats (SHRs, 8-9 weeks old) and 6 even-aged WKY rats were purchased from Beijing Vital River Laboratory Animal Technology Co., Ltd. (Certificate: SCXK (Jing) 2016-0011). The rats were reared under the condition of constant temperature (20-22°C), constant humidity (50%-60%), fixed light and shade alternation (12h/12 h). All rats got access to Cobalt 60 sterilized fodder (Vital River Laboratory Animal Technology, Beijing, China) and ultrapure water ad arbitrium. After a 5-day adaptive feeding, SHRs in valsartan group were given valsartan (7.4 mg/kg/day, 1.29 mg/ml, purity: 99%, Lot: X2094, Novartis Pharmaceutical Co., Ltd, Beijing, China) intergastrally for 6 weeks. The WKY rats and rats in SHR group were given the same volume of normal saline.
Blood Pressure Measurement
Body weight was recorded weekly. Blood pressure was measured in conscious rats by a non-invasive tail-cuff method (MRBP-10, IITC life science, USA) weekly. BP measurements were carried out in the subjects to adapt to the pressure measurement environment for 1 week before formal recording. The rats were fixed in ALC-HTP animal system in a quiet and awake state. The systolic pressure and heart rate were measured at a quiet temperature of 29-31°C. Take the average of 5 measurements in parallel with an interval of over 1 minute.
Enzyme Linked Immunosorbent Assay (ELISA)
The rats were anaesthetized with 3% pentobarbital sodium (30 mg/kg, i.p.), Blood samples were taken from inferior vein and serum was isolated. The levels of serum N-terminal B-type natriuretic peptide (NT-proBNP) (BioYun, 10338 R, Shanghai, China), neuropeptide Y (NPY) (BioYun, 10257 R, Shanghai, China), NE (BioYun, 10111 R, Shanghai, China), C-reactive protein (CRP) (BioYun, 10202 R, Shanghai, China) and angiotensin II (Ang II) (BioYun, 10249 R, Shanghai, China) were detected by ELISA.
Fecal 16 S rDNA Sequencing
Stool samples were collected by pinching the tail to let rats defecate under stress and collected from anus to the sterile centrifuge tubes directly after 6 weeks treatment. All samples were kept at −80°C. The project was performed by Novogene Technology Co., Ltd. (Beijing, China, Project No. p101sc17020776-01-s1-3-2).
DNA extraction and PCR
Total genome DNA was extracted using CTAB/SDS method. DNA concentration and purity was monitored on 1% agarose gels. DNA concentration was adjusted to 1ng/μ L. 16 S rRNA genes of distinct region were amplified used specific primer. 16 S V4: 515F-806 R. Primer sequences were: 5’-GTGCCAGCMGCCGCGGTAA-3’/ 5’-GGACTACHVGGGTWTCTAAT-3’. All PCR reactions were carried out with Phusion High-Fidelity PCR Master Mix (New England Biolabs). PCR products were confirmed with 2% agarose gel electrophoretic analysis and samples with bright main strip between 400-450 bp were chosen and purified with Qiagen Gel Extraction Kit (Qiagen, Germany).
Library construction and sequencing
Sequencing libraries were generated using TruSeq DNA PCR-Free Sample Preparation Kit (Illumina, USA) following manufacturer’s recommendations and index codes were added. The library quality was assessed on the Qubit 2.0 Fluorometer (Thermo Scientific) and Agilent Bioanalyzer 2100 system. At last, the library was sequenced on an IlluminaHiSeq2500 platform and 250 bp paired-end reads were generated.
Data processing and analysis
Paired-end reads was assigned to samples based on their unique barcode and truncated by cutting off the barcode and primer sequence. Sequence assembly Paired-end reads were merged using FLASH (V1.2.7). Quality filtering on the raw tags was performed under specific filtering conditions to obtain the high-quality clean tags according to the QIIME (V1.7.0) (31) quality-controlled process. The tags were compared with the reference database (Golddatabase) using UCHIME algorithm to detect and remove chimera sequences. Then the Effective Tags finally obtained.
Sequences analysis was performed by Uparse software (Uparse v7.0.1001). Sequences with ≥ 97% similarity were assigned to the same OTUs. Representative sequence for each OTU was screened for further annotation. For each representative sequence, the GreenGene Database 3was used based on RDP classifier (Version 2.2) algorithmto annotate taxonomic information. Multiple sequence alignment were conducted using the MUSCLE software (Version 3.8.31, http://www.drive5.com/muscle/). OTUs abundance information was normalized using a standard of sequence number corresponding to the sample with the least sequences. Subsequent analysis of alpha diversity and beta diversity were all performed basing on this output normalized data.
Histopathological Examination and Immunohistochemistry
Hematoxylin and eosin (H&E) staining
At the end of 6 weeks, 3 cm of proximal colons were collected from the euthanized animals and fixed in 4% paraformaldehyde, followed by processing for paraffin embedding and sectioning. Paraffin sections 4 µm thick were subject to H&E staining.
Density of ZO-1 protein
After the paraffin section was dehydrated and transparent, the non-specific antigen was blocked with 3% hydrogen peroxide, and the antigen was repaired by high-temperature and high-pressure repair method. And then the slides were incubated at 4°C with primary antibodies (1:100) overnight and the staining operation was carried out according to the instructions provided by the kit. (Affinity Biosciences, AF5145, Jiangsu, China).
Determination of Serum D-Lactate
Enzyme credit spectrophotometry was used to detect the level of plasma D-lactate. The plasma was added to the tube and mixed with carbonate buffer containing 4.6 mmol/L NAD+. Add 50 µL D-lactate dehydrogenase to the test tube, and 50 µL distilled water to the blank tube. Adjust zero using the blank tube and measure the absorbance at 340 nm. The standard curve range of D-lactate was 3.125-50 mg/L.
Real-Time PCR Analysis
The total RNA was extracted by Trizol method and was isolated from the proximal colon, the cDNA was synthesized by reverse transcription according to the instructions of the kit. A 20 µL PCR system was established: 2 × Master Mix 10.0 μL, water 6.0 μL, primer 2.0 μL, cDNA 2.0 μL. The reaction conditions were: pre denaturation for 5 s at 95°C, denaturation for 10 s at 95°C, annealing for 10 s at 60°C, extension for 10 s at 72°C, amplification for 45 cycles; denaturation for 5 s at 95°C, extension for 60 s at 65°C, instantaneous inactivation of enzyme at 97°C, cooling for 10 s at 40°C. The data were analyzed by 2-ΔΔ CT method. The primers were synthesized by Shanghai Biotechnology Co., Ltd. Primers sequences of ZO-1 are: CATAAGGAGGTAGAACGAGGCATCATC/TTGAACTGGCTGAGCTGACAAGTC.
Determination of the Level of Short Chain Fatty Acids by GC-MS Analysis
The project was performed by OE Biotech Co. Ltd. (Shanghai, China, Project No. QDOE2017s907).
GC conditions: A DB-WAX capillary column (30 m × 0.25 mm × 0.25 μm, Agilent J & W Scientific, Folsom, CA, USA) was utilized to separate the derivatives at a constant flow of 1 mL/min helium. 1 µL of sample was injected in split mode in a 10:1 split ratio by the autosampler. Injection temperature was 250°C, and the ion source adjusted to 230°C. The initial temperature of the programmed temperature rise is 90 °C, then the programs of temperature rise was followed by initial temperature of 120°C for 3 min, 6°C /min rate up to 150°C, 25°C /min to 250°C for 2 min and staying at 250°C for 2 min.
MS conditions: Mass spectrometry was determined by full-scan method with electron energy 70ev.
Standard preparation and treatment: The pure standards of acetic acid, propionic acid, butyric acid, isobutyric acid, valeric acid, isovaleric acid and hexanoic acid were weighed accurately. Prepared ten mixed standard concentration gradients of 0.1 µg/ml, 0.5 µg/ml, 1 µg/ml, 5 µg/ml, 10 µg/ml, 20 µg/ml, 50 µg/ml, 100 μg/ml, 200 µg/ml, 400 µg/ml with ethyl acetate. Then, took 600 µL standard, added the isohexanoic acid with the final concentration of 500 µm as the internal standard, mixed it and added it into the injection bottle for GC-MS detection.
Samples were unfreezing on ice, accurately weighed 100 mg into centrifuge tube. Added 1000 µL of 0.5% phosphoric acid for heavy suspension, shaked and mixed for 2 min; centrifuged 17949 g for 10 min, took 800 µL of supernatant, added equal amount of ethyl acetate for extraction, shaked and mixed for 2 min, and centrifuged 17949 g for 10 min; took 600 µL of upper organic phase, added 4-methylvaleric acid with final concentration of 500 µm as internal standard, mixed and added into sample bottle for GC-MS detection.
Statistical Analyses
Quantitative data were expressed as mean ± SD. The statistical analysis was performed using SPSS. 20.0. α-diversity was used to assess abundance intragroup and identify community diversity which was calculated with QIIME (Version 1.7.0) and displayed with R software (Version 2.15.3). Beta diversity was used to evaluate differences of samples in species complexity and calculated by QIIME software (Version 1.7.0). P value < 0.05 was regarded statistically significant.
Footnotes
Authors’ Note
Data availability statement was uploaded and stored in the public database of Sequence Read Archive. Sequence Read Archive (SRA) submission number: SUB7318271. Qi YZ, performed the experiments, conducted animal care and drafted the manuscript. Jiang YH, performed the experiments and revised the manuscript. Jiang LY presided GC-MS analysis. Shao LL carried out data collection and data analysis. Yang XS organized picture materials and statistical analysis. Yang CH designed the study, contributed to discussion and carried out important revisions of the article. All authors read and approved the final manuscript.
Acknowledgments
This study was supported by Shandong Province “Taishan Scholar” Construction Project Funds No. 2018-35 and National Natural Science Foundation of China No. 81673807.
Declaration of Conflicting Interests
The author(s) declared no potential conflicts of interest with respect to the research, authorship, and/or publication of this article.
Funding
The author(s) disclosed receipt of the following financial support for the research, authorship, and/or publication of this article: This study was supported by Shandong Province “Taishan Scholar” Construction Project Funds No. 2018-35 and National Natural Science Foundation of China No. 81673807.