
Abstract
As concentration (dose) of health care providers increases, health outcomes (responses) are expected to be favorable (e.g., decrease in mortality rates). Accordingly, this data-driven, ecological study compares hypertension mortality rates in the U.S. by state to concentrations of doctors of chiropractic (DC) and medical doctors (MD). DC and MD concentrations (per 10,000 population) were separately compared to 2008 hypertension death rates using Spearman correlation analysis and linear regression (where appropriate). DC concentrations revealed a stronger beneficial association with hypertension death rates (r = −0.430, p = 0.0020) compared to MD concentrations (r = −0.029 with an observed outlier, and r = −0.085 without the outlier; both coefficients not statistically significant). Linear regression revealed that an average national decrease of approximately one hypertension death per 100,000 population (95% CI = −1.4 to −0.4) would be expected with an increase of one DC per 10,000 population within the range in this study (1.0 to 5.2 DCs per 10,000 population). Since this is an observational study, causal inference is not claimed. The study is intended as a first step to research having other designs such as case-control.
INTRODUCTION
As concentrations of health care practitioners increases, access to their services is expected to also increase, with an expected decrease in adverse health outcomes (such as hypertension mortality rates). The present ecological, data-driven study compares correlations of 2007 MD and DC concentrations with 2008 hypertension mortality rates.
The condition of hypertension was selected because there is some evidence that a reduction in blood pressure in hypertensive patients occurs following chiropractic care. Whedon (2013) reported on a case study where blood pressure decreased from 134/98 to 114/80 following chiropractic care. In a practice-based setting, Torns (2012) found statistically significant reductions in systolic and diastolic blood pressures in 18 patients with hypertension following chiropractic care that focused on the upper cervical spine. Welch and Boone (2008) found a significant reduction in diastolic blood pressure in a convenience sample of asymptomatic chiropractic students. In another practice-based pilot study, Plaugher et al. (2002) also found a statistically significant reduction in diastolic blood pressure in the chiropractic care group but not in massage or no-intervention groups. Bakris et al. (2007) also conducted a pilot study where patients with Stage 1 hypertension were randomized into a chiropractic group or sham group. Here, statistically significant reductions were observed in the chiropractic group (that also focused on the upper cervical spine, in particular, C1) compared to reductions in the sham group for systolic and diastolic blood pressures.
Approximately two-thirds of chiropractors in North America address a condition known as subluxation (McDonald et al., 2004) which in concept includes a neurological component (Chiropractic, 2013). Consequently, the mechanism for a possible beneficial effect on hypertension from adjusting subluxation presumably pertains to neurological pathways in the spine and peripheral nervous system (Bolton, 2000; Budgell, 2000).
While the aforementioned chiropractic studies assessed changes in hypertension morbidity following chiropractic care, the present study assesses hypertension mortality in the context of chiropractic care, and compares this correlation to medical care correlation. Causes and treatments of hypertension are well known and beyond the scope of this paper. The purpose of the present study is to simply compare the correlations between DC and MD concentrations (doses) in relation to hypertension mortality rates (responses).
METHODS
Age-adjusted essential hypertension and hypertensive renal disease (both in combination now referred to in this study as “hypertension”) mortality rates per 100,000 population in the U.S. by state and District of Columbia for 2008 were obtained (Minino et al., 2011). Two states, Alaska and Wyoming, showed unavailable data. Thus, the number of observations was 49 (48 states + District of Columbia). Active DC numbers for 2007 by state and District of Columbia were obtained from the Federation of Chiropractic Licensing Boards (Active licenses, 2012). Total active medical doctor (MD) numbers also for 2007 by state and District of Columbia were obtained from the Statistical Abstract of the United States (Health and nutrition, 2010). Practitioner numbers were divided by general total populations by state and District of Columbia in 2007 (Resident population, 2013) and then multiplied by 10,000 to obtain a practitioner (DC and MD) ratio per 10,000 population. For example, for Alabama, the DC total number was 784 and total population was 4,637,904, so 784/4,637,904 ∗ 10,000 = a DC ratio of 1.69 per 10,000 population. The MD ratio for Alabama was 21.76 (10,094/4,637,904 ∗ 10,000).
The hypertension death rates were correlated with the DC and MD concentrations using the Spearman correlation and, where appropriate, linear regression (for linearly related variables) in Stata IC 12 (StataCorp, College Station, TX). For the coefficients (Spearman and regression), p-values less than or equal to the traditional alpha of 0.05 are considered statistically significant.
RESULTS
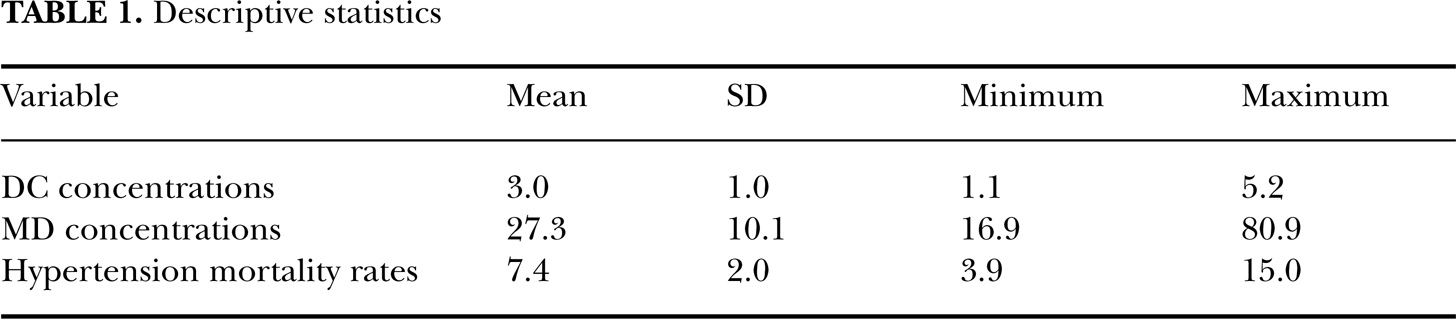
Descriptive statistics are provided in Table 1. Scatter plots revealed no obvious outliers for DC concentrations (Figure 1) while an obvious outlier was observed for MD concentrations (Figure 2). Thus, correlation for MD concentrations was performed with and without the outlier. A statistically significant inverse (beneficial) correlation having a strength that was approximately moderate was observed for DC concentrations (r = −0.430, p = 0.0020). Weak strength, statistically insignificant correlations were observed for MD concentrations (with outlier: r = −0.029, p = 0.8, Figure 2; without outlier: r = −0.085, p = 0.6, Figure 3).
Descriptive statistics

Scatter plot for 2007 DC concentrations and 2008 hypertension death rates.

Scatter plot for 2007 MD concentrations and 2008 hypertension death rates, with outlier (on right hand side of graph).

Scatter plot for 2007 MD concentrations and 2008 hypertension death rates without the outlier (correlation essentially unchanged).
Only the DC concentration variable revealed a (fairly) linear relationship with the response variable and therefore was the only predictor used in linear regression. Here, a statistically significant R-squared value was observed for the model (R-squared = satisfactory R-squared value was observed for the model (R-squared = 0.202, p = 0.0012) with a regression coefficient of −0.9 (95% CI = −1.4 to −0.4; t = −3.45, p = 0.001). Thus, for every average increase of one DC per 10,000 population nationally (within the range of these data, which was 1.0 to 5.2 DCs per 10,000 population), a corresponding average national decrease of approximately one death per 100,000 population is expected.
DISCUSSION
The plausibility of chiropractic care having a beneficial effect on hypertension, and therefore hypertension mortality rates was addressed in the Introduction. Another plausible explanation for the beneficial correlation for DCs is that they may generally provide more counseling on healthy lifestyle habits to their patients compared to MDs, though the DC numbers are obviously smaller than that of their MD counterparts. McDonald et al. (2004) report that 97.8% of chiropractors surveyed routinely recommend exercise to their patients compared to the similar figure of 91.0% for physicians (Williford et al., 1992). Though the physician survey is a bit older than the chiropractic survey, the physician percent has likely approached the chiropractor percent given the likely increase in society for healthy lifestyles since 1992. The disparity of numbers between the two practitioner types highlights another question of plausibility of this study: Can the relatively small number of DCs really make a difference? It is estimated that chiropractors see approximately 8% of the population in a given year (Chiropractic, 2012). Thus, approximately 8,000 out of 100,000 people are estimated to see a chiropractor in a given year. The national mean hypertension death rate is 7.7 per 100,000 population (for essential hypertension and hypertensive renal disease; Minino et al., 2011). Consequently, it does not seem too far out of the realm of plausibility that chiropractors could affect this 7.7 mortality rate by seeing 8,000 out of 100,000 persons.
The ecological design is also a limitation to this study since it analyzes population data rather than data from known individuals. However, the ecological design is valid as a first step method in research (Grimes and Schulz, 2002). Furthermore, if the ecological design is dismissed simply because it does not analyze known individuals, then it would seem that other accepted research that is based on ecological design, such as charts intended to show effectiveness of vaccination (Figure 4; Vaccines, 2013), would also have to be dismissed. Nonetheless, further research is warranted with other designs, such as a clinical trial of chiropractic versus medical care using the outcome used in the present study.
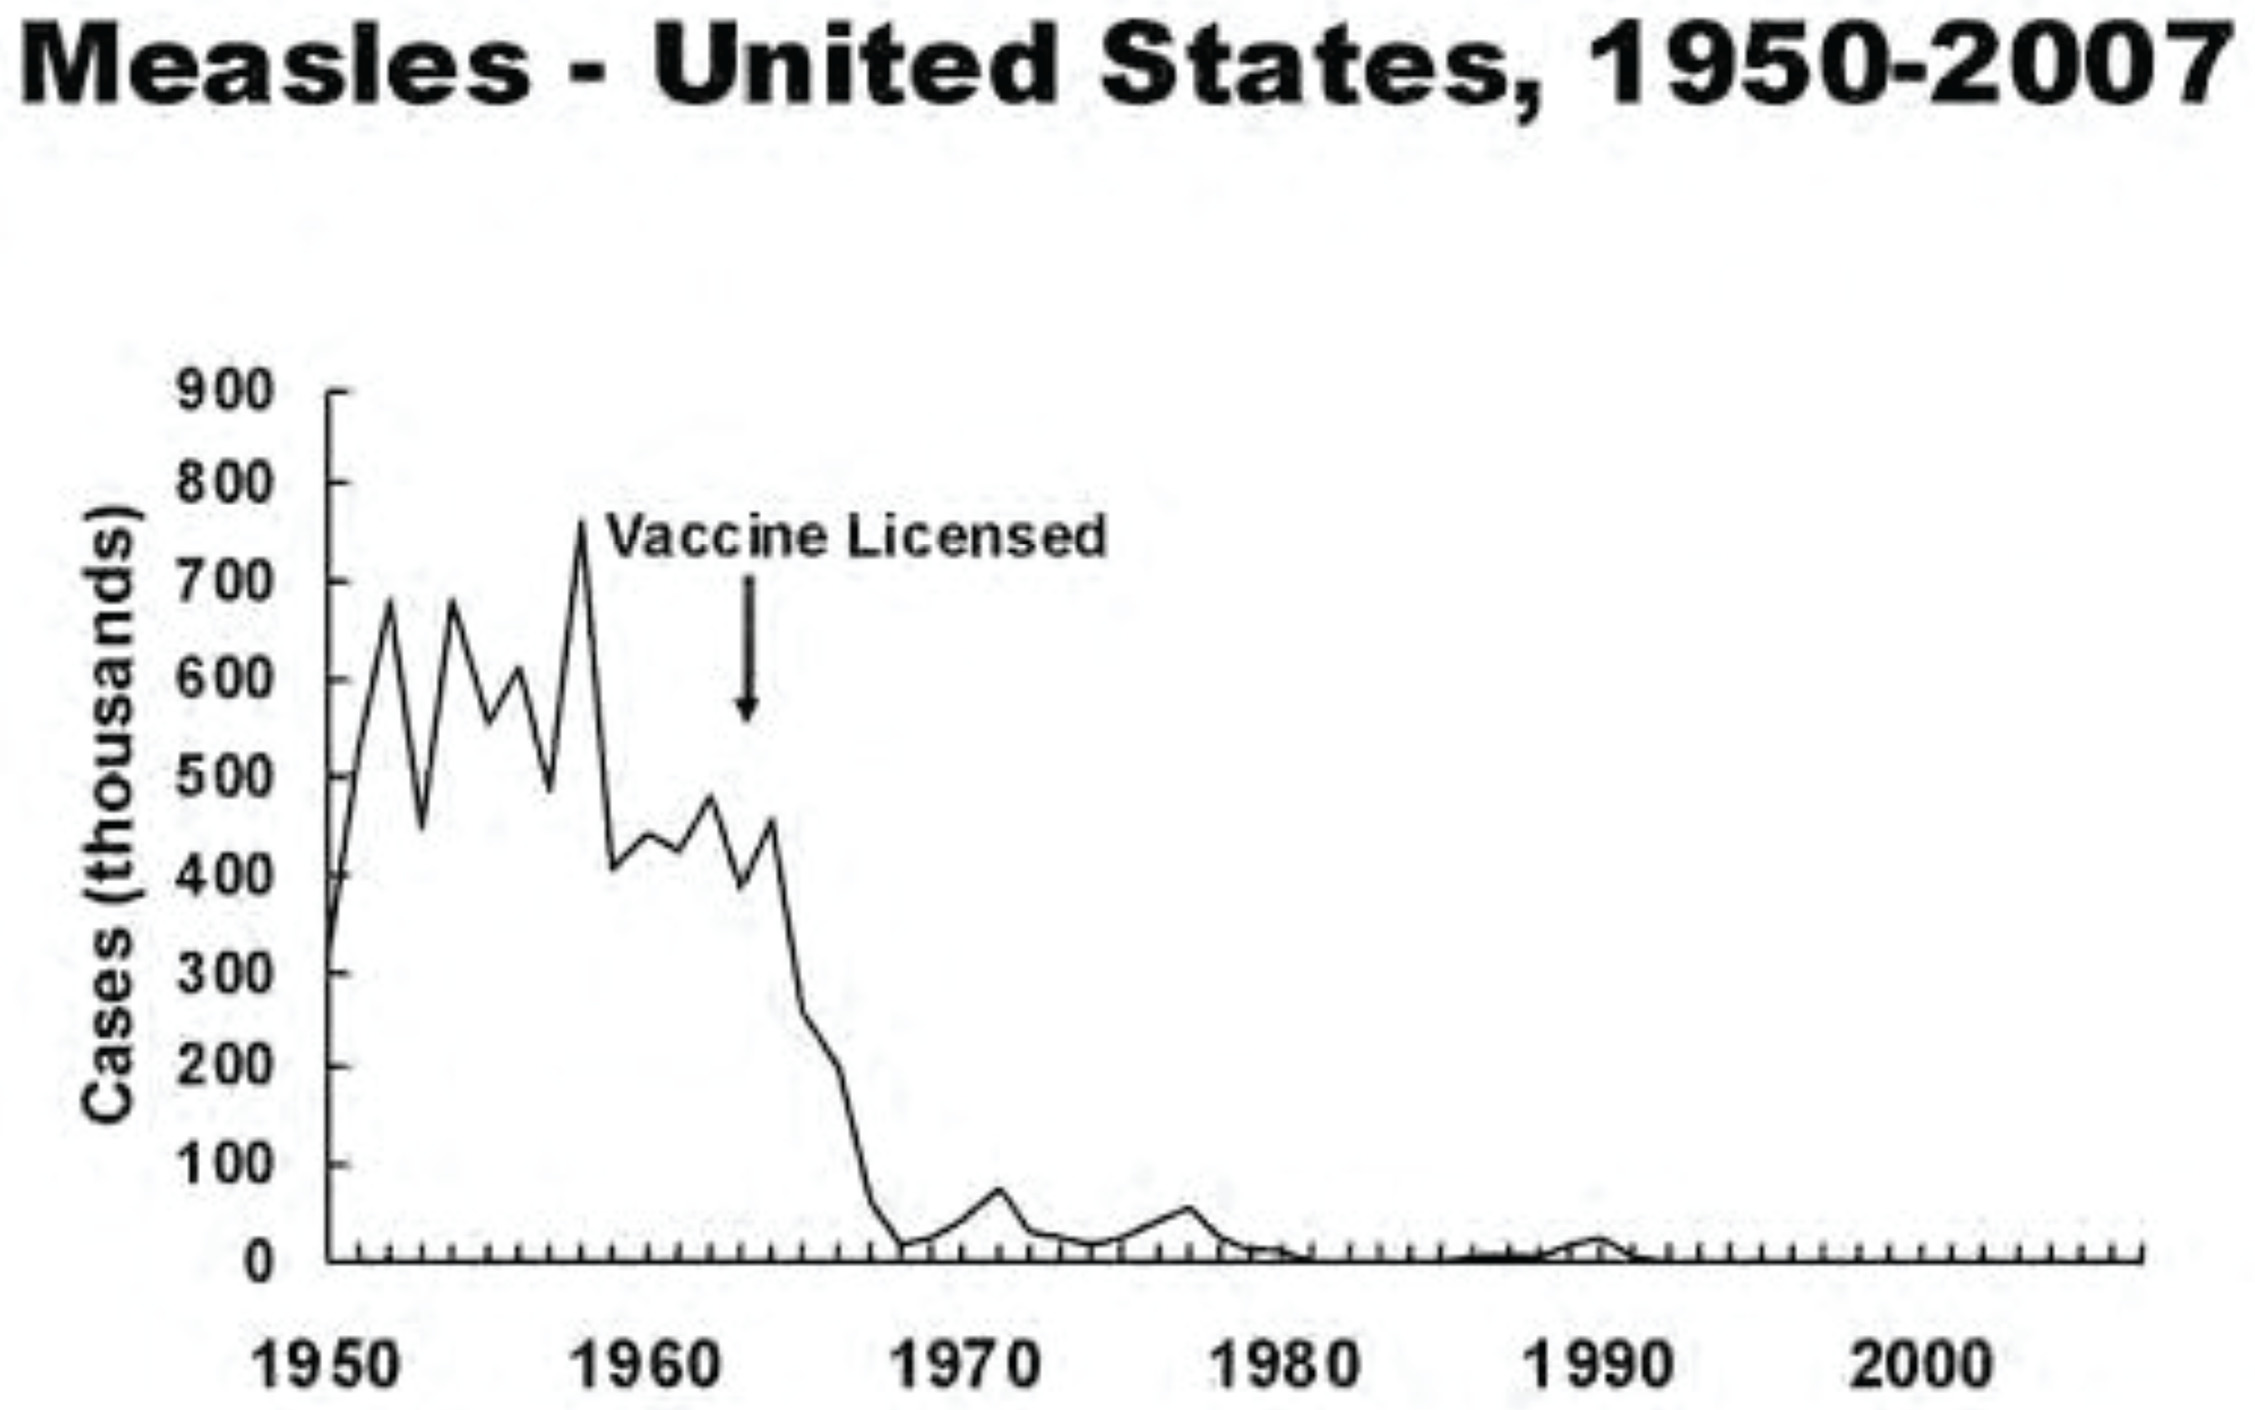
Chart intended to show effectiveness of measles vaccination (from Vaccines, 2013). It is unclear as to whether the decrease following the licensing of the vaccine represents individuals who actually received the vaccine. Hence, the chart provides data from an ecological study.
CONCLUSION
In this ecological study, DC concentrations (dose) revealed a stronger beneficial correlation with decreased hypertension (essential hypertension and renal hypertensive disease) mortality rates (response) compared to MD concentrations as evidenced by scatter plots and correlation coefficients. Since this is an observational study, causal inference is not claimed. Further research with other designs is indicated to verify these findings.