
Abstract
Chemoprophylatic strategies against development of multifactorial diseases utilize compounds to block the multistep events in chronic inflammation and carcinogenesis. The successful chemopreventative candidate must therefore selectively inhibit growth of transformed cells and be administered frequently to confer maximal protection with minimal side effects. In addition to synthetic and exogenous natural compounds, endogenous metabolites represent another class of compounds that exhibit anticarcinogenic and anti-inflammatory properties contributing to proper cell function. To assess the effectiveness of these compounds warrants an understanding of their cytotoxic mode of action. In this study, p53 variant human colon carcinoma cell lines were chronically exposed to varying concentrations of the endogenous metabolites—phenyl acetate, ursodeoxycholate, and tauroursodeoxycholate—to determine the role of p53-induced cytotoxicity, with p53 mutant and deficient cell lines representing precancerous lesions. Cytotoxicity was assessed using clonogenic assays, and macroscopic colony counts were used to quantify cell survival. The results demonstrate that the bile acids, ursodeoxycholate and tauroursodeoxycholate, exhibit selective cytotoxicity toward nonfunctional p53 cell lines suggesting a p53-mediated role in inhibition of cell clonogenicity and potential chemopreventative properties. Although each compound displays this described effect, the tauroursodeoxycholate demonstrates high significance suggesting it might have practical uses in vivo.
Introduction
Chemoprophylactic strategies in cancer and inflammatory diseases involve the use of compounds aimed to block/inhibit the multistep events in the initiation, progression, and promotion phases of the diseases. These multistep events consist of chronic exposures to stressors and carcinogens (including ionizing radiation) that act to produce mutations or inflammatory responses in cells that lead to mutator phenotypes in precancerous cells as well as exacerbate systemic immune dysfunction. 1 These compounds therefore function to modify the intracellular environment to protect from these injuries directly, for instance as antioxidants, as well as inhibit the phenotypic modifications that occur downstream through assisting proper regulation of cell function and promotion of cell apoptosis. 2,3 Alternatively, the compound might also alter the extracellular environment to promote immunostimulatory activity as well as block other surrounding paracrine cellular signaling components that contribute to tumor proliferative processes. 4,5 Cells naturally regulate these carcinogenic events without exogenous compounds via production of endogenous proteins; however, mutations in the genes that code for these products might impair the capability of these regulatory processes, for instance suppressing tumors in the case of p53 transcription factor and antioxidant activity of catalase enzymes. 6 Therefore, defects/deficiencies in these pathways represent impairments in regulatory processes where the introduction of additional supplementary endogenous compounds might be useful and represent targets in compound screening tests.
Endogenous metabolites represent both intermediates of cellular metabolism that aid in the proper functioning of the cell and by-products that play roles in regulating cellular processes. 7 These compounds are not direct protein products of transcription although enzymatic conversion and therefore enzymes are important in their production. 7,8 Although exogenous compounds represent a worthy lead of research, endogenous metabolites represent another class of nonsynthetic alternative compounds that might satisfy the criteria of chemoprevention. Like exogenous compounds, their appeal is administration via oral consumption by in vivo endogenous metabolite supplementation to target cells. Unlike exogenous compounds, these compounds demonstrate utility by supporting regulation and function in many different pathways; for instance, phenyl acetate participates in cellular signaling cascade pathways. 9
Aims
Cytotoxic profiles of endogenous metabolites implicated in chronic fatigue immune dysfunction syndrome (CFIDS) on isogenic cell lines might provide vital data on the mechanistic basis of these substances in vitro to determine the targets of cellular growth inhibition. Specific substances might interfere in certain cellular pathways that are conducive to carcinogenic processes and therefore act to inhibit these processes. Given these compounds exist naturally in vivo, they typically exhibit high tolerance levels in the organism in comparison to exogenous compounds because they do not inhibit cellular processes. However, at high doses, feedback mechanisms might impair the efficacy of such treatments by lowering the production of the naturally occurring compounds; therefore, appropriate dosing must be accomplished by optimizing the compound cytotoxicity. Additionally, these mechanisms might provide us with information on modifications that enhance the specific activity of the substances. This study investigates the interaction of the endogenous metabolites—phenyl acetate, ursodeoxycholate, and tauroursodeoxycholate—with p53 variant human colon carcinoma cell lines: HCT116 p53 wild-type (wt), HT29, and HCT116 p53 null. where HT29 and HCT116 p53 null cell lines represent precancerous lesions, given their nonfunctional p53 status. The dose–response of these interactions provides a basic mechanism in terms of endogenous metabolite p53-mediated cytotoxicity and chemoprevention, whereby our criteria for chemoprevention are selective cytotoxic effects toward nonfunctional p53 cell lines.
Materials and Methods
Subculture
HCT116 p53 wt, HT29, and HCT116 p53 null cell lines were cultured in T75 flasks (Falcon) containing RPMI 1640 medium (Gibco), Fetal Bovine Serum (Gibco), 1000 mM Penicillin-streptomycin solution (Gibco), and 2 mML -glutamine (Gibco). Cells were maintained in an incubator at 37°C with 95% air and 5% CO2. Subculture was routinely performed when cells were 80% to 100% confluent using a solution of 0.25% Trypsin (Gibco), Dulbecco's Phosphate-Buffered Saline (Gibco), and 1 mM EDTA (Versene; Gibco) at 37°C.
Cell Lines
The HCT116 p53 wt cells and HCT116 p53 null cells are p53 isogenic cell lines of an adherent epithelial human colorectal carcinoma cell line. The HCT116 p53 wt cell line is positive for p53 wt expression, whereas the HCT116 p53 null cell line lacks p53 expression. The HT29 cells are an adherent epithelial human colorectal adenocarcinoma cell line that possesses G → A substitution in codon 273 of the p53 gene that results in the conversion of Arg → His in the protein product; therefore, the cell line expresses aberrant non-wt expression of the p53 transcription factor.
Compounds
Phenyl acetate, ursodeoxycholate, and tauroursodeoxycholate are ambiphilic compounds and were dissolved in ethanol. Stock containers of phenyl acetate (>99.9% purity), ursodeoxycholate (>99.9% purity), and tauroursodeoxycholate (>99.9% purity) were purchased from Millipore-Sigma. Working concentrations of ursodeoxycholate were made in a ratio of 10 mg/mL of 100% ethanol, tauroursodeoxycholate in a ratio of 10 mg/mL of 100% ethanol, and phenyl acetate was made in a 10:1 ratio of 100% ethanol.
Clonogenic Assay
Clonogenic technique by Puck and Marcus 10 was used for cell survival analysis. Briefly, compounds were generated per the dose optimization section and administered into T25 flasks (Falcon). Cells were detached from stock T75 flasks (Falcon) and resuspended in medium to generate a single-cell suspension. Sample aliquot of the cell suspension was counted with the Z2 Cell Counter (Beckman Coulter) to generate values of viable cells. Following administration of compounds into flasks containing varying concentrations of each compound, cells were plated into each T25 flask (Falcon). Cell cultures were incubated for their respective clonogenic period, approximately 9 days for HCT116 p53 wt and HCT116 p53 null containing flasks and 11 days for HT29 cells. Cells were stained following their clonogenic period of incubation with 25% carbol fuchsin in water, where macroscopic colonies equal to and more than 50 cells satisfy the criteria of reproductive cell survival. A total of 3 independent experiments were conducted with 3 replicates per experiment (n = 3).
Dose Function Analysis
Exposure of cells to growth inhibitory compounds comprises 2 characteristic values in a dose–response curve, the non minimal inhibitory concentration (NIC) and the minimal inhibitory concentration (MIC). The NIC value refers to the minimal dose at which the compound begins to inhibit cell growth, whereas the MIC refers to the minimal dose that exerts maximal growth inhibition.
In this study, cytotoxicity curves and corresponding NIC and MIC values were constructed using data from the clonogenic assay cell survival criteria. The inhibitory concentration for each compound was determined using the statistical software analysis package GraphPad Prism 7. The NIC and MIC software interpolated values were determined utilizing a Gompertz function dose–response curve based on the Lambert and Pearson method of determining antibiotic susceptibility in bacterial strains. 11 The function assigns NIC and MIC values corresponding to intersections of the slope of the inflection point with the upper and lower asymptote, respectively. The 3-parameter Gompertz function is a type of sigmoidal logistic growth and decay function that describes cell survival by the equation f (x) = a × exp[−b × exp(−c × x)]. Values of a < 0, b > 0, and c > 0 are representative of decreases in cell survival and therefore the characteristic cytotoxicity curve that describes situations of inhibitory growth applicable to administration of antitumorigenic compounds to cancerous cells.
Statistical Analysis
The One-way analysis of variance (ANOVA) between groups with follow-up Tukey multiple comparisons test was conducted using the statistical software package GraphPad Prism 7 to examine the effects of endogenous metabolite exposure on varying p53 function between each cell line. The NIC and MIC values define a measured and computed value that characterizes each curve in terms of the biological effect end point. The input of each test therefore consists of the NIC and MIC values of each curve along with their associated standard deviation (SD) and degrees of freedom to assess differences between the groups. The Tukey multiple comparisons test reports multiplicity adjusted P values that pool the SD of each group and therefore report conservative levels of significance. The confidence interval of 95% and multiplicity adjusted P value <.05 was taken to be significant.
Results
Figures 1 to 3 represent the dose cytotoxicity profiles of each endogenous metabolite between p53 variant human colon carcinoma cell lines and graphically describe the derivation of Gompertz NIC and MIC best-fit values. The tabulated results in Table 1 put into perspective the relative cytotoxicity of each compound and p53-mediated effects between cell lines. From Table 1, the phenyl acetate had the lowest NIC and MIC values in each of the cell lines, followed by ursodeoxycholate and tauroursodeoxycholate. The calculated NIC and MIC values for the phenyl acetate were lower for the HCT116 p53 wt than the HT29 and HCT116 p53 null cell lines, whereas treatments of the ursodeoxycholate demonstrated higher NIC and MIC values for the HCT116 p53 wt than the HT29 and HCT116 p53 null cell lines, and treatments of tauroursodeoxycholate demonstrated higher NIC values with lower MIC values in the HCT116 p53 wt than both the HT29 and the HCT116 p53 null cell lines. Table 2 characterizes the steepness of the response via the NIC–MIC ratio value. The HCT116 p53 wt cell line exhibited steep survival on exposure to the ursodeoxycholate and tauroursodeoxycholate in comparison to the HCT116 p53 null cell line, whereas the opposing observation is evident in the phenyl acetate exposure.

Phenyl acetate cytotoxicity data on 3 p53 variant human colon carcinoma cell lines and are representative of triplicate experiments. Values shown on each graph are expressed as the mean survival fraction of 3 independent experiments (n = 3). The solid line corresponds to the best-fit Gompertz function of the data. The dash line represents the slope of the inflection point of the Gompertz function. Intersections of the inflection point with the upper and lower asymptote of the Gompertz function represent the NIC and MIC, respectively. Concentration data are expressed in micrograms per milliliter. MIC indicates minimal inhibitory concentration; NIC, nonminimal inhibitory concentration.

Ursodeoxycholate cytotoxicity data on three p53 variant human colon carcinoma cell lines and are representative of triplicate experiments. Values shown on each graph are expressed as the mean survival fraction of 3 independent experiments (n = 3). The solid line corresponds to the best-fit Gompertz function of the data. The dash line represents the slope of the inflection point of the Gompertz function. Intersections of the inflection point with the upper and lower asymptote of the Gompertz function represent the NIC and MIC, respectively. Concentration data are expressed in micrograms per milliliter. MIC indicates minimal inhibitory concentration; NIC, nonminimal inhibitory concentration.

Tauroursodeoxycholate cytotoxicity data on 3 p53 variant human colon carcinoma cell lines and are representative of triplicate experiments. Values shown on each graph are expressed as the mean survival fraction of 3 independent experiments (n = 3). The solid line corresponds to the best-fit Gompertz function of the data. The dash line represents the slope of the inflection point of the Gompertz function. Intersections of the inflection point with the upper and lower asymptote of the Gompertz function represent the NIC and MIC, respectively. Concentration data are expressed in micrograms per milliliter. MIC indicates minimal inhibitory concentration; NIC, nonminimal inhibitory concentration.
a
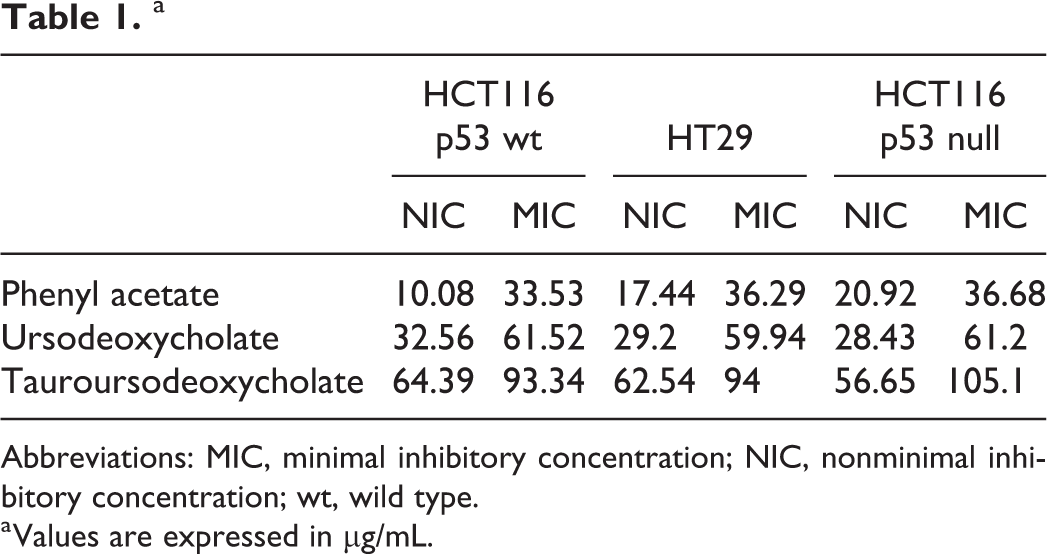
Abbreviations: MIC, minimal inhibitory concentration; NIC, nonminimal inhibitory concentration; wt, wild type.
a Values are expressed in μg/mL.

Abbreviations: MIC, minimal inhibitory concentration; NIC, nonminimal inhibitory concentration; wt, wild type.
Evaluation of the statistical significance in Table 3 of the best-fit values in the phenyl acetate treatments demonstrated that there was high significance in the comparison between the NIC and MIC values of the HCT116 p53 wt versus HT29 and HCT116 p53 wt versus HCT116 p53 null cell lines; however, there was no significance between the NIC and the MIC values of HT29 versus HCT116 p53 null cell lines. Cytotoxicity comparisons in the ursodeoxycholate treatments showed slight significance only between the NIC values of HCT116 p53 wt and HCT116 p53 null cell lines. The tauroursodeoxycholate demonstrated slight significance between both the NIC and the MIC values of HCT116 p53 wt versus HCT116 p53 null and the MIC value of HT29 versus HCT116 p53 null cell lines. Table 3 therefore suggests that there might be a role for p53-mediated effects in cell survival in phenyl acetate exposures, whereas the low significance in the ursodeoxycholate and tauroursodeoxycholate treatments suggests less pronounced intervention of p53-mediated responses. Although the phenyl acetate treatments demonstrate considerable significance in treatment exposures, the NIC and MIC doses of compounds required to achieve growth inhibition are less effective on the HT29 and HCT116 p53 null cell lines in comparison to the HCT116 p53 wt cell line. Therefore, the observations of chemopreventative effects as per the experimental criteria in this study are mostly in line with the tauroursodeoxycholate, as it satisfies selective cytotoxicity toward the p53 mutant HT29 and p53 deficient HCT116 p53 null cell lines.
a

Abbreviations: MIC, minimal inhibitory concentration; NIC, nonminimal inhibitory concentration; wt, wild-type.
a P value chart displays the results of p53-mediated endogenous metabolite interactions and summarizes the 1-way analysis of variance with subsequent Tukey multiple comparisons test. Values of P are multiplicity adjusted P values with 95% confidence interval.
b Level of significance, P < .0001.
c Level of significance, P = .001-.01.
d Not significant.
e Level of significance, P = .01-.05.
f Level of significance, P = .0001-.001.
Discussion
The results demonstrate that there is a p53-mediated role in the induction of growth inhibition and cytotoxicity of phenyl acetate and to a lesser extent the bile acids, ursodeoxycholate and tauroursodeoxycholate, including their respective in vitro metabolites. The p53 response pathway functions on the basis of the detection of cellular DNA damage in a dose-dependent manner. 12,13 Therefore, at low doses to cellular stressors, the p53 arrests the cell in G1 phase to repair the damage, whereas at high doses the cell undergoes apoptosis to the exposure. 14 The inactivation of p53 might impair the ability to promote cellular repair responses and thus contribute to aberrant cell function. 15,16 Chemoprotection strategies therefore require the restoration of p53 capacity with interventional compounds to assist in proper cellular regulation of responses. 17 Given p53-deficient cell lines lack p53 to act as an appropriate target of therapeutic intervention, the compound must also act to target some other aspect of cellular susceptibility in these cell lines. In the case of isogenic p53 variant cell lines, such as the HCT116 p53 wt and HCT116 p53 null, no difference in clonogenicity on exposure to the compound is indicative of p53-independent mediated responses. In cases where clonogenicity between isogenic cell lines is favorable toward p53 null and p53 mutant cells, as is the case of phenyl acetate, the compound might promote cytotoxicity via p53-dependent mechanism such that it triggers apoptosis in p53 wt cells. In the cases where there is significance between the isogenic cell lines in favor of clonogenic survival of p53 wt cells at low doses, as is the case of the compounds ursodeoxycholate and tauroursodeoxycholate, the p53 might inhibit alternative cytotoxic responses. At high doses, it promotes cytotoxicity which explains the significance in favor of p53 null of the tauroursodeoxycholate at high-dose exposures. Therefore, based on these study criteria, the findings support that the tauroursodeoxycholate is chemoprotective to some extent.
In terms of oral compound dosing, the NIC value represents the relevant value with respect to chemoprotection as the MIC value of the nonfunctional p53 cell lines, HT29 and HCT116 p53 null, coincides significantly to that of the HCT116 p53 wt cell line and is thus likely to cause adverse effects in otherwise nonmalignant cells. Therefore, the successful chemopreventive candidate must have practical dose discrepancies between the NIC values of wt and null p53 cell lines to demonstrate in vivo effects. Given the experiment criteria, only the ursodeoxycholate and the tauroursodeoxycholate demonstrate significance between the NIC values of HCT116 p53 wt and HCT116 p53 null cell lines though not between HCT116 p53 wt and HT29 mutant p53 cell lines. In this respect, the tauroursodeoxycholate satisfies this criterion more so than the ursodeoxycholate, as the dose discrepancy between the NIC values of ursodeoxycholate and tauroursodeoxycholate on the HCT116 p53 wt and HCT116 p53 null cell lines are 4.13 µg/mL and 7.74 µg/mL, respectively. Although the cytotoxicity curves of the phenyl acetate also demonstrate significant difference in NIC values between the cell lines, the discrepancy between these values are in favor of the HCT116 p53 null and HT29 cell lines.
Conclusion
The supplementation of endogenous metabolites in vivo might serve as an effective chemopreventative approach to targeting precancerous cells by promotion of cell regulatory mechanisms. This chemoprophylactic strategy is particularly practical given the basic administration via oral consumption of compounds. These compounds represent intermediate metabolites that undergo feedback mechanisms in vivo; therefore, cytotoxic profiling of chronic administration of these compounds is important to confer maximal beneficial effects. In this study, chronic exposures to the compounds—phenyl acetate, ursodeoxycholate, and tauroursodeoxycholate—demonstrated that only the tauroursodeoxycholate had some level of chemopreventative effect. The appeal of this particular compound is the low overall toxicity with high-dose discrepancies between the NIC values that render it suitable to in vivo studies. Therefore, investigation of the pharmacodynamics of the compound warrants study into the molecular interactions of the tauroursodeoxycholate compound with cellular components.
Footnotes
Declaration of Conflicting Interests
The author(s) declared no conflicts of interest with respect to the research, authorship and/or publication of this article.
Funding
The author(s) disclosed receipt of the following financial support for the research, authorship and/or publication of this article: The Canada Research Chairs Program (Recipient: C.E.M., Grant Number: 950-221284), National CFIDS Foundation Inc. (Recipient: C.E.M.), NSERC Collaborative Research and Development Grant (Recipient: C.E.M., Grant Number: RGPIN293153-12), CANDU Owners Group (Recipient: C.B.S., Grant Number: CRDPJ484381-15), and Bruce Power (Recipient: C.E.M.).