
Abstract
Purpose:
To evaluate the impact of 99mTc-labeled diethylene triamine pentaacetate-galactosyl human serum albumin (99mTc-GSA) single-photon emission computed tomography (SPECT) image-guided inverse planning on the dose–function histogram (DFH) parameters for stereotactic body radiation therapy planning in patients with hepatocellular carcinoma (HCC).
Methods:
Eleven patients were enrolled in this study. The functional liver structure (FLS) was derived from SPECT thresholds of 60% to 80% of the maximum pixel value. Two treatment plans optimized without FLS (plan C) and with FLS (plan F) were designed for 50 Gy to the planning target volume (PTV). The DFH parameters were calculated as follows: Fx = (sum of the counts within the liver volume receiving a dose >x Gy/sum of the counts within the whole liver volume) × 100. Other parameters for the PTV included D95, mean dose, conformity index (CI), and homogeneity index (HI).
Results:
Compared with plan C, plan F significantly reduced DFH parameters of F5 to F40 (P < .05). There were no significant differences in the parameters of the PTV of D95, mean dose, CI, and HI and organs at risks (stomach, duodenum, spinal cord, and kidneys) between plans C and F.
Conclusion:
DFH analyses revealed that 99mTc-GSA SPECT image-guided inverse planning provided dosimetric benefits related to sparing of liver function and may reduce hepatic toxicities.
Keywords
Introduction
Stereotactic body radiation therapy (SBRT) for hepatocellular carcinoma (HCC) has been widely performed as an alternative to standard treatments, such as surgical resection and radiofrequency ablation (RFA). 1 The SBRT delivers a highly conformal potent dose of radiation to the tumor in some fractions while minimizing radiation damage to organs at risk (OARs). It provides excellent local control for HCC with a reported control rate of 80% to 90%. 2 –4 However, radiation-induced liver injury (RILI), which occurs in 10% to 20% of patients with HCC undergoing SBRT, remains a problematic adverse effect because of preexisting liver dysfunctions occurring secondary to comorbid conditions, such as hepatitis B and C infection and cirrhosis. 3,4 Because the HCC response to radiation therapy (RT) exhibits a dose–response relationship, 5 a sophisticated RT technique is required to deliver a sufficient RT dose to control the HCC while preventing RILI. Intensity-modulated radiotherapy (IMRT) based on inverse planning using a dose–volume histogram (DVH) is becoming more widely applied for the treatment of HCC. 6 Some planning studies have suggested that the use of IMRT yielded dosimetric benefits for the target volume coverage and sparing of the liver superior to those of 3-dimensional conformal RT. 6 However, because DVH is estimated on the basis of computed tomography (CT) images, which provide only morphological information, inhomogeneity of liver function is not considered in planning. 7
A radiopharmaceutical tracer, 99mTc-labeled diethylene triamine pentaacetate-galactosyl human serum albumin (99mTc-GSA), that binds specifically to the hepatic asialoglycoprotein receptor is used to assess hepatic function. 8 Single-photon emission computed tomography (SPECT) using 99mTc-GSA provides 3-dimensional information about regional liver function, and its findings suggest that regional function of patients with liver tumors is inhomogeneous because of previous treatments, such as RFA and transarterial chemoembolization (TACE). 7 A recent study revealed that a dose–function histogram (DFH) using 99mTc-GSA SPECT provides dosimetric information of the liver function of patients with HCC who underwent SBRT. 7 Introduction of functional information of 99mTc-GSA SPECT for use in inverse planning for IMRT might be a reasonable approach to spare liver function. We evaluated the impact of 99mTc-GSA SPECT image-guided inverse planning on the DFH parameters of SBRT planning in patients with HCC.
Materials and Methods
Patients
This retrospective planning study is the secondary analysis of our previous study 7 and is based on prospectively acquired imaging data in a part of another prospective study of SBRT for HCC. This study received institutional review board approval (No. 1395), and written informed consent for the future use of images in this study was obtained from all patients. Between August 2013 and February 2017, 12 consecutive patients with HCC received SBRT in our institution. Of these 12 patients, 11 were included in this study; 1 patient was excluded because he received SBRT for the recurrent lesion on the surface of the liver after surgery. The patient and tumor characteristics are summarized in Table 1. Eight patients (73%) had undergone previous treatment for lesions other than SBRT-treated lesions in the liver or remnant liver; RFA in 5, percutaneous ethanol injection therapy in 1, and TACE in 6, respectively. No patient received SBRT before treatment. All patients underwent 99mTc-GSA SPECT/CT imaging within 1 month before SBRT planning.
Patient and Tumor Characteristics.

Abbreviations: GTV, gross tumor volume; HBV, hepatitis B virus; HCV, hepatitis C virus; PTV, planning target volume; UICC, Union for International Cancer Control.
Fusion of the SPECT/CT and Planning Simulation CT Images
The details of generating fused SPECT/CT images and planning simulation CT are described elsewhere. 7,9 We used a SPECT/CT system (Symbia T16; Siemens Healthcare, Erlangen, Germany) for the SPECT/CT imaging. Hepatic SPECT data (60 steps of 15 seconds per step, 360°, 128 × 128 matrix) were obtained over 20 to 35 minutes after the intravenous injection of 99mTc-GSA (185 MBq). To enable SPECT attenuation correction, noncontrast-enhanced helical CT images (matrix, 512 × 512 pixels; slice thickness, 2 mm; and slice interval, 2 mm) were obtained. After registration between SPECT and CT images, a CT-derived attenuation-coefficient map was created. For SPECT reconstruction, the ordered-subset expectation maximization algorithm (Flash 3D; Siemens Healthcare) was applied.
For the planning simulation CT acquisition, we used a LightSpeed real-time (RT) CT scanner (GE Medical Systems, Waukesha, Wisconsin). Patients lay supine, and abdominal compression was applied. Immediately after a dynamic contrast-enhanced scan, a nonhelical slow-speed scan with a gantry rotation time of 4 seconds, slice thickness of 2.5 mm, and slice interval of 2.5 mm was performed under free breathing.
Attenuation-corrected SPECT and CT images and planning CT images were transferred to a Velocity AI (version 3.0.2; Varian Medical Systems, Palo Alto, California). After registration between the SPECT and CT images by hardware arrangement, we registered the SPECT/CT images onto the planning CT images: a rigid image registration followed by a nonrigid deformable registration. During this process, each SPECT voxel was mapped to a new position based on the transformations used in the CT–CT registration, resulting in new SPECT/CT fused images that were deformably registered with the planning CT images (planning SPECT/CT images).
Construction of the Functional Liver Structure
The functional liver structure (FLS) as an avoidance structure for optimization in inverse planning was derived from SPECT thresholds of the 60% to 80% of maximum pixel value. 10 The threshold level was preferred to create a gap of the FLS around the target volumes (Figure 1).
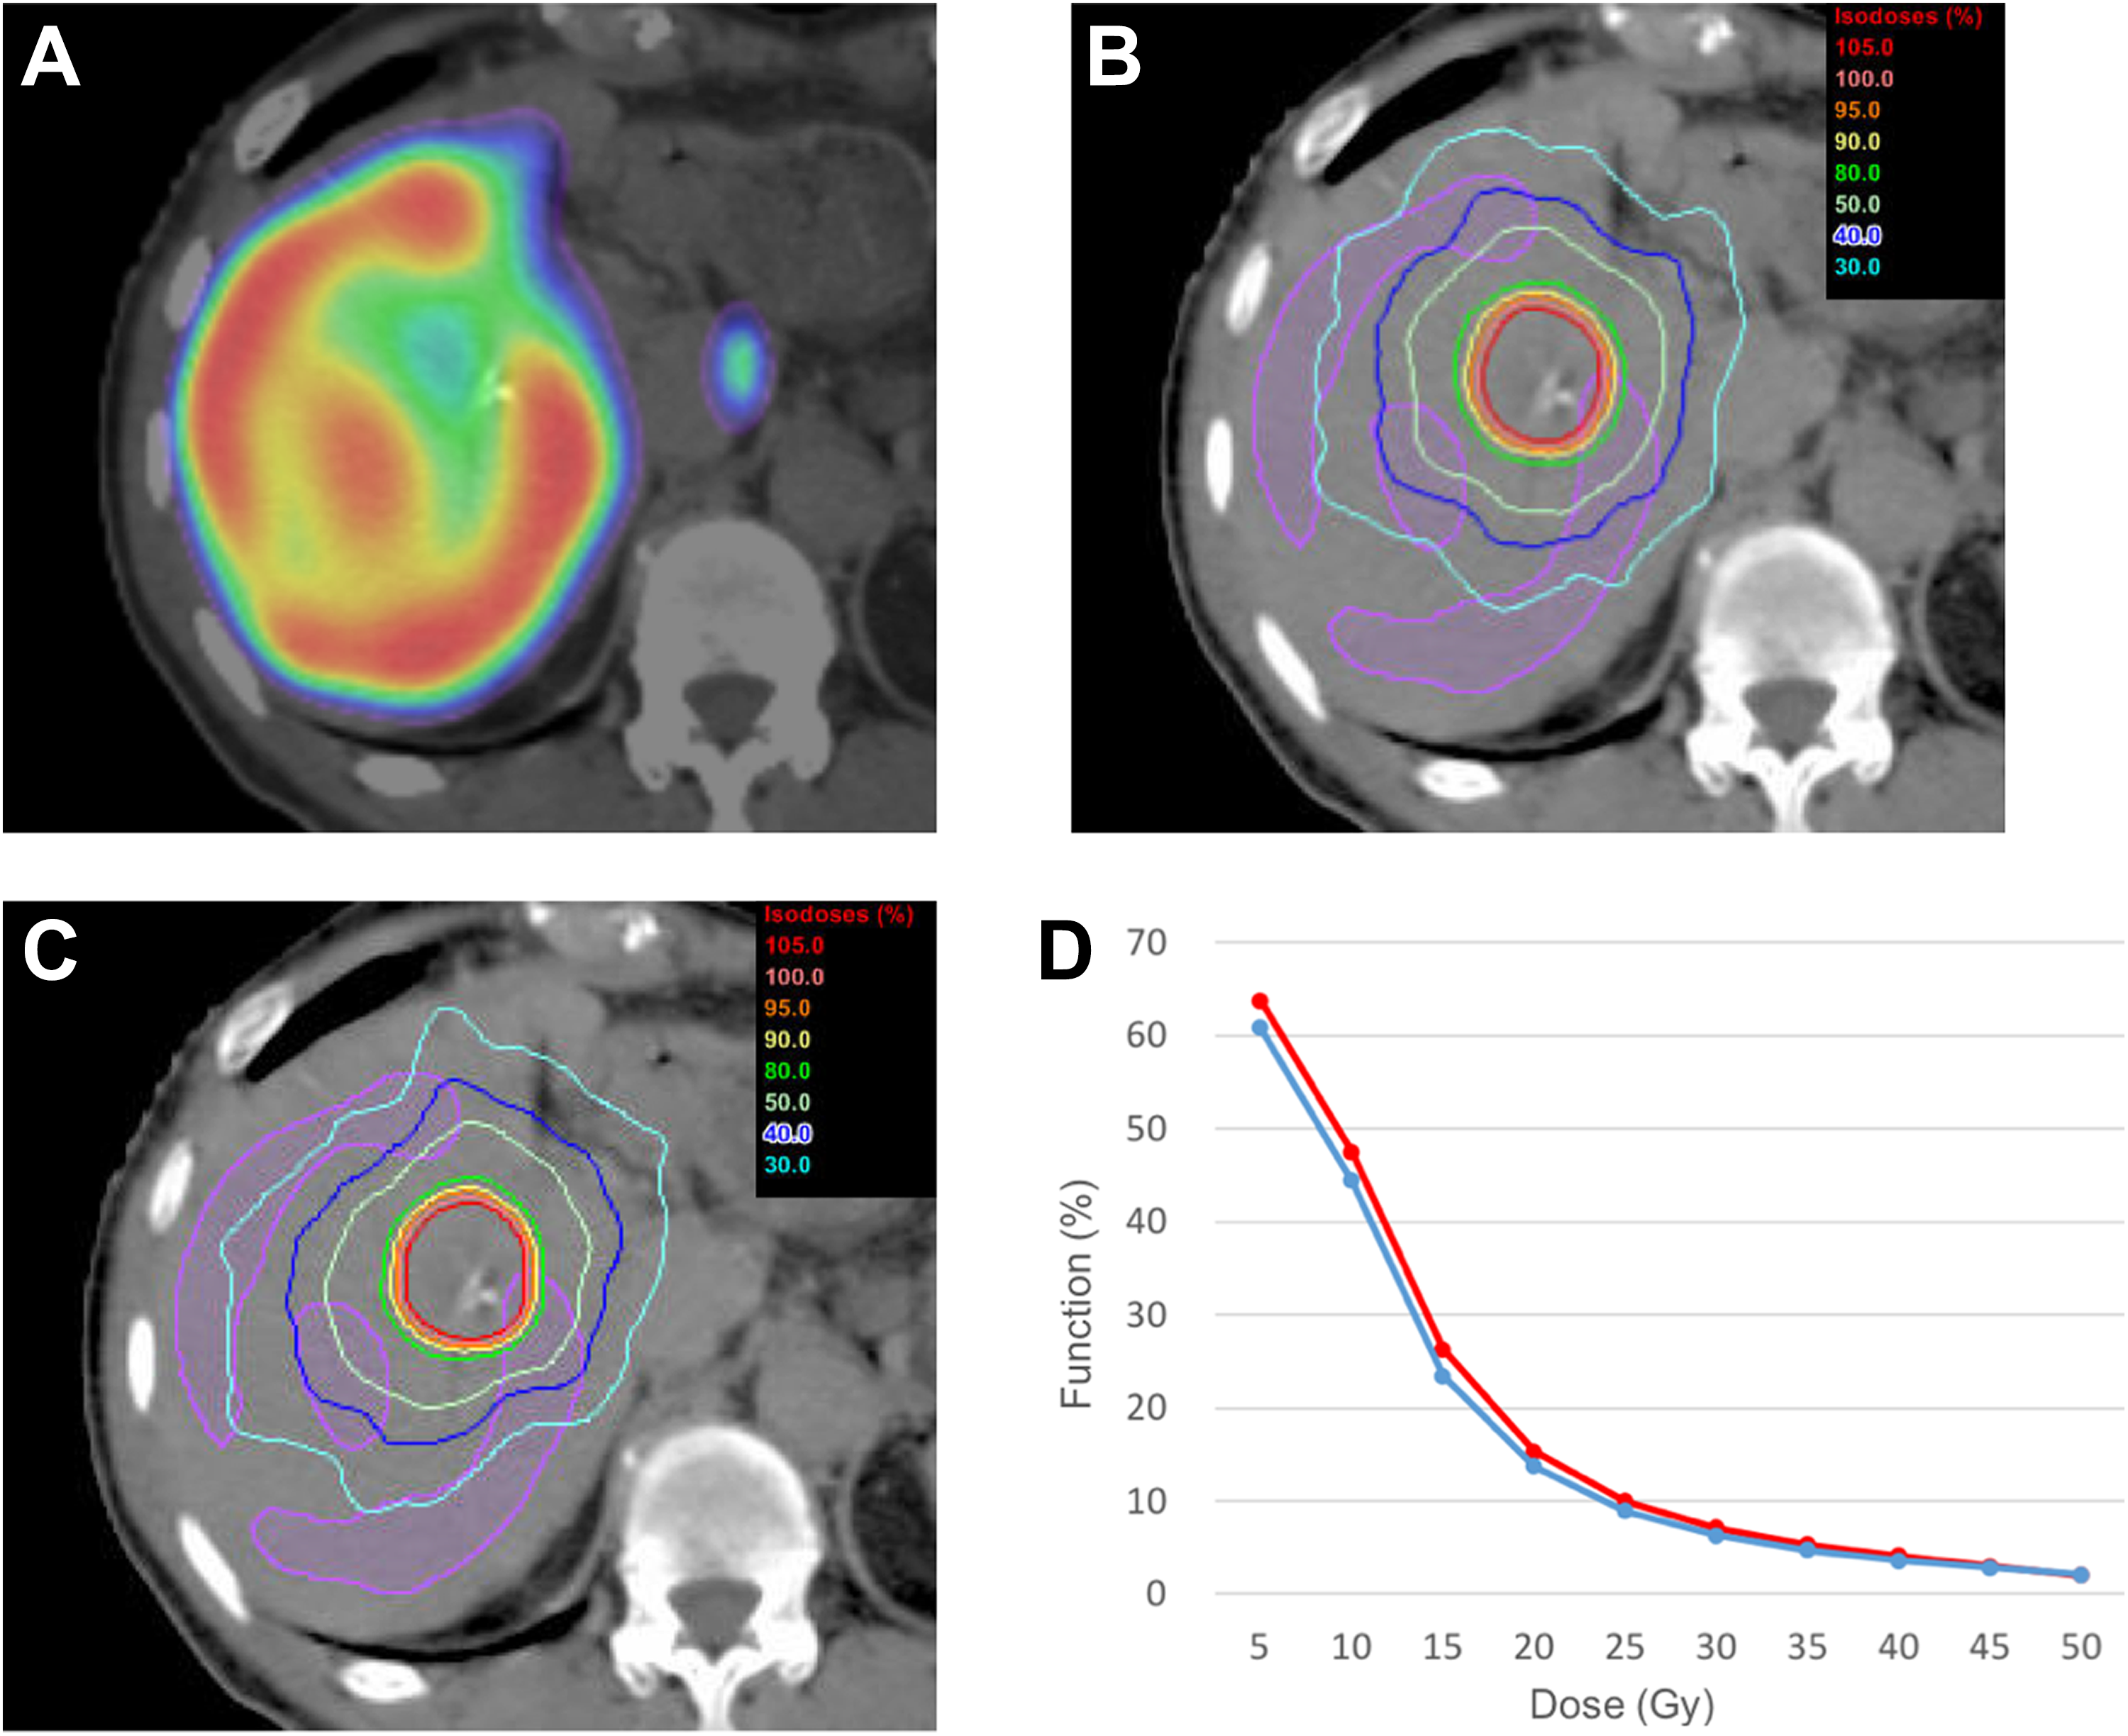
Patient with recurrent hepatocellular carcinoma in segment 5. He received multiple surgical treatments, transarterial chemoembolization, and radiofrequency ablation. A, Fused images from single-photon emission computed tomography (SPECT) and planning computed tomography. The SPECT image shows the inhomogeneity of the liver function. B, Dose distributions of the conventional plan (plan C) optimized without functional liver structure (FLS). C, Dose distributions of the functional image-guided plan (plan F) optimized with FLS. The FLS (purple) was derived from SPECT thresholds equal to 80% of the maximum pixel value. D, The dose–function histogram of plan C (red) and plan F (blue).
Treatment Planning
Planning CT images and the FLS were transferred to the Eclipse RT planning system (version 10.0; Varian Medical Systems). The structures of the target and OARs were delineated on the basis of the planning CT images.
We defined the gross tumor volume (GTV) as the primary tumor evident on contrast-enhanced CT and/or magnetic resonance (MR) images. The clinical target volume margin of 0 to 5 mm was added to the GTV for subclinical invasion. The planning target volume (PTV) margins of 10 mm for the superior–inferior and 5 mm for the left–right and anterior–posterior directions were added to cover the respiratory motions and setup errors. 9,11 The SBRT plans were designed to use RapidArc with 6 MV photons generated by a linear accelerator (Clinac iX; Varian Medical Systems). The plan was generated by using 2 arcs rotating from 181° to 179° clockwise and from 179° to 181° anticlockwise with the dose rate varied between 0 and 600 MU/min. The total prescribed dose was 50 Gy in 5 fractions. We created 2 RT plans: a plan optimized without FLS (conventional plan: plan C) and a plan optimized with FLS (functional image-guided plan: plan F). The dose constraints for optimization of the target volumes and OARs are shown in Table 2. As there were no established dose constraints for the structures, we simplified and modified the previous planning study based on the FLS defined by MR imaging using gadolinium–ethoxybenzyl–diethylenetriamine pentaacetic acid (Gd-EOB-DTPA). 11 Vx means the percentage of the structure volume receiving >x Gy.
Dose Constraints for the Conventional and Functional Image-Guided Inverse Plans.
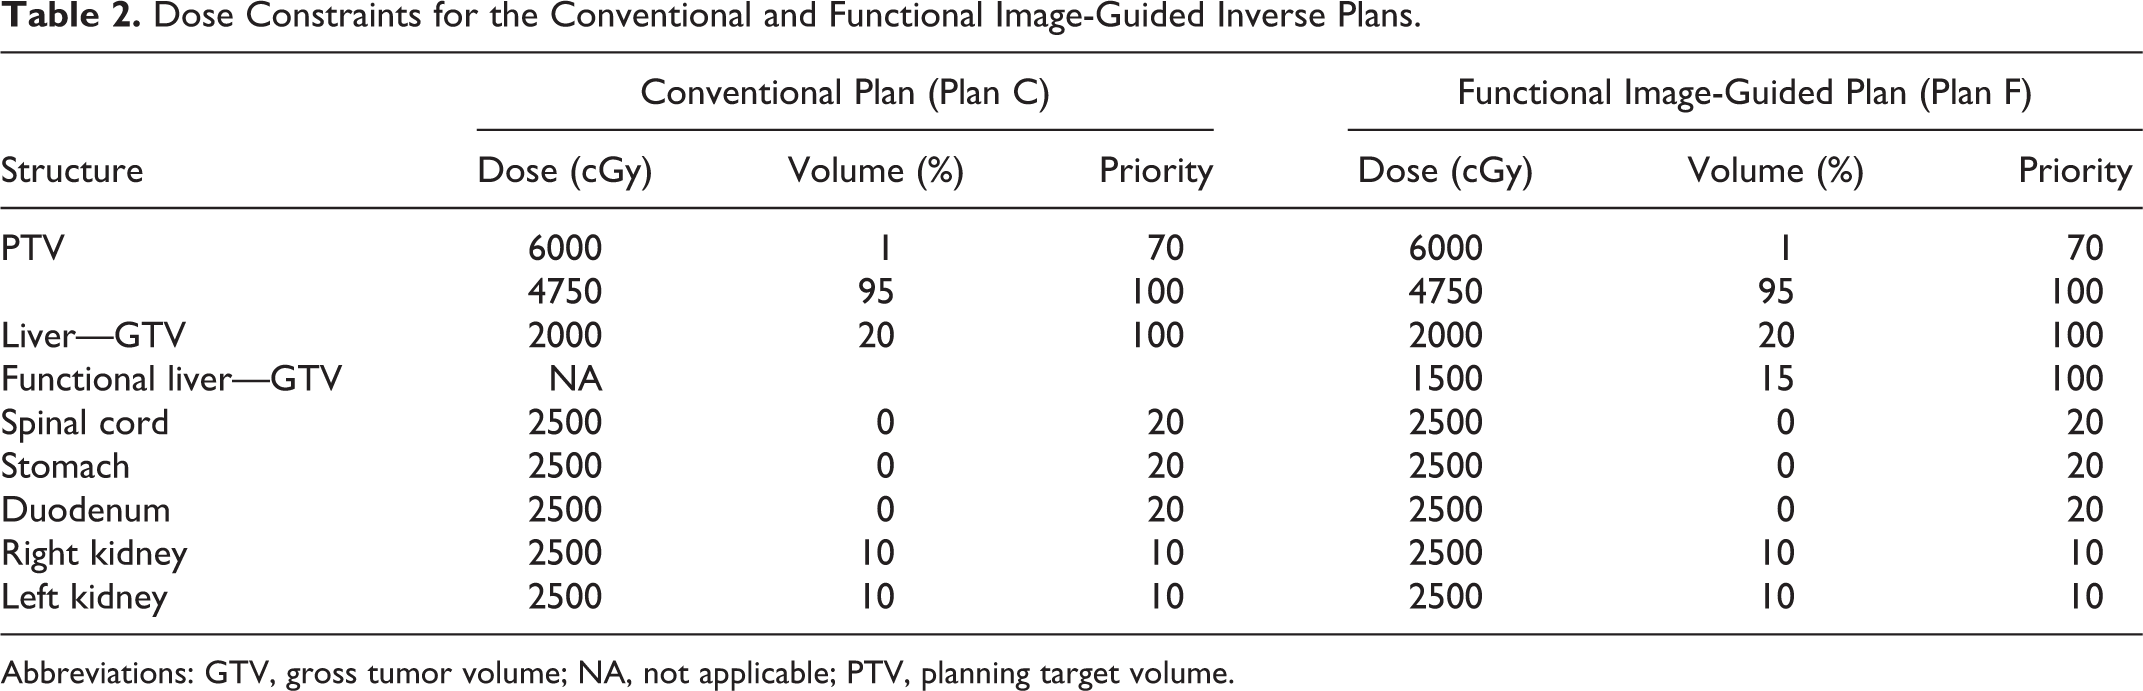
Abbreviations: GTV, gross tumor volume; NA, not applicable; PTV, planning target volume.
Calculating the Parameters of DFH
Planning CT images, delineated structures, and dose distributions were transferred to Velocity AI. After registration between the planning CT images and planning SPECT/CT images by hardware arrangement, we incorporated delineated structures and dose distributions into the planning SPECT/CT images. Structures of the irradiated volumes of the liver parenchyma were generated at 5 Gy dose increments on the basis of the dose distribution information.
DFH parameters for 5 to 50 Gy were calculated as follows 7 :

Data Analysis
The parameters of the DVH of plans C and F were calculated in terms of dose constraints for optimization. DVH parameters of the V 5 to V 50 and mean dose for the normal liver (liver − GTV) were also calculated. For the PTV, the absorbed dose received by 95% and 98% of the PTV (D 95 and D 98), mean dose, conformity index (CI), and homogeneity index (HI) were used to evaluate the PTV. 12 The CI was calculated as follows:

where V Tref is the volume of the target covered by the reference isodose (100%, 98%, and 95% of the prescribed dose), V T is the target volume, and V ref is the volume of the reference isodose.
The HI was calculated as follows:

where Dx % was the absorbed dose received by x% of the PTV. For the evaluation of OARs, the maximum dose, mean dose, and/or Vx were employed. The monitor units (MUs) for the 2 plans were also recorded.
The differences in the parameters between the 2 plans were evaluated by using the paired t test. Differences with P values of <.05 were considered to be statistically significant. Statistical calculations were performed by using SPSS software, version 24.0 (IBM, Armonk, New York).
Results
The dosimetric parameters are shown in Table 3. In comparison with plan C, plan F significantly reduced the DFH parameters of F 5 to F 40, and plan F did not significantly increase F 45 and F 50. There were no significant differences in the DVH parameters of D 95, D 98, mean dose, CI95, CI98, CI100, and HI for the PTV between plans C and F. Plan F significantly reduced V 5, V 10, V 15, V 20, V 25, V 30, V 40, and the mean dose of the normal liver, and plan F did not significantly increase V 35, V 45, and V 50. There were no significant differences in the parameters of the OARs of the stomach, duodenum, spinal cord, and kidneys between plans C and F. No patient received ≥25 Gy to their kidneys. There was no significant difference in the MUs between plans C and F. Figure 1 shows a representative case with parametric discrepancies between plans C and F because of previous treatment.
Dosimetric Parameters Between Conventional and Functional Image-Guided Plans.
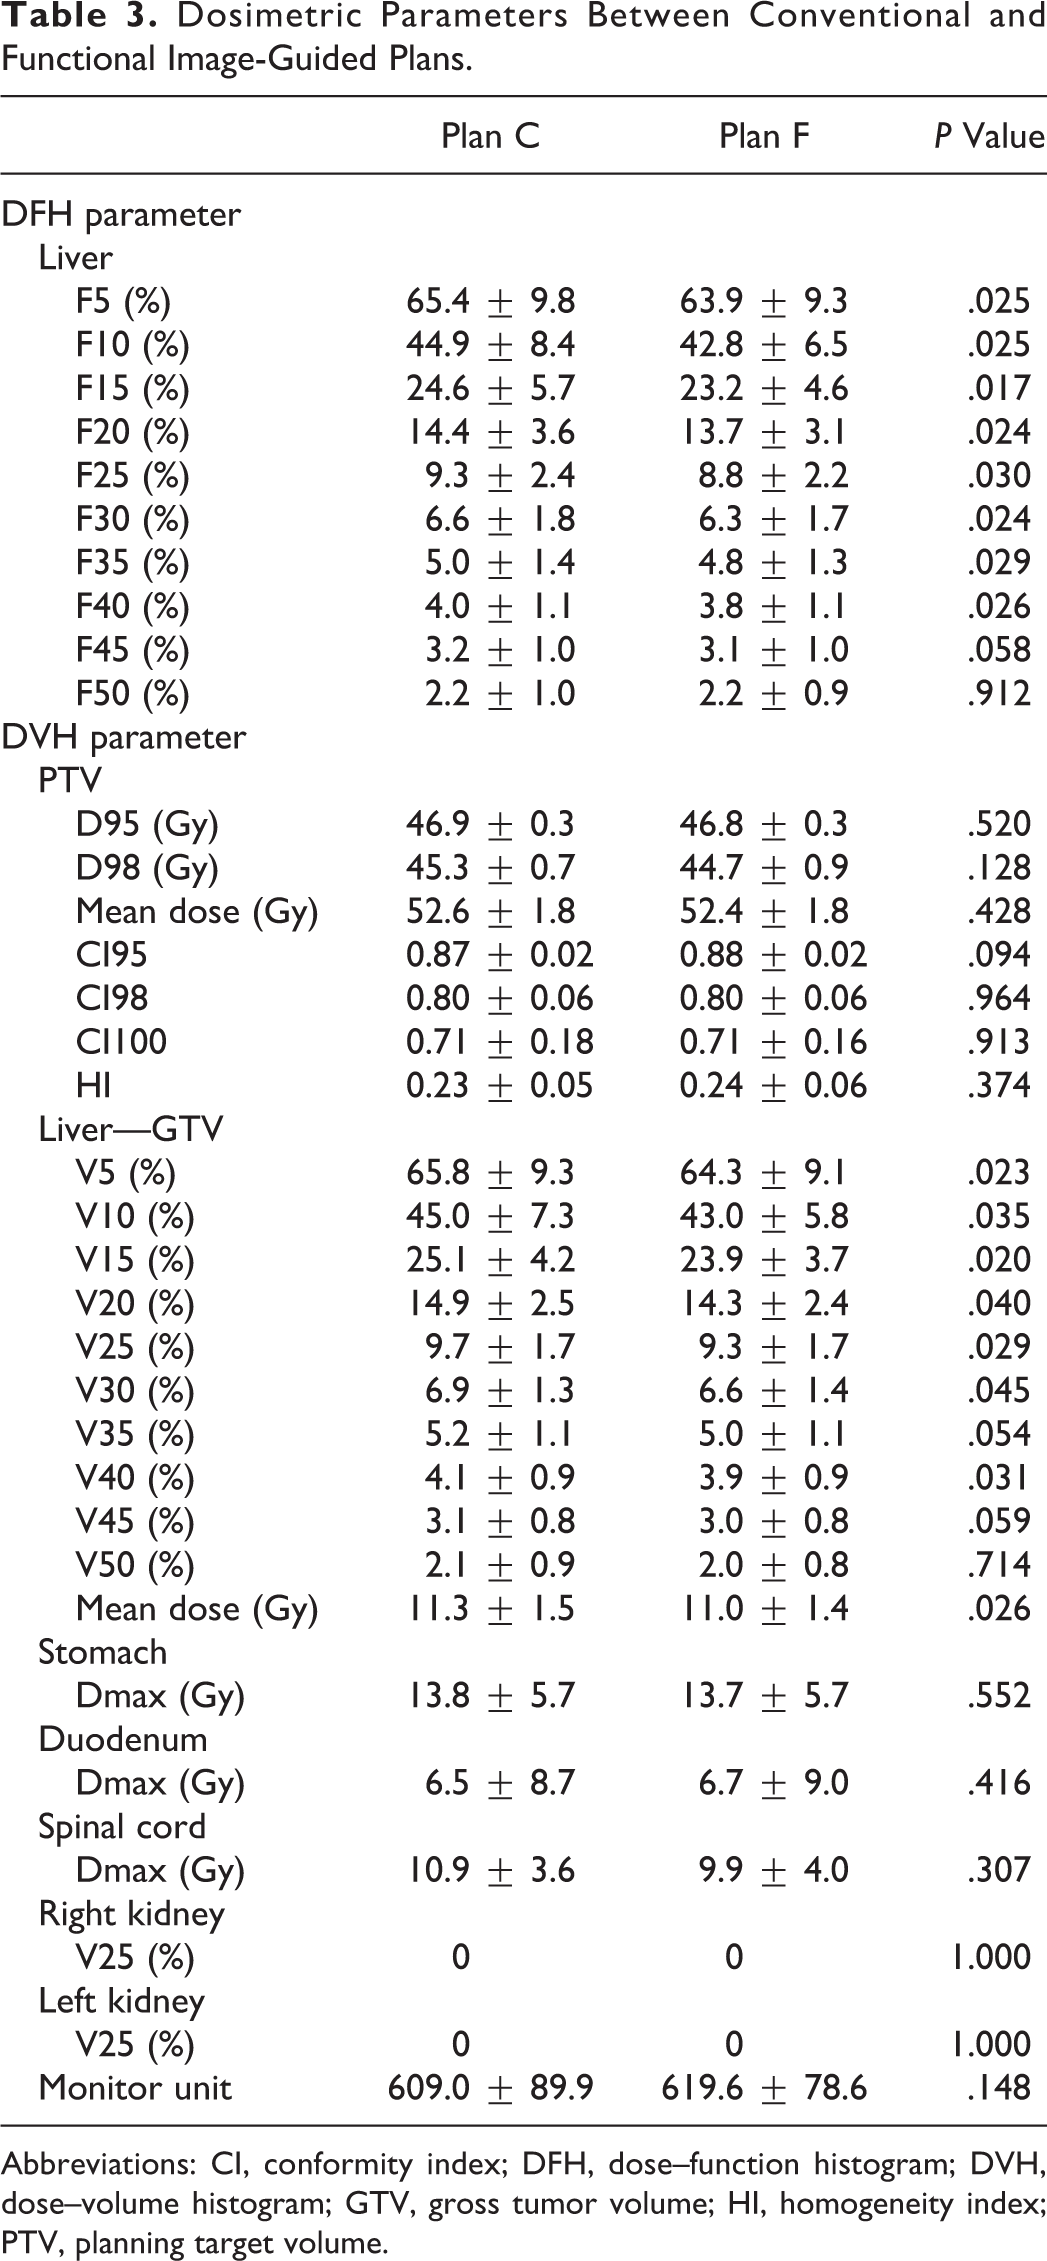
Abbreviations: CI, conformity index; DFH, dose–function histogram; DVH, dose–volume histogram; GTV, gross tumor volume; HI, homogeneity index; PTV, planning target volume.
Discussion
Previous reports of the dosimetric benefit of the use of SPECT images in inverse planning have been focused on treatment using radiopharmaceutical tracers, such as 99mTc-labeled macroaggregated albumin 13 and 99mTc-labeled diethylene triamine pentaacetate, 14 of patients with lung cancer. Our study revealed that 99mTc-GSA SPECT image-guided inverse planning provided a dosimetric benefit of sparing liver function while maintaining coverage of the PTV in patients with HCC. Furthermore, our treatment technique did not increase the DVH parameters of the OARs. Our treatment technique provides a great value especially in cases where the regional function of patients is inhomogeneous due to the previous treatments. 7
Previous studies have suggested that hepatobiliary phase images acquired by MR imaging using Gd-EOB-DTPA, which is absorbed by hepatocytes, enables evaluation of the functional liver. 15,16 Tsegmed et al 11 performed a planning study using hepatobiliary phase images and inverse planning technique. They defined the FLS as an area of the liver–spleen with a contrast ratio ≥1.5 and analyzed DVH parameters of the FLS. They found that the inverse planning technique achieved a reduced radiotherapeutic dose to the FLS. However, because the definition of the FLS was based on the threshold segmentation technique, which is similar to that for the FLS in our study, inhomogeneity of the function may exist within the FLS, and some function may exist in some part of the whole liver other than the defined FLS. The advantage of the DFH for evaluation of irradiated liver function is that inhomogeneity of liver function within the whole liver is fully considered in the calculation because the DFH calculation is based on the sum of the counts within the whole liver. 7 Our study based on this precise evaluation method of the DFH analysis also revealed that functional image-guided inverse planning reduced the RT dose to the liver function. In the future, technical development of RT planning systems may yield further dosimetric benefits by inverse planning based on dose constraints for not only DVH but also DFH parameters for SBRT planning in the treatment of HCC.
There were some limitations in our study. First, this was only a planning study based on a relatively small number of patients, and we were unable to comment on the optimal SPECT thresholds for yielding FLS or dose constraints for optimization. Second, the accuracy of the deformable registration between the planning CT and SPECT images was not evaluated. Misregistration between these images may have influenced the results of our study. Further prospective clinical trials based on a large patient population and SPECT/CT planning simulation are required to evaluate the clinical benefits of our techniques.
In conclusion, our DFH analyses revealed that 99mTc-GSA SPECT image-guided inverse planning provided a dosimetric benefit for sparing liver function and may reduce hepatic toxicities.
Footnotes
Declaration of Conflicting Interests
The author(s) declared no potential conflicts of interest with respect to the research, authorship, and/or publication of this article.
Funding
The author(s) disclosed receipt of the following financial support for the research, authorship, and/or publication of this article: This work was supported by JSPS KAKENHI grant number 26861004.