
Abstract
The study aimed to develop a novel dose conversion platform by improving linear-quadratic (LQ) model to more accurately describe radiation response for high fraction/acute doses. This article modified the LQ model via piecewise fitting the biological dose curve using different fractionated dose and optimizing the consistency between mathematical model and experimental data to gain a more reasonable transform. That mathematical development of the LQ model further amended certain deviations of various cell curves with high doses and implied the rationality of the present model at low dose range. The modified biologically effective dose model that solved the dilemma of inaccurate LQ model had been used in comparing between hypofractionated and conventional fractioned dose. It has been verified that the calculated values are similar in the treatment of same efficacy, no matter what α/β is, and provided a more rational explanation for significant differences among various hypofractionations. The equivalent uniform dose based on the subsection function could represent arbitrary inhomogeneous dose distributions including high-dose fractions, providing a foundation for the implementation of detailed evaluation of different cell dose effects.
Keywords
Introduction
The exploration of ideal dose delivery pattern has greatly evolved due to the improvement of stereotactic conformal radiotherapy technique. Stereotactic body radiation therapy (SBRT) or stereotactic radiosurgery (SRS) irradiates both small and/or large complex-shaped lesions while minimizing the dose to adjacent radiosensitive tissues. 1 Large doses per fraction has been used in ongoing clinical trials designed to explore the use of that pattern for different tumor sites 2 ; however, the radiosensitivity of different time-dose fraction schemes should be estimated accurately due to the deviation of radiobiological assessment.
The biologically effective dose (BED) based on linear-quadratic (LQ) model has been widely used to calculate tissue effective of various dose fractions since it was formulated by Douglas and Fowler. 3 The fractioned dose and the gradient of biological effective determined the relative effectiveness in the formula, which shows the ratio of the initial slope and the slope at high dose range. The assumption has been proved biologically by Barendsen GW. 4
Some studies indicated that caution should be exercised in applying and interpreting results when using the LQ model with high doses per fraction. Alternate mechanisms in addition to DNA strand breaks and/or chromosome aberrations may involve in response of tumors to SBRT or SRS. 5 -9 Autophagy, characterized with the prominent formation of autophagic vacuoles in the cytoplasm, is a novel response of cancer cells, remaining largely elusive. 9 Vascular damage may play an important role in the response of human tumors to high-dose hypofractionated irradiation, damaging the intratumor microenvironment and leading to indirect tumor cell death. 5,8 The biological radiation effect cannot be theorized precisely in total dose range, as little effect of quantization is known about such mechanisms as radiation clonogenic capacity in the target.
The LQ model has been widely used in modeling the effect of total dose and dose per fraction in conventionally fractionated radiotherapy for decades. The LQ model solely depends on the expected incidence of direct interactions of radiation with specific cellular targets. 8 The model generated by much of the data obtained in vitro has well-documented predictive properties for fractionation/dose-rate effects in the laboratory. 10 Recent experimental studies have verified the inadequacy of the LQ model in converting hypofractionated doses into single doses and as a result may overestimate the effect of high fractional doses of radiation. 11 No biological interpretation of the LQ parameters was proposed to explain together the radiation response in a wide dose range. 12
The validity of the LQ model for calculating isoeffect doses in radiation therapy has been intensively debated. 8 Because sublethal damage repair takes place, the LQ survival curve continuously bends downward with increasing radiation dose. 13 Some study improved the goodness of fit by removing the low dose data and high dose points. 14 Another showed that higher order terms may be present to respond the heterogeneity of irradiated cell population while there is a bias in estimating values of α and β. 15
There is no clear consensus on how to prescribe and report doses with SBRT, especially with a heterogeneous dose distribution, which makes it difficult to compare different studies. 16 It has been proposed that mechanism-based models could be more appropriate for large fraction/acute doses. Meanwhile, the models, such as the LQ model, are well characterized with clinical data in low-dose range and generally easy to use. The purpose of this work is to modify the LQ model and BED function via fitting the biological-dose curve with piecewise functions, which gives us more accurate description of radiation response with high fraction/acute doses. The model uses the well-known characterized α and β parameters, remaining the simplicity of the LQ model in low dose range and well fits curves with a new parameter introduced at large fraction doses. The accuracy of BED should be testified as the calculated values are supposed to be similar in the dose-fractionations with same curative effect.
Furthermore, an improved equivalent uniform dose (EUD) model is designed to correct the dose heterogeneity distribution in the target by using the principle of equal average survival rate. This helps us find a reasonable approach for treatment effect conversion between high dose fractionated radiation therapy and the conventional fractionated radiation therapy.
Material and Methods
The Extension of the Linear–quadratic Model at High-Dose Range
The equation about cell biological radiation effects (E) and single irradiation dose (d) can be derived using Taylor’s expansion.

A quadratic function got by developing the Taylor equation, using a logarithmic of survival rates for E.

The traditional LQ function is obtained when d 0 is zero.

If d = d 0, the derivations of both formula are equal, then


The formula of cell curve can be written as a piecewise function

Grouping constants and terms linear and quadratic in the variable, one gets:

Compare the Goodness of Fit for Cell Survival Curve With Different Models
ln (SF) was expanded in Taylor series, taken to the cubic term and obtained the form of Equation 8.

Methods in vitro cultured 800 human fibroblasts, A375, A549, were inoculated in 10-cm dishes, respectively. The clonogenic assay was carried out by using A375 melanoma cells, A549 human non-small cell lung cancer (NSCLC) cells, and hFB human skin fibroblasts, respectively. Briefly, cells were harvested and 800 cells per dish were reseeded in a 100-mm dish. The cells were treated with radiation at different doses from 0 Gy to 11 Gy at 12 hours after reseeding. Following 10 to 14 days of incubation, cells were fixed and stained with crystal violet, and colonies containing at least 50 cells were scored. The linear accelerator irradiation parameters were 6 MV X ray, and 180 degree irradiation. The 2 cm equivalent solid water module was placed below.
The survival curves of the 3 cells were fitted by the Equations 3, 6, 8, respectively.
Coefficient of determination, R-square, was used for the measures of goodness of fit.

Where n is the number of samples, y
i is the estimated value,
Root mean squared error (RMSE) was employed to evaluate the precision and robust of different model systems.
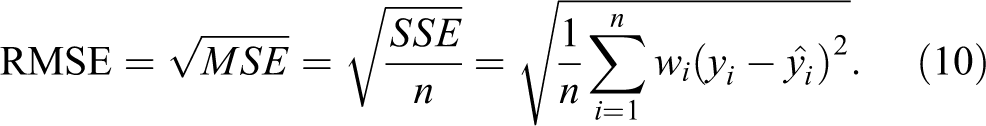
Where n is the number of samples, w
i is data weight, y
i is the estimated value, and
We compared the imitative effect of models, including another LQ model, whose α and β were confirmed experimentally at a low dose range.
Chi-Square Test of Mathematical Models
The deviations of survival curves from the optimal models’ predictions and the stability of models were determined by using χ2 test.
χ2/df performed a χ2 goodness-of-fit test that the data were a random sample from a normal distribution with mean and variance estimated with per degree of freedom. The P value was the probability of observing the given result, or one more extreme, by chance if the null hypothesis was true.
Biologically Effective Dose Based on the Modified LQ Model
The BED formula introduced by Fowler

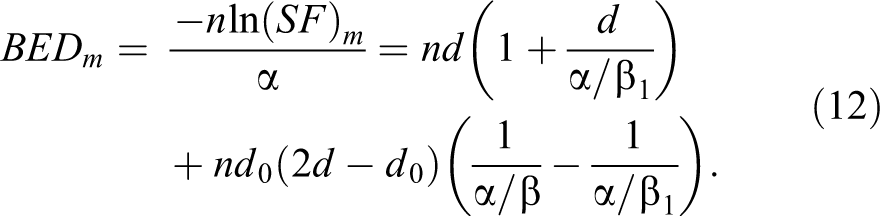
The improved BED formula at high dose range based on the modified LQ model (Equation 7)
Biologically Effective Dose Comparison of Various Dose-Fractionations
Chang et al compared the curative effect between hypofraction and conventional fractionation for the treatment of melanoma. 17 The study showed the hypofractionation (6 Gy×5 Fx) and the conventional fractionation (2 Gy×30 Fx) are equally efficacious in 5-year in-field local regional control, 5-year freedom from distant metastases, 5-year cause-specific, and overall survival (OS).
The randomized clinical trial of SPACE showed there were no statistically significant differences between SBRT (22 Gy×3 Fx) and conventional fractioned radiotherapy (CFRT) (2 Gy×35 Fx). 16
The BED values of 4 dose fractionations above were calculated by Equation 11 with the α/β fitted in Equation 3 at low dose range, and Equation 12 with the α/β and α/β1 best fitted in Equation 6, respectively.
Haque et al investigated more dose fractionations of SBRT and CFRT, which demonstrated the survival benefit to hypofraction. 18 The BED computed by Equation 12 with the α/β and α/β1 best fitted in Equation 6, showed the differences of various treatments.
Stephans et al detailed and analyzed tumor control for common SBRT dose fractionation regimens in stage I NSCLC, of which BED would be recalculated by Equation 12 to explore the relationship between dose fractionation and local control (LC). 19
Equivalent Uniform Dose Based on the Modified LQ Model
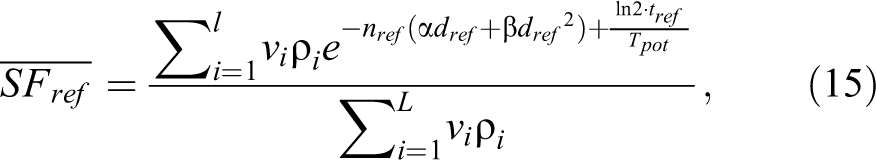
The OS fraction is the weighted average of the survival fractions taken over all near homogeneously irradiated subvolumes of the target, where colognes are uniformly distributed across the volumes.
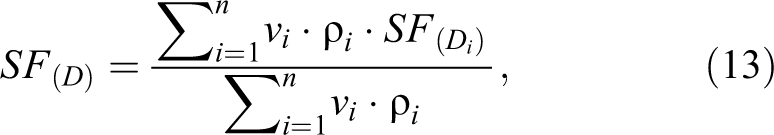
where v i and ρ i are the local absolute volumes corresponding to dose D i and densities of colognes, respectively.
Assuming a constant rate of proliferation, it can be shown that the overall surviving fraction for per fraction dose d given in n fractions is

Here t is the overall treatment time after the start of proliferation, and T pot is the potential doubling time of colognes.
The average of the survival fractions can be rewritten as a complex form.
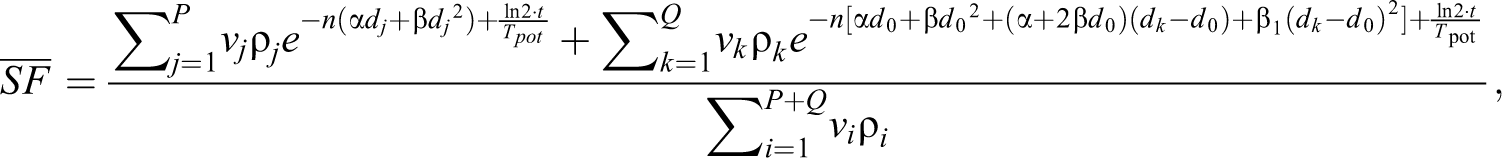
where d j < d 0; d k > d 0;
where n ref· d ref = D ref;
If the target is irradiated uniformly to a reference dose, the cells survive fraction is equal to the actual, the following equivalency is postulated:

An improved EUD can be obtained by the following formula:

Results
Table 1 showed the colony formation efficiency of hFB, A375, and A549 at different doses, respectively. Tables 2, 3, and 4, showed the fitting results of above 3 cells survival curves with different functions.
The Colony Formation Efficiency of hFB, A375, A549 at Different Dose.
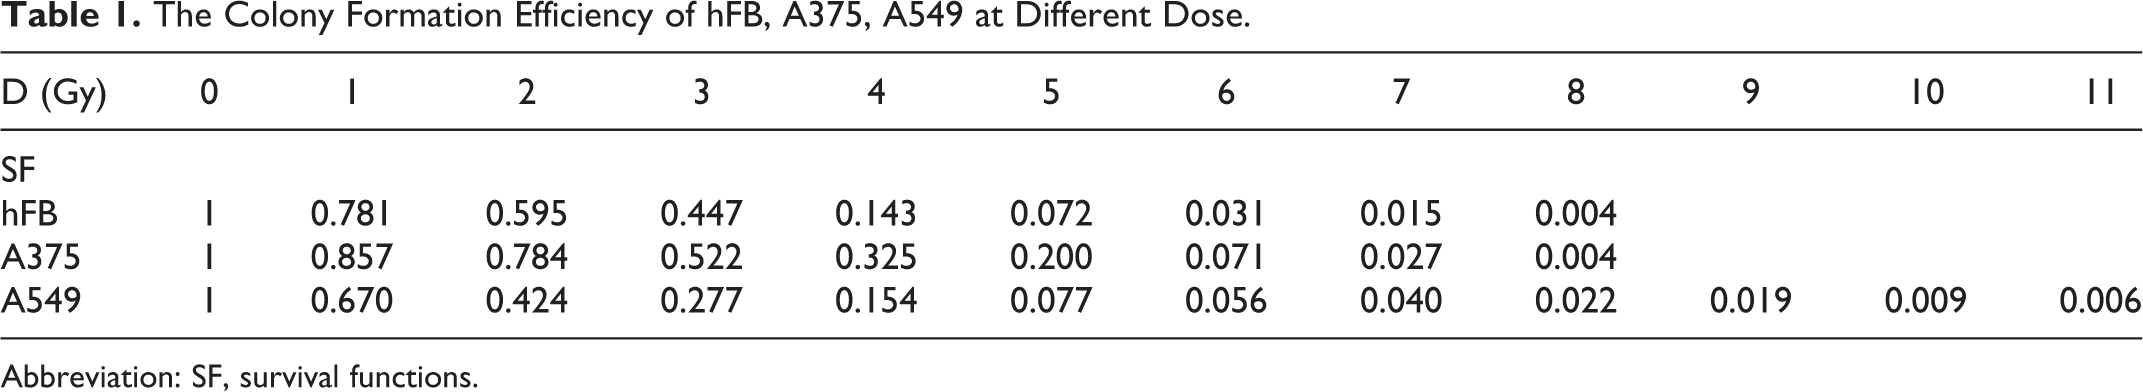
Abbreviation: SF, survival functions.
The Fitting Results of hFB Survival Curve With Different Functions.

Abbreviation: RMSE, root mean squared error; SSE, sum of squared errors.
The Fitting Results of A375 Survival Curve With Different Functions.

Abbreviation: RMSE, root mean squared error; SSE, sum of squared errors.
The Fitting Results of A549 Survival Curve With Different Functions.

Abbreviations: LQ, linear-quadratic; RMSE, root mean squared error; SSE, sum of squared errors.
The matching effect of the LQ model, Equation 3, was preferable at low dose region and α/β demonstrated a rational value. The goodness of fit, however, dropped significantly with the dose increasing and the values of α and β became negative sometimes which violated the initial definition of the factors.
In total dose range, determination coefficients were between 0.99 and 1, and those analog effects were good. Equation 6 was the best fitting model. The minimum of RMSEs in Equation 6 at different d 0 values set was obviously less than corresponding values in Equation 3 or 8.
Equation 8 fit was inconsistent in terms of research. The values of RMSE and α/β were similar to those of LQ at low dose range, while the values of β and γ in the fitting of A375 and A549, respectively, were negative which could not be explained by the probability of particles interaction, and α/β was unable to be applied in the clinics.
Figure 1 showed the clonogenic survival curve of A375 within a range of 0 to 8 Gy and the comparison of predictions of Equation 3 (LQ), Equation 3-L (LQ model fitted at low-dose range(0-4 Gy)), Equation 6 (d 0 = 5 Gy), and Equation 8. Equation 6 fit well in low dose range similar to Equation 3-L, and as good as Equation 8 in high dose range. There was a perceived overprediction of cell killing by the LQ model.
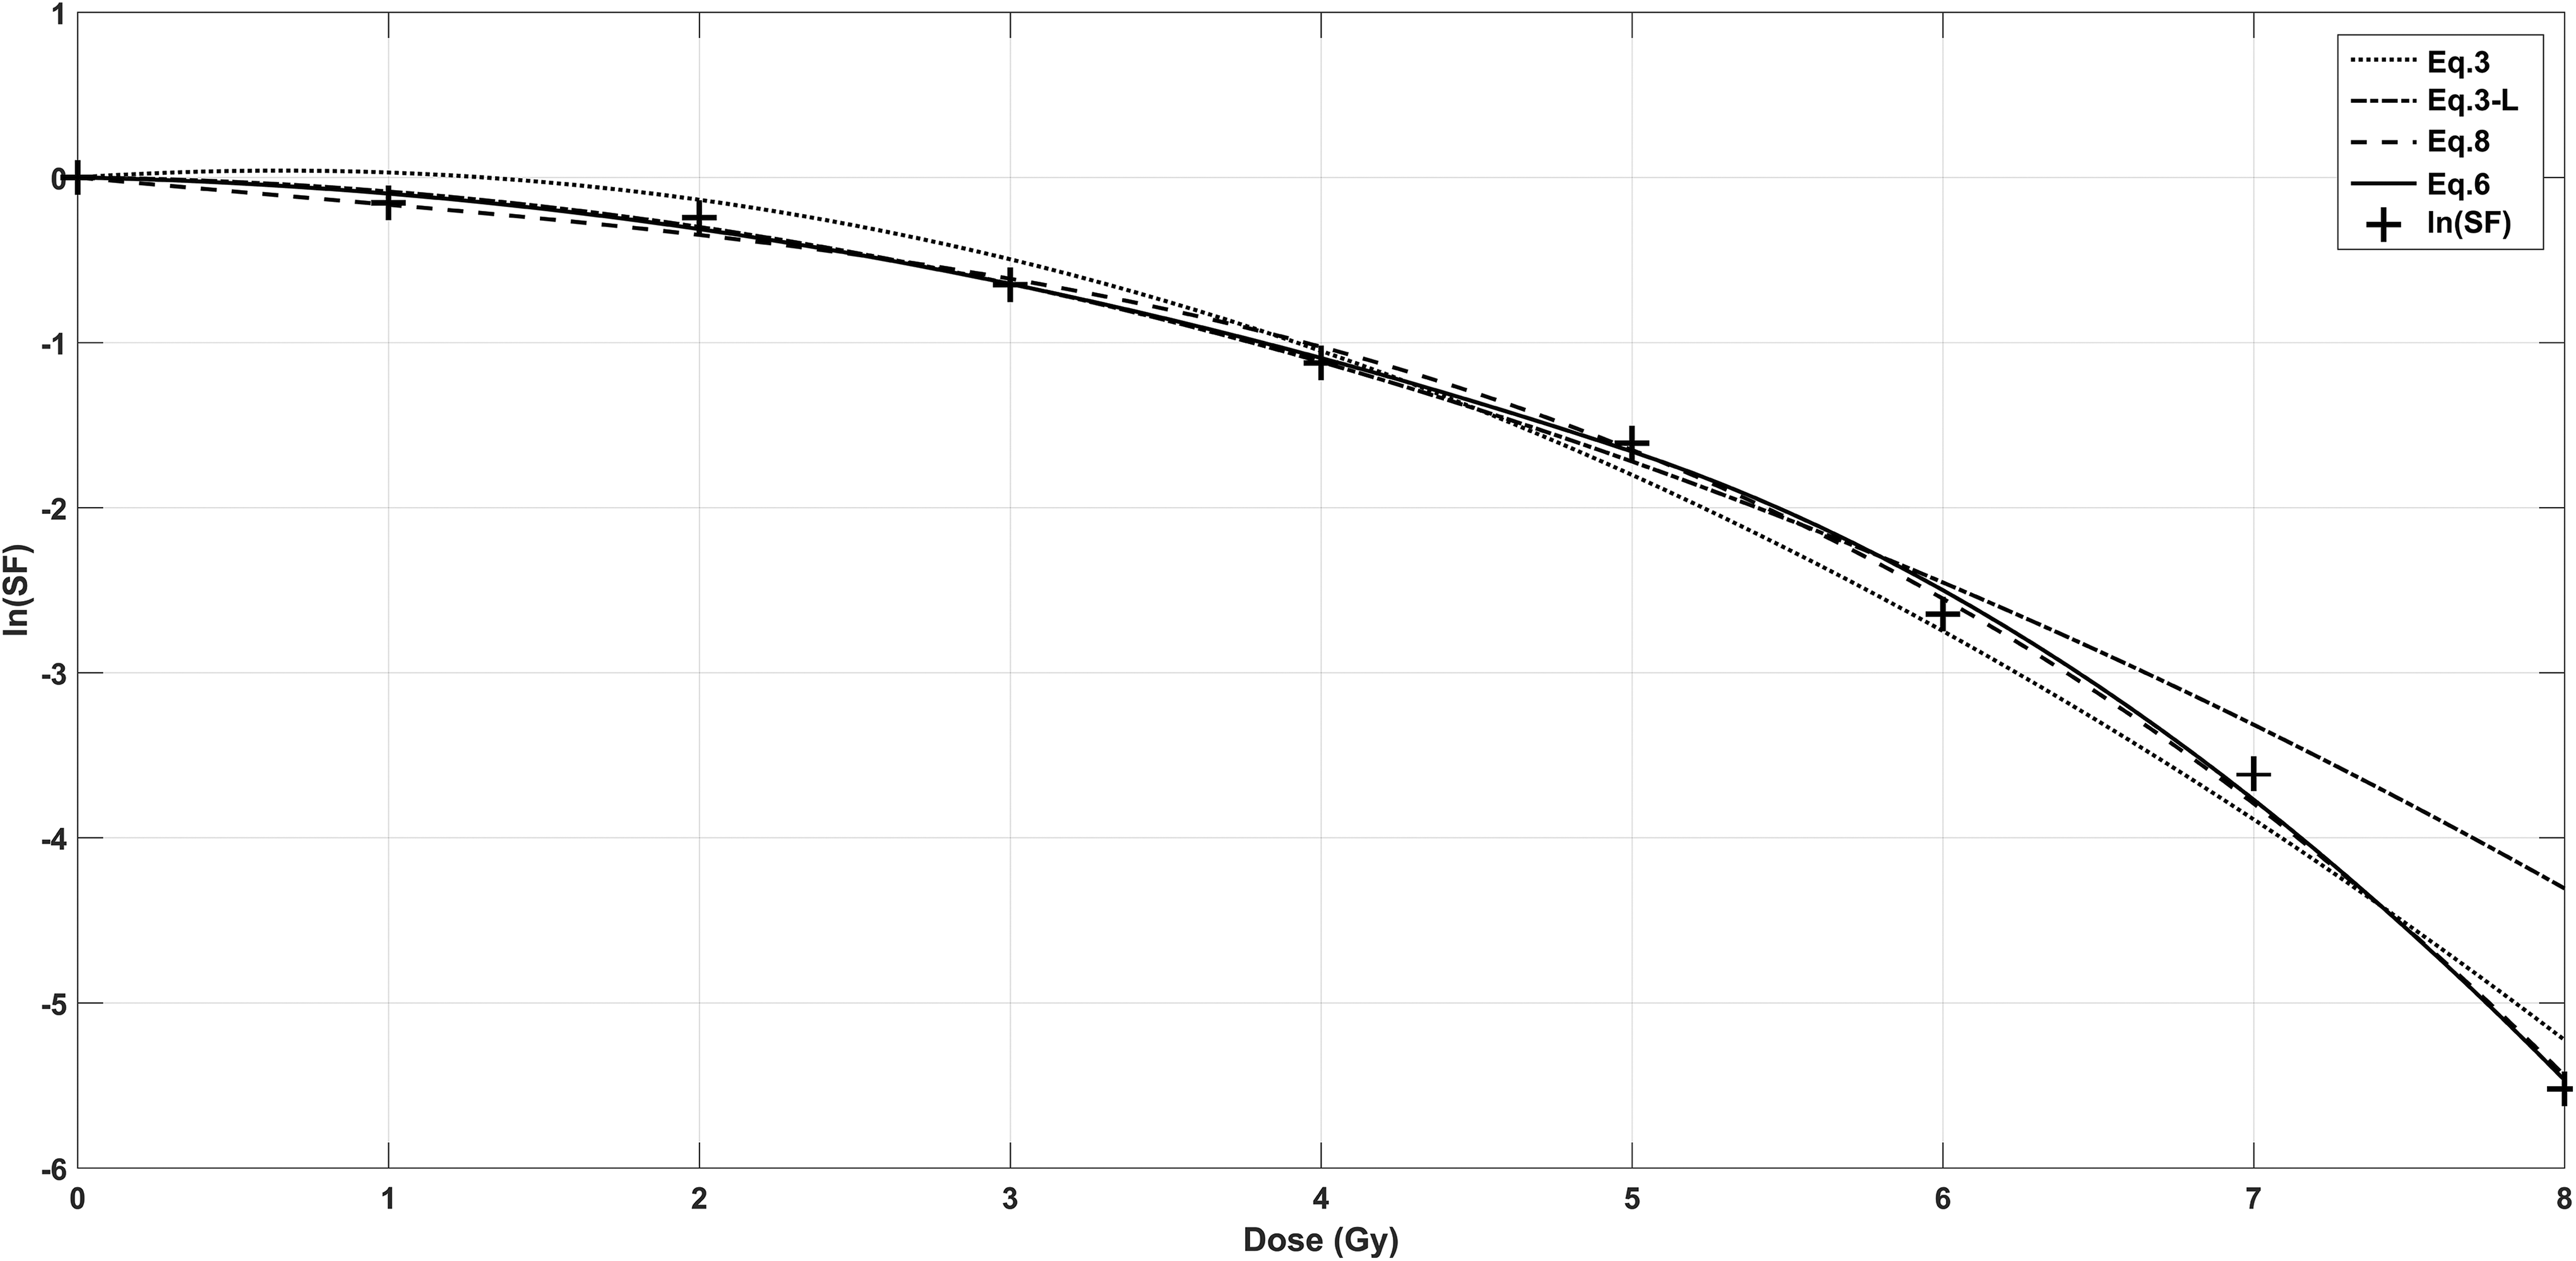
The clonogenic survival curve of A375 within a range of 0 to 8 Gy. Comparison of predictions of Equation 3 (LQ), Equation 3-L (LQ model fitted at low-dose range [0-4 Gy]), Equation 6 (d 0 = 5 Gy), and Equation 8. Equation 6 fit well in low-dose range similar with Equation 3-L, and as good as Equation 8 in high-dose range.
The optimal parameters of LQ model were chosen at low dose range and those of Equation 6 had been obtained when the values of α and β were positive and RMSE was the lowest. It was possible to test the hypothesis that the 2 functions described the data (H0: not rejected) by assuming that the measured values were independent and normally distributed, and the errors were known as well as standard normal distributed. For that, the results for total dose range are shown in Table 5. The table showed the both functions with optimal parameters could describe the measured survival data of all cells. However, an improvement of the Equation 6 was achieved with considerable difference of χ2/df in magnitude with LQ model and an increment of the P values which were greater than 95% in 3 cells, far higher than those of LQ.
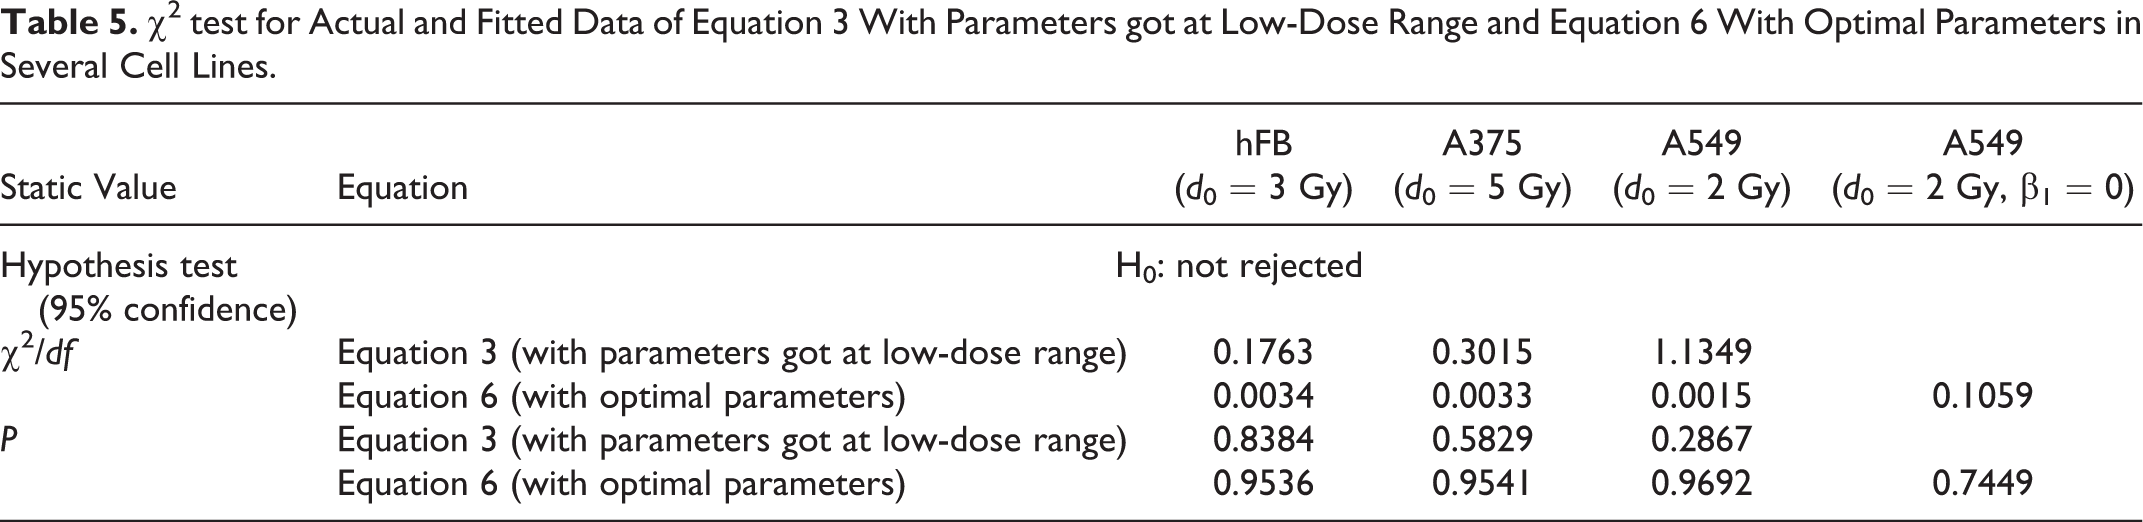
Table 6 showed the BEDs of 6 Gy × 5 Fx and 2 Gy × 30 Fx for the treatments of melanoma. The disparities of calculated results were lower with the conventional formula and increased slightly with the modified one.
The BED Values of 6 Gy*5 Fx and 2 Gy*30 Fx for the Treatments of Melanoma.

Abbreviations: BED, biologically effective dose; CFRT, conventional fractioned radiotherapy; SBRT, stereotactic body radiation therapy.
Table 7 shows the BEDs of 22 Gy × 3 Fx and 2 Gy × 35 Fx for the treatments of NSCLC. The figures of SBRT were well above CFRT by taking the conventional equation and became nearly identical by the new one.
The BED Values of 22 Gy*3 Fx and 2 Gy*35 Fx for the Treatments of NSCLC.
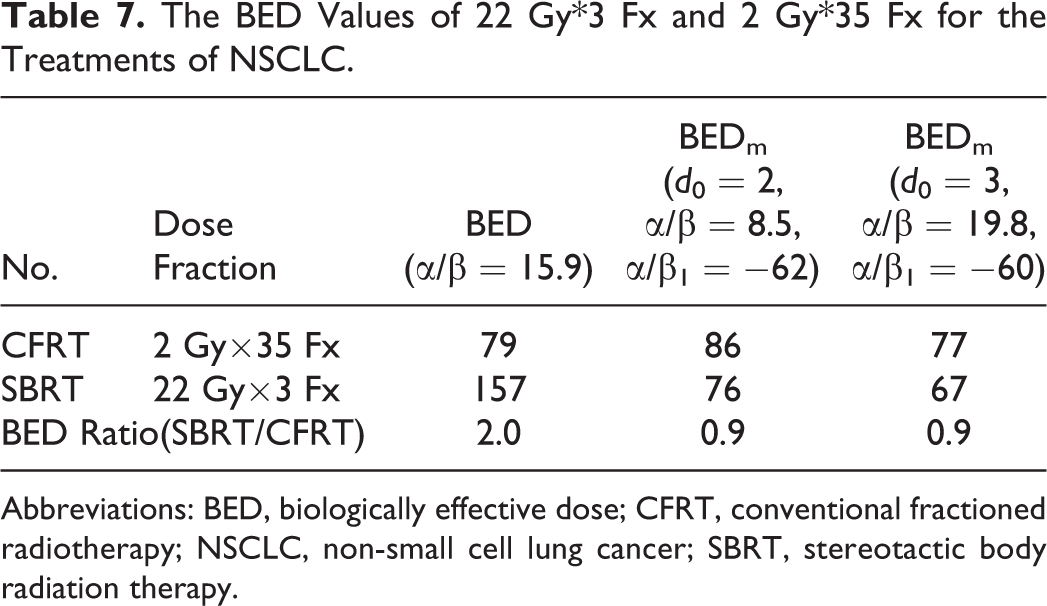
Abbreviations: BED, biologically effective dose; CFRT, conventional fractioned radiotherapy; NSCLC, non-small cell lung cancer; SBRT, stereotactic body radiation therapy.
Table 8 shows the modified BED values of various hypofractioned NSCLC treatments. The biological effects were vastly different among various hypofractionations corrected the deviation of LQ model.
The Modified BED Values of Various Hypofractioned NSCLC Treatments.

Abbreviations: BED, biologically effective dose; NSCLC, non-small cell lung cancer.
Table 9 presents the new BED values of the hypofractionations applied in Stephans et al’s study and the reported LC ratio. There was a distinctive linear relationship between them.
The Modified BED Values of Various Hypofractionations and Local Control in Stage I NSCLC Treatments.

Abbreviations: BED, biologically effective dose; CI, confidence interval; NSCLC, non-small cell lung cancer.
Discussion
Given closer analysis of the survival behavior of CHOAA8, U373MG, DU145, and CP3 cells in an extensive dose range for X-rays irradiation, Garcia et al found that the fit quality of LQ model was related to the selected dose region. The outcome was adapted to a small scale, which was different in various cell types. 1
χ2-statistics test in this study also presented a deterioration of goodness of LQ model fit at high-dose ranges, especially in the curves of tumor cells. The survival model showed more suitable for the normal tissue cells, which reflects a special in vitro proliferation existing in the tumor cells.
The parameters α and β from LQ model have been widely used in different ways of fraction dose radiotherapy, while the BED with α and β was applied as a comparison parameter among various kinds of treatment plans despite its limitations and imperfections.
A curve function describing the survival of cells well in the full fractionation range without changing LQ model at all is a clinical imperative, which can absorb practical experience in conventionally fractionated treatment and be fitted to hypofractionated radiotherapy outcomes.
The curve fitting result of Equation 8 indicated it was not sufficient to solely depend on increasing orders. The RMSE in cell A549 curve fitting of Equation 8 was higher than Equation 3 (0.1269 vs 0.1216), meanwhile, α/β value was 84.4, far higher than the maximum, 10, what is normally considered. The β value in cell A375 curve fitting became negative, which could not be explained as the mean probability per unit square of the dose in linear quadratic therapy.
This study added second-order coefficient β1 in the improved curve function, retaining α and β parameters, without increasing the order, thus better results had been gained.
The added parameter could be explained in terms of radiobiology. The average probability of both particles interaction should be modified due to the increasing of fraction dose and electron scattering.
More biological explanation of the parameters in the modified LQ function can be further explored, the constant,
In the fitting of A549 survival curve, if d
0 = 2,
The difference of BED values between SBRT and CFRT increased slightly in the modified model due to the small deviation of LQ model with lower α/β values.
The conventional BED value of SBRT showed doubles that of CFRT for similar NSCLC treatments, which seemed hard to explain. 16 Some researchers proposed it as “overkill” of SBRT, 20 that would mean no needing to increase the dosage to get more curative effect. There is a huge problem in comparing differentia at various dose fractionations, resulting from the theoretical defect of LQ at high dose range. Biologically effective dose model, correcting the deviation, will obtain the further expansion in clinical practice’s value. It is reliable as Table 7 shows, in similar treatments of tumors with high α/β values, BEDs are close and the differences can be seen as the benefits of short protocols overcoming cells’ accelerate repopulation.
Haque et al concluded SBRT had more benefit in OS 18 which seemed to contradict with Chang et al’s study. Actually, not all of what Haque investigated could be considered as an ablative radiotherapy, and when BEDs had been recalculated by the modified model, and huge disparities were found among them. The conclusion would be supported when there were a large sample of hypofractionations with BEDs, that is, more than 71 (20 Gy×3 Fx, d 0 = 2), otherwise, the results would be similar to the SPACE study.
Another retrospective analysis on 508 cases with SBRT revealed gross tumor volume BED was associated with in-field failure and the cutoff value should be more than 110 (α/β = 10). The lower prescription doses (ie, 12 Gy × 4 or 10 G × 5) compared with 18 Gy or 20 Gy × 3 should be avoided for squamous cell carcinomas. 21 The validated results of modified model as Table 8 indicated that the BEDs of lower ones were only 62 and 66 far below the CFRT (2 Gy × 30), which was close to 20 Gy × 3. The threshold of 110 would not be used prevalently as SBRT lacked explicit definition, while the modified model was suitable for various dose fractionations.
The reliability of modified model could be validated via the linear relationship between new BEDs and LC, which was congenial with reason and common sense and should be more obviously when the LCs of 7.5 Gy×8 Fx and 5 Gy×10 Fx in central type were analyzed respectively.
A new EUD model was derived to compare treatment plans with different time-dose fraction schemes and dose distributions. The sectional function solves the problem that the LQ model is not accurate and applicable to high doses per fraction. Based on this mathematical model, a new EUD model derived is instructive to compare the radiation effects of volumes with various dose distributions.
As the clinic application of hypofraction and SBRT gains popularity rapidly, correcting the deviation of LQ and BED models in high dose area grows more important. This research improved cell survival curve fitting method, whose merit lay in that it broke up the dose range of α, β parameters limit on the previous method. Such equation promotes hands-on clinic experience retaining α, β arguments, expands judicious use of BED attaching a correction parameter of hypofraction dose. We established the formula of modified BED and EUD model, based on the piecewise curve functions, which could serve for the transformation of different dose fraction equivalents and the standardization of heterogeneity distribution comparison. Quite close analogous calculation results are obtained by applying modified BED model to the different dose fractions, whose efficacy showing similar and BED-based LQ model showing big variations in the cancers with high α/ β values. The modified models are worthy to be testified and brought into wide use.
Footnotes
Authors’ Note
Li yan Dai, Ren hua Huang, Yun Zhou contributed equally to this work.
Acknowledgments
Authors thank the research staff in all the participating centers.
Declaration of Conflicting Interests
The author(s) declared no potential conflicts of interest with respect to the research, authorship, and/or publication of this article.
Funding
The author(s) disclosed receipt of the following financial support for the research, authorship, and/or publication of this article: This work was funded by the seed fund of Renji Hospital, School of Medicine, Shanghai Jiao Tong University (Grant No. RJZZ13-026), the clinical study with combined traditional Chinese medicine and western medicine of Shanghai Municipal Committee for health and family planning (Grant No. ZHYY-ZXYJHZX-201610), Incubating Program for Clinical Research and Innovation of Renji Hospital, School of Medicine, Shanghai Jiao Tong University (Grant No. PYXJS16-005), and the science and technology project of Henan province (Grant No. 182102310700).