
Abstract
The issue of pet emotion and health management has become more and more concerned by pet owners and pet medical organizations. This paper takes medium-sized and short-haired dogs as the research object, firstly, through the questionnaire survey to clarify the physiological indicators for the establishment of this kind of emotional model; secondly, based on the above points, the overall design scheme of the smart dog clothing is specifically analyzed from the functional system and the emotions of the pet dog are clustered through the pet dog physiological data, and the emotional condition of the pet can be quantified by analyzing the relationship between the pet’s body temperature, heart rate and respiratory rate, and deriving the corresponding Emotional judgment index. The mutual integration of the clothing, hardware and software is realized, and the interactive effect of the clothing is realized through 3D design software; finally, the scientificity of the data and decision tree results, the functionality, comfort of the clothing is tested through experiments. The results show that the clothing can accurately analyze the changes of pet dog’s emotions under different living environments, further bridging the innovative needs of the new pet clothing market, providing reference and information for the design of pet smart clothing, and injecting new possibilities for building a harmonious human-pet society.
Introduction
In recent years, with the improvement of the national living standard, people are pursuing the comfort of material life while pursuing the pleasure of spiritual life, and pet dogs have thus become a special member of many families. They bring joy to people at the same time, but also the same brought some problems, pet diseases, bad behavior, and other problems touch the nerves of many owners. 1 Pet dogs’ depression, bipolar dis-order and other adverse emotional problems triggered by intimidation, injury, and other serious damage to social harmony and public safety, the environmental problems caused by pet ownership are becoming more and more prominent while the health and emotional status of pets are crucial for their owners. Usually, we can judge a dog’s mood by its tail wagging and staying state. For example, a tail wagging horizontally with a large amplitude represents that it is very happy; if the tail is high and the end is wagging, it represents that it is ready to attack. However, due to the individual variability of pet dogs and the different cognitive levels of people, the traditional judgment methods do not have accuracy and scientificity. Therefore, it is necessary to develop a wearable that can autonomously recognize the emotions of pet dogs, owners can better understand the needs and status of their pets and take timely measures, which in turn improves the quality of life and sense of well-being of their pets.
The methods of emotion recognition are mainly based on two main categories of non-physiological signals (facial expressions, speech, behavioral aspects, etc.) and physiological signals (heart rate, skin resistance, respiration, brain signals, etc.). For pet dogs, whose emotional outward appearance and brain activities are not as complex as those of humans, most of the non-physiological signals can be obtained from visual inspection. Physiological signals can be measured according to characteristic values, and emotional states and classifications can be obtained through analysis.2 –4 Researchers have done a lot of exploration in the use of biological physiological data to identify emotions. 5 Sumon et al. proposed a deep learning method based on the improved EfficientNet-B5, and analyzed four types of emotional images of pet dogs and cats to achieve precise recognition of the animals’ emotions. 6 Japanese scholar Kazunori Ohno and his team proposed to measure the heart rate of the experimental dogs by wearing soft disposable electrode underwear with M-X lead layout, and to obtain their emotional changes. 7 The team of American scholar Rita Brugarolas has designed a new non-invasive wearable sensor system to test the physiological correlation of stress and excitement in animals outside the laboratory environment. 8 Foster et al. used a wireless heart rate sensing system to obtain electrocardiogram data from experimental dogs, which can accurately assess their emotional performance. 9 Zhang Chao tried to use the Internet of Things to build a psychological monitoring and emotional monitoring system. 10 Liu Heng extracted the characteristic parameters through mechanical learning and clustering analysis of sound signals in order to assist in the identification of dog’s emotions. 11 These studies theoretically proved that each physiological signal can well respond to the changes of biological emotions.
Nowadays, the clothing industry and medical, sports, the Internet and other economic hotspots are setting off a “wearable revolution,” smart wearable devices should come out.12,13 Hegarty-Craver et al. proposed the Alpha Wear platform in “Military Medicine.” This platform is supported by open-source technology, enabling the collection, processing, and analysis of wearable sensor data, and converting it into decision-support information. 14 In the design of pet smart wear, smart products based on different needs are also emerging. Jin et al. designed a Lily Pad Arduino-based smart dog nighttime clothing to improve the clothing’s wakefulness at night and reduce the likelihood of safety accidents caused by pet dogs walking at night. 15 Play Date smart pet toy ball as a remote monitoring device, which can monitor the pet’s activities and enables interaction with pets from a floor view. 16 These smart pet wearable products all facilitate the interaction and communication between owners and pets to a certain extent, but there are still deficiencies in intuitively recognizing the emotions of pets in order to effectively meet the users’ emotional care for pets.
In the design of existing pet clothing textiles, designers are through the traditional design of clothing two-dimensional style drawings, effect drawings, or directly produce physical products.17,18 However, the static plan cannot truly visualize the effect of clothing, and the physical production cannot know the wearing effect in advance. During the making of pet clothing samples, the efficiency of design and development will be reduced due to repeated corrections due to structural problems, or the difficulty of pet dogs to cooperate with other factors. 19 Therefore, the application of fast and convenient 3D simulation technology for pet clothing product development is very necessary.
From the above research, it is clear that there is still room for exploration in the field of smart sensory pet clothing products oriented to daily life. This study aiming at the emotional health problems such as depression and bipolar disorder of pet dogs and the owner’s demand for scientific management of pet dogs, a smart pet dog clothing with emotional feedback capability is designed. Pet smart clothing can help owners better manage their pets’ health and living habits by monitoring their pets’ health and activity levels. 20 While paying scientific attention to the psychological dynamics of pet dogs and reducing the threat of their morbidity, it better promotes family harmony and social harmony. Pet smart clothing based on monitoring and emotional feedback is important for social, economic. It not only enhances the quality of life and well-being of pets while strengthening the emotional bond between humans and animals, but also fosters the development and innovation of related industrial chains, all while mitigating adverse environmental impacts.
Methods
Guided by the prevailing trend in smart safety clothing design and informed by the physiological and psychological characteristics of pet dogs (e.g. companion dogs), this study establishes the primary objective of meeting the need for daily emotional monitoring. The research process comprises four integral components: technical system design, clothing design and simulation, subjective and objective evaluation, and the path of the study is shown in Figure 1.

Research flowchart.
In the first part, the technical system includes pet emotionally correct testing, caring feedback and smart monitoring. It also builds a pet communication cloud platform for related products to meet the needs of socializing and medical activities for pet dogs in the same city.
The second part of the study was carried out in three aspects, including fabric, structure, and appearance. In terms of fabrics, we choose fabrics with certain mosquito repellent and antibacterial effects, and at the same time, considering that pet dogs are more likely to be injured or lost when crossing the road alone, we need to consider the selection and layout of reflective materials. In terms of structure, considering the loads of electronic components, we should also pay attention to the reasonableness of the layout of the electronic components and the distribution of the flexible sensing lines in the structure of the clothing, in order to ensure the safety and at the same time, not to affect the overall esthetics. The overall esthetics of the clothing should not be affected. Moreover, in order to meet the potential demand for pet socialization, a multi-element, multi-style and multi-color design is required.
In the third part, multi-color combination clothing is designed through 3D scanning technology and virtual simulation technology. Vivid virtual effects can be displayed on the screen and selected by the pet owner, while matching the owner’s acceptance and preference. This personalized and participatory experience aims to improve the overall design efficiency of pet smart clothing.
The fourth part is the clothing evaluation, by which it can be divided into three sub-objectives: (1) by testing the performance, sensitivity, stability and warning effect of the clothing technology system, so that the degree of realization of the monitoring function can be evaluated; (2) by combining the subjective and objective evaluation method, the accuracy of the emotional feedback function can be evaluated; and (3) by considering the cost of user use, the difficulty of cleaning and maintenance, and the service life of the product to carry out the sustainability evaluation.
Survey of relevant indicators
Prior to product design, production, and testing, market research was conducted to identify physiological indicators of emotion modeling. 21 Potential users were surveyed on the proportion of people who recognized different degrees of emotion in their own pet dogs, and the relevant degree of physiological indicators that affect emotion were ranked. The methodology was designed to provide a comprehensive understanding of emotion recognition in pet dogs and to establish an emotion model to enhance the effectiveness of the product design process. A total of 100 copies of this survey were distributed and 87 valid questionnaires were recovered, and the subjects of the survey were dog-owning residents near Minzu Avenue, Hongshan District, Wuhan City.
The results of the survey showed that the percentage of the total sample of people who had varying degrees of emotion recognition for their own pet dogs were: completely unrecognizable (10.23%), impaired (36.36%), unsatisfactory results (30.68%), and very well recognized (21.59%). In addition, heart rate and respiratory rate were perceived to be in the top two of the samples with good recognition in terms of the degree of correlation between physiological indicators and emotions (21.59%). Based on the results of the market survey, appropriate physiological indicators for modeling emotions in pet dogs were identified.
Experiment and design
Based on the questionnaire, the hardware and software systems that can feedback the temperature, heart rate and respiratory rate of the pet dog are selected and established, and the appropriate circuitry is assembled to enhance the emotional feedback function of the intelligent pet clothing. Then create the emotional model and carry out the corresponding clothing design.
Clothing hardware module
The clothing hardware module is responsible for the detection, transmission and execution of pet physiological information and emotional feedback. The hardware system consists of four parts: development board, infrared temperature measurement module, heart rate oximetry module and power supply module. The specific models are ESP-12f 8266 mini and Arduino Nano V3.0 development board (Jiaxin Micro. Co., Ltd, China), 22 MLX 90614 ESF infrared temperature and MAX 30102 heart rate oximetry sensor (Xintai Micro. Co., Ltd, China), 23 and rechargeable lithium battery.
The ESP-12f 8266 (Figure 2(d)) acts as an information processing module and WIFI module (Back of Figure 2(d)), configured with the common functions of a general development board as well as common communications, and it can be developed using the Arduino IDE tool. the ESP 8266 chip transmits the sensor values to the data monitoring platform through the serial communication. The platform is an end web page that receives and displays sensor data processed by the processor, and the web platform connected to this IP address can be accessed through the cell phone user terminal. The Arduino Nano V3.0 (Figure 2(b)) is a small development board based on the ATMEGA328P-AU MCU, and it can be used to cooperate with other software to complete the interaction.

Hardware design: (a) layout-design of integrated circuits; (b) on the front side of integrated circuit, a-infrared temperature measurement module, b-Arduino microcontroller, c-heart rate oximetry module, d-ESP microcontroller; on the opposite side e-lithium battery, f-switch.
To meet the need of obtaining the epidermal temperature data of pet dogs, the MLX 90614 ESF infrared temperature sensor (Figure 2(a)) is selected for this design, non-contact temperature measurements with a temperature range of −40°C to 85°C. The unique single-port wiring method enables bi-directional communication with the processor with only one port line. The advantages of fast response, strong anti-interference ability, high-cost performance, small size and low power consumption make it the best choice for temperature measurement applications. At the same time, in order to obtain the pet dog blood oxygen heart rate data, this design selects the MAX30102 heart rate oximetry sensor (Figure 2(c)), which integrates a pulse oximeter and a heart rate monitor module, and uses the PPG photoelectric volumetric pulse wave tracing method (Photo Plethysmo Graphy) to measure the data, through the measurement of hemoglobin in the blood with the heart beating and the amount of change in the uptake of oxygen to measure the pet’s heart rate. In addition, in order to obtain the pet dog breathing signal data, the collected blood oxygen heart rate data and through the algorithm to analyze, you can get the pet dog’s respiratory rate, the specific part of the code is as follows: #include <Wire.h> #include <Adafruit_MLX90614.h> #include <SimpleTimer.h> Adafruit_MLX90614 MLX = Adafruit_MLX90614(0x5A); volatile int item; SimpleTimer timer; void Simple_timer_1() { Serial.println(MLX.readObjectTempC()); } void setup(){ Serial.begin(9600); MLX.begin(); item = 0; timer.setInterval(2000L, Simple_timer_1); } void loop(){ timer.run(); }
Based on the fabric characteristics, according to the lightweight design requirements of smart clothing, lithium battery is selected as the power supply module and embedded in the integrated circuit board. Its light weight, small size, low power consumption and high adaptability can better meet the needs of smart clothing lightweight, easy to wear, and take off, can be stored. The sensors and lithium batteries are connected to the development board for communication: the positive pole of the power supply is connected to pin 0 of the ESP 8266 processor and the VCC (voltage at the common collector) pin of each sensor respectively; at the same time, the D1 and D2 pins of the ESP 8266 are connected to the out pin of each sensor respectively. The analog signal collected by each sensor is sent to the development board for analog-to-digital conversion through the acquisition board, and the program on the PC (personal computer) side processes the digital signal transmitted through the serial port of the development board and identifies the emotions, and the identification results are transmitted to the Aliyun platform through the WIFI module. The cellphone APP (application) establishes a connection with Aliyun to obtain instant data.
After each of the above hardware is established, it is made into an integrated circuit as shown in Figure 2.
Upper computer software
The upper computer of the system is responsible for detecting and analyzing the pet’s physiological information. Users can view the real-time physiological data of the pet dog and the emotional feedback obtained through the analysis of the insinuation relationship on the mobile APP through the supporting software of the upper computer.
In the IoT platform to develop the relevant APP (Pet Supervision), the product and set up the configuration, in the development tool Iot Studio to design the APP interface and configure the data source, the communication protocol is http. data receiving choose to use the AliCloud platform (Alibaba Cloud Computing Co. Ltd, Hangzhou, China) to build the IoT model and build the web end. Using Arduino IDE to write the program, before writing the program need to download the appropriate coding library to support the compilation and burning of different hardware. For the interconnection between the microcontroller and the Aliyun server, the AliyunIoTSDK function is compiled inside the AliyunTSDK function to configure the Aliyun ternary group. The configured code is burned to the ESP 8266 processor through the USB connection cable. Upload the real-time monitoring data of each sensor received by the microcontroller to the cloud platform through the WIFI module and build the basic environment for the APP data display on the user side.
In the monitoring service interface of the APP’s page design, the user can obtain real-time information related to the pet’s heart rate, temperature, respiratory rate, mood and the switch status of the smart clothing, and export the history of the pet dog’s physiological data through the data log, which can help the pet dog to seek medical treatment for auxiliary reference. The software interface is shown in Figure 3.

Software monitoring interface diagram: left (Angry), right (Clam).
Establishment of emotional model
Based on the emotional intensity and positive and negative emotional states in Thayer’s emotion model, 24 this study broadly categorized the emotions of pet dogs into four more distinctly differentiated to-be-measured indicators, such as exciting, angry, pleased, and calm. To explore the correlation between target physiological data and the emotions of pet dogs, a comprehensive data collection involving pet dogs was conducted after the completion of clothing and hardware integration. To ensure the integrity and accuracy of the collected data, certain factors such as hair (which may affect hardware), age (which may impact fit), type, and health (which may influence emotional performance) were taken into account.
36 medium-sized, short-haired, well-healthy adult pet dogs willing to cooperate and fit well were randomly recruited by assembling the three designed finished integrated circuits, restraining them via harnesses in the middle of the dog’s back and conducting the data-collection experiments. Owner consent was obtained for all experiments and pet dogs did not resist. An average of three animals were measured every day for 12 days. The changes of physiological values such as surface temperature, respiratory rate and heart rate corresponding to different emotions were recorded during the experiment period (08:00 to 21:00 in early July). Considering the gradual change characteristics of emotions, they were recorded every 10 min.
All subjects (owners) in this study voluntarily participated in the test and cooperated with the try-on. All data are anonymous, and no personal names and addresses are recorded. Before the test, the subjects (owners) have been informed orally that the purpose and use of the survey and the publication of the research results.
During the course of the experiment, we recorded the mood change data of the animals according to the measured data at different time periods, and judged by the measurements of the relevant persons and the assistance of the owners of the experimental subjects, in which each data was recorded accurately. The experimental protocol for establishing the emotional model of pet dogs is detailed in Table 1.
Core investigation items and response indicators of the experiment for establishing the emotional model of pet dogs.

A total of 2808 data were obtained in this experiment, and the data were screened through SPSS discrete analysis. The screening of exciting outliers was shown in Figure 4, and the other four emotions were screened by the same method. A total of 121 outliers were screened and 2687 valid sample data were obtained, of which 557 were exciting emotion samples, 358 were angry emotion samples, 716 were pleased emotion samples and 1056 were calm emotion samples. The collected data were integrated and analyzed by doing a normality test and the results are shown in Table 2.
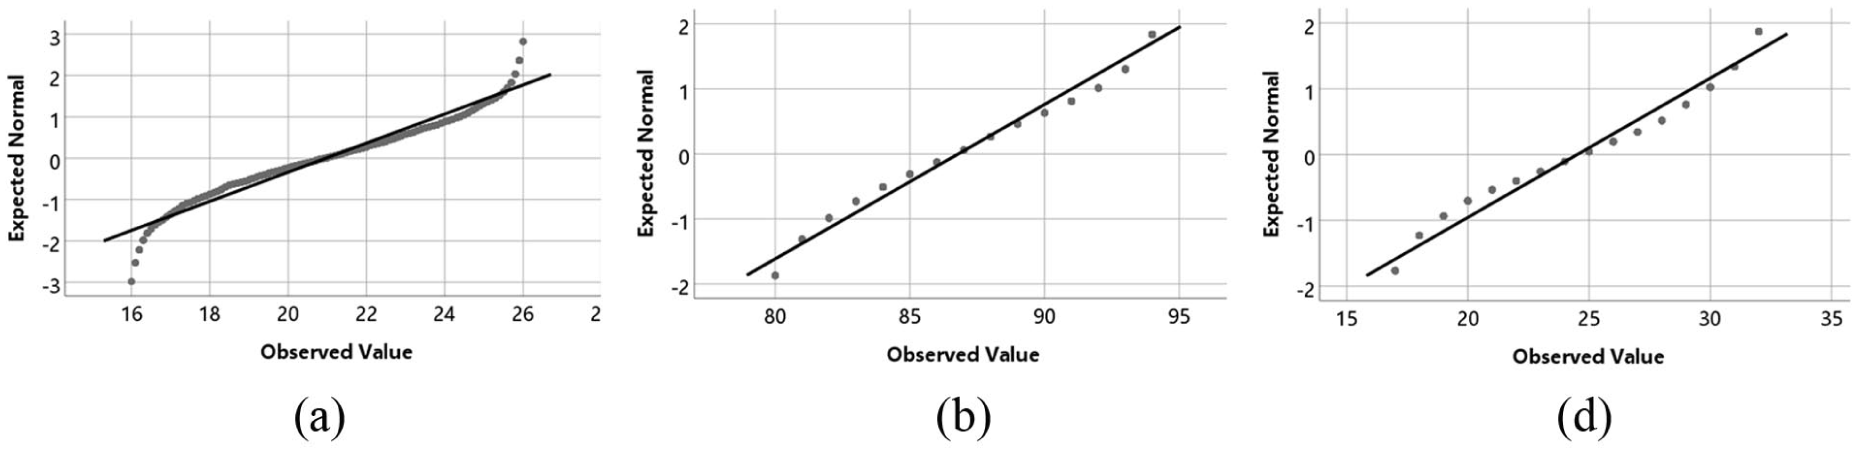
Normal Q-Q diagram of each physiological index: (a) temperature for clam; (b) heart rate for clam; (c) respiratory rate for clam.
Compares average.

Prior to modeling, the collected heart rate, respiratory rate, and temperature data were benchmarked against standard physiological reference intervals for healthy adult dogs provided by the Merck Veterinary Manual (Table 3). 25 The heart rate and respiratory rate measurements fell within the established normal ranges, thereby validating their suitability for subsequent analysis. While the temperature readings exhibited deviations from the reference values, potentially due to environmental or site-specific measurement factors, their utility for analyzing relative emotional differences was confirmed through correlation with other physiological indicators. Consequently, the overall validity of the dataset for modeling purposes is affirmed.
Comparison of Physiological Indicators of Healthy Adult Dogs with Reference Values from the “Merck Veterinary Manual.”

It can be seen from the mean and median series that the temperature values corresponding to the four emotions are quite different, while the stage standard deviation of angry, exciting, and pleased is almost the same. The standard deviation of the calm state with a larger sample size is slightly larger. Furthermore, multiple comparisons of body surface temperature, heart rate and respiratory rate corresponding to different emotions were conducted by ANOVA, as shown in Table 4.
Results between groups (combined) analyzed by ANOVA.

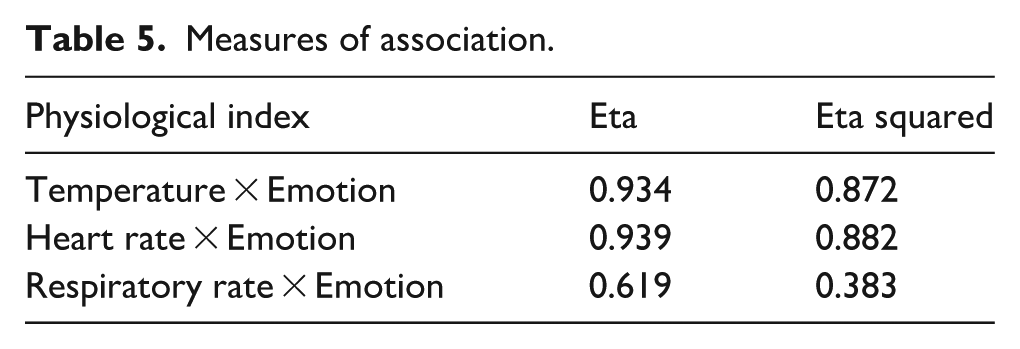
According to Table 5 of ANOVA, the significance level p-value ⩽ 0.05 indicates that the corresponding temperature difference under different emotions has statistical significance and significant difference. As can be seen from the correlation scale, for the three physiological indicators, the Eta coefficients were 0.934, 0.939, and 0.619, which were all greater than 0.600, while the Eta coefficients were 0.872, 0.882, and 0.383, with the first two items greater than 0.600, further indicating that there was a significant correlation between corresponding temperature and heart rate under different emotions. Respiratory rate was also significant.
Measures of association.
The results of the single factor ANOVA test above show that these three indicators can significantly affect the change of mood. Then, the normal Q_Q graph was analyzed for the three indexes of body surface temperature, heart rate and respiratory rate respectively, and it was found that all the data fluctuated up and down near a line overall, which again indicated that the three physiological indexes had a significant impact on the emotional changes of pets, as shown in Figure 4.
Integrate the physiological data corresponding to the collected emotions and extract the characteristic values. The K-means clustering algorithm was carried out through Python to obtain the mapping relationship between various physiological data and emotions of pet dogs. 26 From the aggregation results exported by the Python program, the clustering effect diagram of emotions and various physiological indicators is shown in Figure 5.

The mapping relationship between emotions and physiological indicators.
Further, the mapping relationships demonstrated by the clustering effects were organized as shown in Table 6.
Mapping relationship between emotion and physiological indexes.

The results show that the clustering effect of the four emotions is more obvious, and according to Figure 5, the sample data of angry and pleased are closer to each other and some of them are also mixed. It can also be found that physiological data types (temperature, heart rate, respiratory rate) have a tendency to have higher values in exciting and angry emotions, and lower in pleased and calm emotions. There are differences in the ranges of physiological data types between different emotions.
Clothing carrier design
Based on the research’s ranking of the importance of clothing design factors, pet dog clothing should not only greatly avoid friction with pet hair and skin allergies, but should also comply with the provisions of the Pet Clothing Standard 2017 and the fiber content of clothing GB/T 29862. 27
To fulfill the requirements of comfort, protection, mosquito repellency, and antibacterial properties, the clothing is designed with a cotton fabric outer layer (97% cotton, 3% spandex) and a graphene cotton inner layer (90% cotton, 3% graphene, 7% spandex). The outer layer provides outstanding breathability, moisture absorption, efficient thermal insulation, and protection against cold. Meanwhile, the inner layer is treated with wild wormwood extract, enhancing its mosquito repellent and antibacterial effects. It also exhibits notable inhibition against the growth of microorganisms like Staphylococcus aureus and Escherichia coli. Refer to Figure 7 for a visual depiction of its appearance and structure.
This study chose the four-legged short sleeve as the basic version of the clothing style, and the size standard of the product was developed in the process of size comparison and consideration of the circuit design, taking M size as an example, as shown in Table 7.
Size of each part of M size pet clothing(cm).

Using Adobe Illustrator for style design, while using CLO 6.0 software for structure design and virtual simulation display, the dynamic fabric and static two-dimensional structure design combined. In addition, there are pockets sewn on the back of the clothing to hold integrated circuits and reflective strips sewn on the extremities of the clothing. The sensor is precisely installed in the middle pocket on the back and fixed as shown in Figure 6 (at the marked position c). Choosing this position has two advantages. Firstly, the deformation of the middle part of the back during movement is relatively small, which can reduce measurement errors and avoid frequent bending of the limbs causing compression and pulling on the sensor, thereby extending its service life. Secondly, it is close to organs such as the heart and lungs, enabling more accurate monitoring of physiological parameters such as heart rate and respiratory rate, timely detection of abnormal conditions in the body, and helping to obtain posture information to determine whether the dog is standing, lying down, or walking . The structure of the clothing block is shown in Figure 6. The clothing pattern block is shown in Figure 7.

Style structure: Left (dorsal structure), Right (ventral structure), a. coat; b. lining; c. pocket; d. reflective strip.

Pattern blocks.
The garment features a neat blue-purple coloration with reflective strips on the front and back leg surfaces to ensure high visibility. For practical functionality, a button fastening system is implemented instead of a zipper to allow for easy donning, doffing, and storage, thereby preventing hair from being caught. The virtual simulation, depicting three-view and multi-color renderings of the final prototype, is shown in Figure 8.

Three views of virtual simulation of smart dog clothing.
Results and evaluation
Accuracy testing
In order to verify that the data obtained from the signal acquisition module in the set of emotion feedback system can be applied to the fitting model constructed by Python clustering algorithm, the difference between the emotion judged by the system and Method I (dog tail wagging and staying emotion judgment method), and Method II (professionals’ assessment and owner-assisted judgment method).
In this experiment, two types of clothing combining dark blue and orange-gray colors were made. Before the experiment, two pet dogs that met the conditions were selected to try on the sample clothes, as shown in Figure 9.

Sample clothing fitting pictures: left (dark blue with orange) right (orange and gray combination).
In contrast, the subjects’ preference for dark blue sample clothing was significantly higher than that for orange and gray color combinations. Moreover, according to the research by Tanaka et al. through operant conditioning training, it has been confirmed that pet dogs have a significantly stronger ability to distinguish between blue and gray than between red and gray, and a comparable ability to distinguish between green and gray, reflecting the relativity of their color vision. 28 Choosing dark blue is a color perceived favorably by animals and falls within their visual spectrum.
Six randomly recruited medium-sized, short-haired, adult pet dogs that are willing to cooperate and have good cooperation were tried on for testing to simulate a variety of environments in life and to obtain their emotional data. To ensure the universality of the clothing function, the pet dogs were of different genders, species, personalities, ages, and sizes. The average number of tests per subject was 12 (the real-time monitoring results were recorded every 10 min, and the experiment time was from 08:00 to 10:00), and a total of 72 valid data were obtained. A total of 14 exciting emotions, 9 angry emotions, 29 calm emotions, and 20 pleased emotions were measured by the emotional feedback clothing. The real-time monitoring data of an experimental object is given as an example, as shown in Figure 10.

Real-time monitoring effect diagram of a monitoring object (time sequence from left to right).
We can visually see the changes of various physiological indicators and draw conclusions, the pet’s respiratory rate is relatively gentle during the experiment, while the changes of body surface temperature and heart rate fluctuate greatly, to reflect relatively obvious emotional changes.
Then, the measured results were compared with Method I and Method II respectively, as shown in Table 8. Where, the correct rate of comparison = 1 − number of differences/total number of corresponding emotional samples.
Correct rate under emotional comparison.

The results show that the correct rate of the emotional feedback comparison of the clothing is more than 76.0%, that is, the emotion recognition algorithm model can be applied to the daily emotional feedback of pet dogs, and the recognition ability is good.
Quantitative data analysis
Although there are more classifiers used for emotional state recognition and the recognition effect is better, there are still some drawbacks, such as: the K-nearest neighbor mean clustering classifier has a large amount of computation, which is not applicable to the classification of the sample imbalance; Bayesian network classifiers need to know in advance the a priori probability of the artificial neural network classifiers, which require a large number of parameters in the classification and the learning time is too long, and it may not be able to achieve the learning purpose; the support vector machine classifiers are more sensitive to the missing data and are highly dependent on the size of the samples. C5.0 Decision Tree Algorithm is improved from “C4.5 Algorithm,” which splits the sample data according to the field that provides the maximum information gain, crops or merges the leaves of the decision tree to improve the classification accuracy, and finally determines the optimal threshold value for each leaf.
Suppose D is a sample set, and the proportion of the Nth classification is Ni, then the information entropy of D is defined as

We used the Decision Tree C5.0 algorithm, by calculating the data of body surface temperature, heart rate, and respiratory rate, transformations, the threshold of the generated decision tree can be the threshold when the best prediction performance is achieved. Set the training partition size to 50%, the test partition size to 50%, and the pruning severity to 75.
As can be seen from Figure 11, the most important feature is body surface temperature, followed by respiratory rate and heart rate.

Importance of predictor variables.
The obtained valid sample data were imported and the generated decision tree is shown in Figure 12. Firstly, they were classified according to the body surface temperature at 28.4°C. When the body surface temperature was less than or equal to 28.4°C, they could be classified as calm (56.9%) and pleased (43.1%), and then classified according to the heart rate at 94 bpm. Since the heart rate less than or equal to 94 bpm was classified as calm (92.7%) and pleased, the data were partially mixed, so the four emotions were accurately classified according to the 26 times of respiratory rate. With the same calculation method, another part of classification and prediction can be made.

Decision tree of C5.0 algorithm.
After the C5.0 algorithm mentioned above, in the early stage, we judged the correct rate according to the two categories of the partition (1267 data in one category and 1420 data in another category), the accuracy rates of the two regions are 100% and 99.4% respectively, which have reached or almost approached 100%, so we believe that the algorithm is highly correct and has strong adaptability. The decision tree demonstrates a clear, theoretically grounded, and interpretable classification of the four emotions, thus substantiating the robustness and reliability of our findings.
Wearing comfort test
Taking into account the large amount of pet dog activity, the number of limbs friction, the degree of physical change, and so on, the pressure and binding force cause the pet dog wearing comfort problems.
To this end, a subjective evaluation survey of dress was conducted using a five-point Likert scale, in which 36 dogs were called to try on the product for at least 30 min, and were assisted by the owners of the experimental subjects in evaluating (the ranking order is: 1-none, 2-light, 3-moderate, 4-stronger, and 5-stronger), and the main questions are shown in Table 9. Prior to the evaluation, the subject owner was trained in explaining the relevant terms and classifying the grades to try to circumvent the influence of their psychological and physiological factors on the evaluation.
Questionnaire.

The results of the ratings were organized, and averages were calculated, as shown in Figure 13.

Evaluation score.
As can be seen from the subjective evaluation results, the average score of question 1 was more than 4 points, indicating that the tested dogs had a higher overall comfort level when wearing the product. In addition, in questions 2–7 (except for question 4), all of them were more than 3 points, indicating that the tested dogs did not have obvious discomfort in touch and perception during the wearing process.
In summary, the subjective evaluation experiments concluded that the developed smart pet dog clothing has good contact and viewing comfort.
Sustainability evaluation
This experiment adopts detachable modular design with low cost. It has low energy consumption, light weight, good concealment, and strong durability. The combination of integrated circuit and APP expands the application of smart clothing and realizes the miniaturization and flexibility of intelligent monitoring clothing products. The application of 3D virtual assembly technology shortens the development time of intelligent clothing, improves the development efficiency, reduces the number of productions of physical samples, and can quickly and intuitively display the effect of clothing design. The whole design process time is short, economical and convenient.
In addition, the use of recyclable, easy-to-clean fabrics improves the environmental and practical performance of smart clothing, while cheap pure cotton materials also effectively reduce the overall cost of clothing, in line with sustainable design concepts.
Discussion
As the population increases and urbanization accelerates, the environmental problems associated with pet ownership are becoming more prominent. By monitoring the health status and activity level of pets, pet smart clothing can help owners manage their pets’ breeding environment and living habits, thereby reducing the negative impact on the environment.
This research has initially completed the physical and software design of the real system, using the algorithm that each transmitter wants to adapt, can accurately detect each biosignal of the pet dog and convert it into effective data. The predicted data of each pet dog can be transmitted to the cloud, and the user information can be organized by the system, which enhances the usability of the system. Through the clustering analysis of temperature, heart rate, respiratory rate, and other factors to obtain mapping relationships with the emotions of pet dogs, so that the sensors interact with the cell phone APP, to realize the combination of clothing, hardware and software.
Clothing functionality test results show that there is no significant difference between the three groups of data, that is, the emotional model can be applied to the daily emotional feedback of the pet dog, and the recognition ability is better, can accurately analyze the emotional changes of the pet dog in different physiological situations, and the feedback correctness rate is generally greater than 75.0%, which basically meets the target pets and their evils of the smart life needs.
Comfort test results show that the subject dog wearing the clothing products did not appear touch and view of the obvious discomfort, can meet the requirements of the pet dog wearing comfort. However, due to the fact that the dimensions of the test are limited to temperature, respiratory rate and heart rate, and that the number of subjects and the scope and extent of experimental data collection are limited, the construction of a systematic, universal and accurate model for pet dogs requires comprehensive, multi-dimensional, powerful and long-time research and discussion.
Conclusions
Based on the Arduino development environment, through various types of sensors and ESP 8266 microcontroller to obtain and process the real-time physiological information of the pet dog, and these biological information and large-scale sample aggregation model is fitted to derive the threshold value, and innovatively designed a kind of smart pet dog clothing with the ability of emotional feedback. Through data collection, visualization and analysis, this smart clothing can digitally express the pet’s physiological data, making the “quantified self” technology further applicable to practical applications, and can even be used as a mood recognition aid in other industries. In the future, research can be carried out to optimize the use of clustering model and refine the reference of each physiological index.
Meanwhile, 3D virtual fitting technology shortens the development time of clothing, improves the development efficiency, can effectively reduce the number of physical sample production, improve the accuracy of pattern block thus saving from the design and development to the landing of the production process of manpower, financial resources, material resources invested.
By monitoring pets’ health and activity levels, smart pet clothing can help owners manage their pets’ emotional state and living habits, thereby reducing negative impacts on the people and environment. Monitoring pets’ emotional state will lead to a healthier environment for both pets and humans, which in turn can promote responsible pet ownership, thereby reducing the number of abandoned pets and the associated negative social impacts. Overall, the development of smart pet clothing has significant social and environmental impacts that cannot be ignored.
This study verified the feasibility of the intelligent monitoring and emotion recognition pet dog clothing. However, there are several limitations to the work, specifically as follows: The size of this dataset is relatively limited, and it mainly focuses on short-haired medium-sized dogs in Wuhan. This may limit the generalization ability of the model in more extensive scenarios. This study mainly focused on objective emotional data and subjective emotion recognition confirmation (by the owner). The proportion of subjective recognition was high.
Given current limitations, future research will expand in three aspects: first, enlarge and diversify the dataset with data on different breeds, environments and granular labels to enhance the model’s credibility and universality; second, introduce video annotations by animal behaviorists, standardized scales and multi-sensors to build a multimodal emotion recognition model, reducing subjective reliance via sensor fusion for accurate and automated emotional interpretation; third, compare with existing pet wearables to verify the performance and recognition accuracy advantages of the intelligent monitoring clothing.
Footnotes
Acknowledgements
Thanks for the support of Wuhan Clothing Digital Engineering Technology Research Center and the Sunshine Scholar Program of Wuhan Textile University.
Consent to participate
Informed consent was obtained from all subjects (owners) involved in the study.
Consent for publication
Written informed consent has been obtained from the subjects (owners) to publish this paper.
Funding
The authors disclosed receipt of the following financial support for the research, authorship, and/or publication of this article: This work was supported by the Humanities and Social Sciences Fund of Ministry of Education of China (Grant Number 24YJC760018, 24YJCZH343); Philosophy and Social Sciences Research Projects of Hubei Provincial Department of Education (Grant Number 24Q177); WTU’s Science and Technology Innovation Project (Grant Number 2025068); WTU’s Teaching and Research Projects (Grant Number 2024JYB027, 2024JYB037); 2023 Open Research Project of the Ministry of Education’s National Excellent Traditional Culture Inheritance Base (Han Embroidery) (Grant Number HXJD2023A06).
Declaration of conflicting interests
The authors declared no potential conflicts of interest with respect to the research, authorship, and/or publication of this article.