
Abstract
The main goals of this research are to identify the significant input parameters using supervised machine learning methods and investigate the relationship between the process, structure, and properties of components created using fused deposition modeling utilizing nylon aramid composite filaments. To develop an experimental layout using Taguchi’s L18 orthogonal array, six different FDM parameters such as infill pattern, infill density, layer thickness, component orientation, print temperature, and raster angle have been taken into consideration.Using an Ultimaker FDM printer, rectangular samples were created, and the values of face hardness, thickness regions, printing time, and component weight were assessed. ANOVA and the signal to noise ratio method are two techniques that have been used to find the significant influencing parameter and the ideal combination of parameters. When comparing thickly layered samples with a suitable increase in time and weight, thin-layered samples are shown to have greater hardness values at both tested areas. With a 50.09% contribution to face hardness and a 30.11% contribution to hardness at the thickness area, raster angle is found to be significant over hardness.Layer thickness is an important element that contributes 81.95% to printing time and 42.09% to part weight, respectively. In an 80:20 train-test split, the decision tree approach outperformed the k-nearest neighbor algorithm for all four output responses, with classification accuracy ranging from 83.33% to 100%. Infill density is recommended by the decision tree method to be extremely significant over face hardness and component weight, and layer thickness is similarly recommended to be highly significant over printing time and hardness at the thickness region. The presence of surface pores, interior voids, and layer abnormalities is confirmed by FESEM images.
Keywords
Introduction
Additive manufacturing (AM) or 3D printing can be defined as any process which creates parts from CAD file by adding layers one over another with fascinating benefits such as less waste,zero tooling and instant response to any shape formation. One such material extrusion technique is fused deposition modeling (FDM), which uses thin wire or filament extruded through a heated nozzle to deposit layers of material on top of one another to build the final component.FDM process is continuously expanding its material library due to its potential in creating parts at low cost and less complexity. ABS and PLA are the most widely adopted materials used in FDM process due to their flexibility to undergo the process at low operating conditions. As the process creates parts through layer addition final parts are having inferior mechanical properties, low surface finish, and anisotropic nature and also needs post processing when parameter optimization is overlooked or erroneous parameter combination is considered .Kenan Muhamedagic et al. 1 studied the effect of FDM parameters such as layer thickness, printing speed, raster angle and wall thickness over tensile strength by applying RSM, ANOVA, and ANN methods. The authors have reported that layer thickness is more significant and higher layer thickness value leads to air gap which reduces tensile strength of short carbon fiber reinforced polyamide parts. D’Addona 2 performed multi objective optimization of FDM process parameters layer thickness,speed and infill density using PLA material by adopting Taguchi’s orthogonal array and desirability function to obtain optimum process settings for minimizing filament length, printing time and part weight. The authors have concluded that agreement between the predicted values and confirmation experimental values are good. Ajay Kumar et al. 3 investigated the effect of FDM process parameters over tensile strength, flexural strength and hardness through Taguchi’s L9 orthogonal array for carbon fiber reinforced PETG filament. The authors have concluded that both print speed and infill density have shown significant effect over tensile strength and hardness. The regression equations developed can be used for predicting the output responses at 95% confidence interval. The effect of hot vapor smoothing process over surface hardness of ABS parts have been carried out by Singh et al. 4 Three different shapes such as cube, cylinder and hemisphere have been printed through FDM by varying parameters two other parameters such as density and acetone exposure time as per Taguchi’s L9 orthogonal array. The authors have reported hot vapor smoothing process has improved the surface hardness from 6.09% to 10.55% due to the filling of staircase gap by reflowing material. The combined study on density, micro hardness, surface roughness and processing time for ABS material has been considered by Raj Mohan et al. 5 Fifteen different set of experiments have been designed through Box Behnken Design (BBD) and the authors have reported that an increase in bed temperature have increased the micro hardness in a considerable manner. Trivdedi et al. 6 evaluated shore D hardness of barrel finished FDM patterns and layer density is found to have 67.52% of significant contribution toward surface hardness of master patterns. Zhiani Hervan et al. 7 printed PLA samples through FDM printing and observbed the changes in hardness, friction and wear characteristics.The hardness of samples in H-shape was higher in comparison with V-shaped samples and also an increase in layer thickness has shown higher hardness values. Moradi et al. 8 varied layer thickness, part density and number of contours to minimize build time and failure load as objective functions. The increase in number of contours have enhanced both failure load and production time as confirmed through ANOVA. The performance assessment of shape memory PLA-TPU composites have been performed by Davood et al. 9 through response surface methodology. Infill density and nozzle diameter are found to have significant and insignificant effects over the shape memory properties respectively. Karimi et al. 10 provided an extensive review about the different mechanisms involved in fabricating continuous fiber reinforced composites through FDM. In situ fusion and ex situ prepeg were the two major mechanism focused in detail and it also serves as a knowledge base for researchers in FDM printing. Hu et al. 11 conducted experiments to understand damage to carbon fiber while processing through FDM process using polyamide reinforced with continuous carbon fibers. The carbon fibers average strength, tensile, and compressive strength got reduced by −33%, −60%, and −25% after undergoing FDM process. Peng et al. 12 investigated process parameters such as raster direction,build plate temperature to evaluate the changes in fracture behavior, energy absorption capacity and rebound behavior for polyamide with carbon fiber reinforced filaments. The material has exhibited good performance at higher build temperature and filaments laid in the direction of tensile loading. Zhang et al. 13 detailed about the importance of incorporating reinforcements in various forms such as fibers, nanomaterials with pure polyamide filament to expand the application of polyamide filaments in making industrial parts. The authors have concluded the study by highlighting the importance, limitations, challenges, and opportunities in fiber reinforced polyamide FDM filaments. Wickramasinghe et al. 14 exclusively reviewed about the mechanical properties, defects and necessary treatment for improving the properties of pure filaments and fiber reinforced filaments made from ABS,PLA and nylon. Various affecting factors are raster direction, strength of thermoplastic filament, bonding between layers, post treatments of printer parts such as chemical, laser, heat, and ultrasound. According to Verdejo de Toro et al. 15 compared the mechanical properties of 3D printed samples of PA6 with injection molded samples. The authors have reported that tensile strength of 3Dprinted samples are 21% inferior than injection molded samples and in case of compression strength only 4% improvement is achieved in 3D printed parts, stiffness is found to be higher in case of 3D printed parts. The authors have highlighted the selection of filling pattern plays a dominant role in final properties and unidirectional pattern is found to be better when lower densities are preferred. Calignano et al. 16 executed experiments using PA612 filament composing chopper carbon fibers of 20% to figure out the influencing FDM parameter and found building direction, infill percentage are influencing over hardness,tensile strength. Nagendra and Prasad 17 optimized FDM process parameters such as layer thickness, print temperature, infill part density, raster angle, and infill pattern for nylon aramid composites using Taguchi’s orthogonal array to evaluate tensile, compressive, impact, and flexural strength. The regression equations developed predicted the mechanical properties with less error. Miguel et al. 18 assessed the failure of nylon parts created using FDM process by coating them with polymers such as polyurethane elastomer and silicone. The coating applied over nylon parts reduces the water absorption tendency but decreases the mechanical properties and makes them suitable for non load bearing applications. As per the findings of Lay et al. 19 the mechanical properties such as tensile strength, young’s modulus, elongation at break and impact strength of FDM samples are 48%, 50%, 48%, and 78% lower than injection molded samples for materials ABS, PLA, and nylon 6. Feng et al. 20 produced PA12 filaments by recycling PA12 powder used in SLS process and reported that properties such as melt flow rate, tensile strength, flexural modulus, impact strength are lower for recycled PA12 filament in comparison with fresh PA12 filaments. Gao et al. 21 used PA10 and PA12 filaments to determine their mechanical properties and dimensional accuracy. The authors have identified that bed temperature and nozzle temperature together influences the print quality and mechanical property. Moderate nozzle temperature is suitable for excellent tensile strength and bed temperature above glass transition temperature exhibits good ductility. Ramesh and Panneerselvam 22 adopted Taguchi’s orthogonal array for optimizing FDM parameters for mechanical properties such as Ultimate Tensile Strength (UTS), impact strength, flexural strength and shore D hardness using fill density, layer height and print speed as inputs varying in three levels. The experimental data has been analyzed using ANOVA and infill density is the most dominant factor over all responses studied. Barrios and Romero 23 measured surface roughness of PET-G samples prepared using FDM and predicted using decision tree algorithms such as random tree, random forest, and C4.5. Random tree algorithm ranked top in predicting the surface roughness with high kappa statistic value than other algorithms.
The review of the literature on FDM confirms that polyamide filaments with fiber reinforcement are being used increasingly in current studies. The primary drawback identified from the previous study is the selection of fewer input for optimization, such as three or four, from a set of approximately 15+ different FDM input parameters. The current study involves considering six different input parameters such as infill pattern, infill density, layer thickness, part orientation, printing temperature, raster angle for parameter optimization. The main objective of the work is to identify the significant parameter influencing hardness at face (Hf) and thickness (Ht) regions, printing time (PT), and part weight (PW) for nylon filaments reinforced with 8% short cut para aramid fibers. In addition to that, optimum parameter settings for individual output parameter through main effect plot and supervised machine learning techniques such as decision tree algorithm and k-nearest neighbor has been identified. ANOVA has been applied for identifying the influencing parameter over the output responses. Finally surface and structural morphology of the samples have been studied using FESEM. Figure 1 shows the methodology considered in the current research.
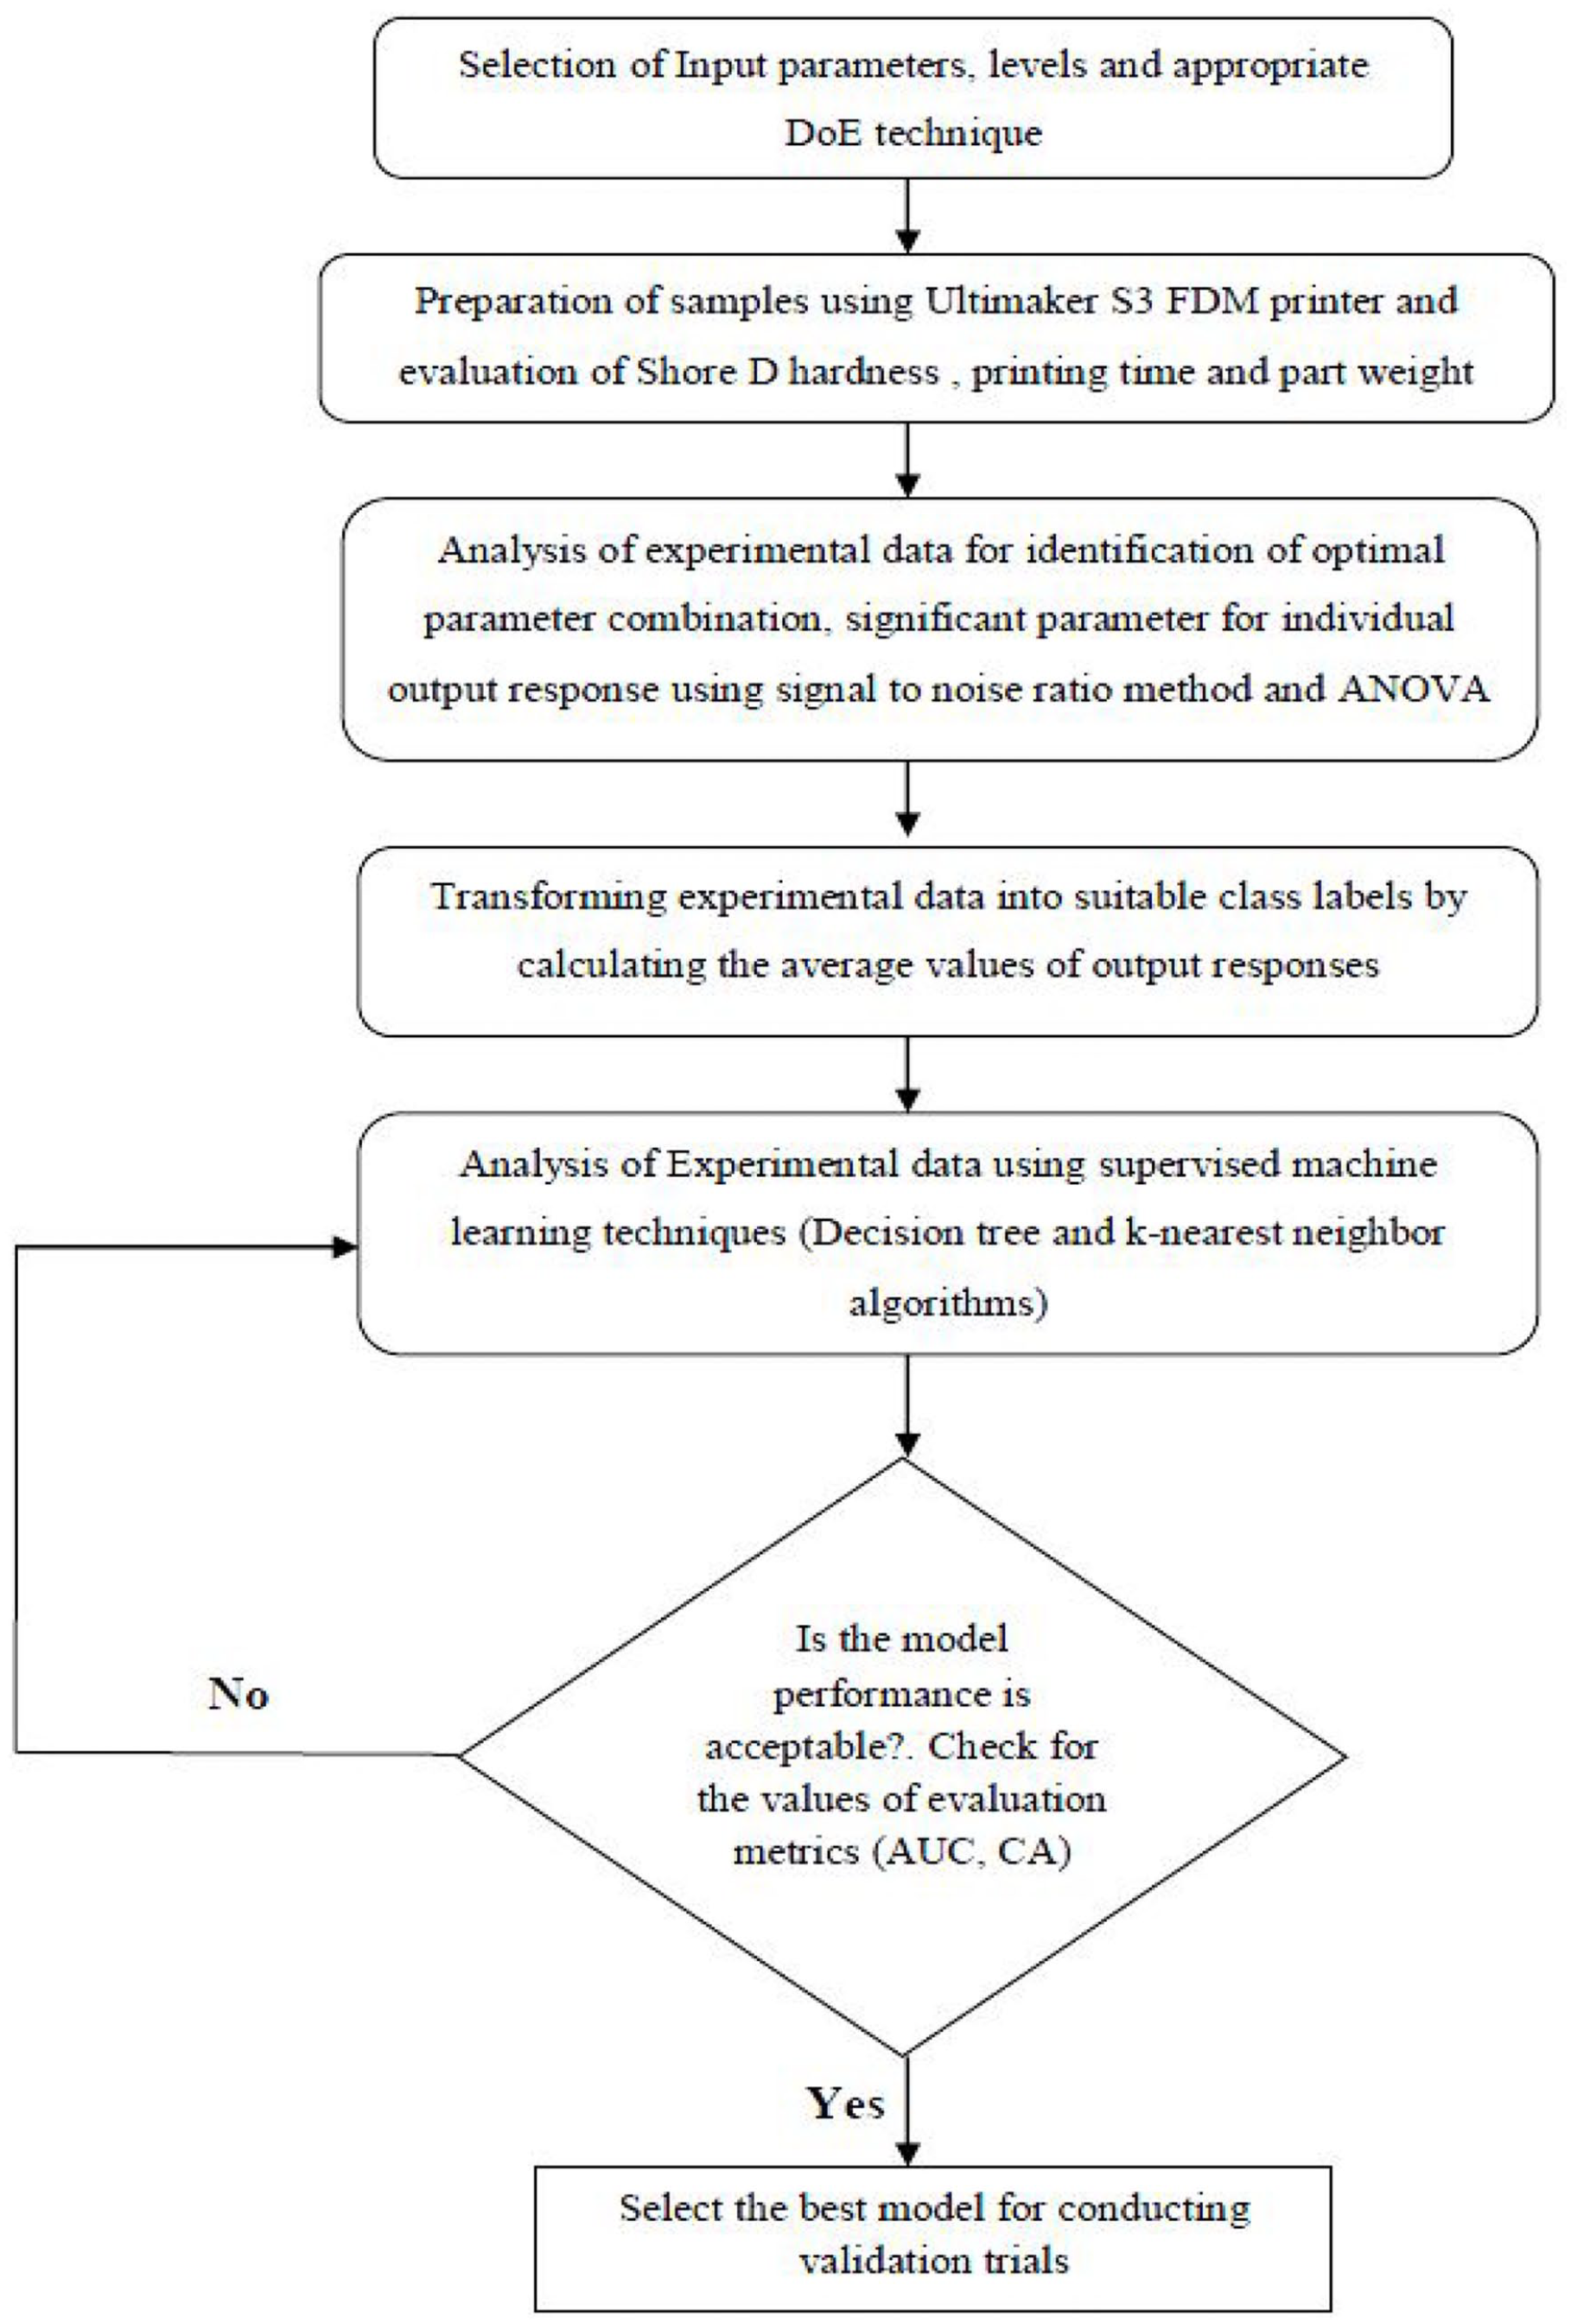
Research workflow.
Materials and methods
The current section details about the material used in the present study and method for preparing samples for further evaluation of targeted output parameters.
Polyamide aramid composite filament
The 1.75 mm-diameter NylonAF80 filament material (Manufacturer: Filamentum Industrial, Czech republic) was taken into consideration for sample preparation in this investigation. PA12 serves as the matrix material for the filament material, and 8% of it is reinforced with short cut aramid fibers. The material is used in the manufacture of electrical and electronic equipment housings, reinforcement parts, gears, and bearings. The material’s density is 0.99 g/cm3, and its tensile and impact strengths are 50.4 MPa and 53.2 kJ/m2, respectively.
Fractional factorial design
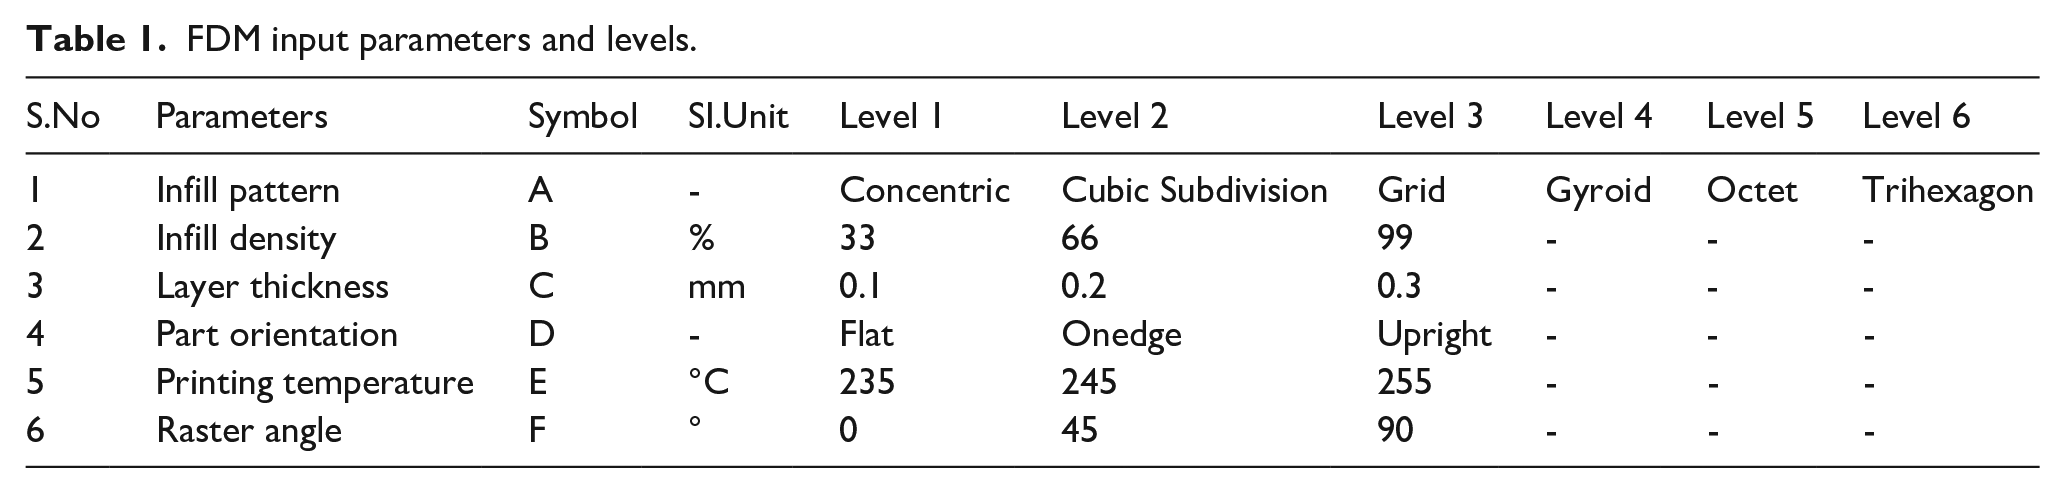
The current study considers mixed level fractional factorial design by varying six different input parameters namely infill pattern, infill density, layer thickness, part orientation, printing temperature, raster angle as shown in Table 1. The current study varies infill pattern with six levels and all other five parameters with three levels. For the selected parameters and levels, a total of 1458 experimental trials need to be conducted, but due to the flexibility of designed experiments, only 18 experimental trials have been obtained using Minitab 17.0 software for assessment of output responses. The 18 different trials formed as per Taguchi’s orthogonal array adopting fractional factorial design consists varying combination of factorial levels without any repetition in experiments. The parameter infill pattern varied in six levels has direct combination with all other parameters varied in three levels.24–26 As the study has included machine learning techniques for identifying the optimal parameter combinations for managing the output response, the selected 18 different experimental trials would serve as a base for carrying out predictions toward the 1458 combinations of input factors. Table 2 has exhibited the ultimaker S3 machine specifications.
FDM input parameters and levels.
Ultimaker S3 machine specifications.
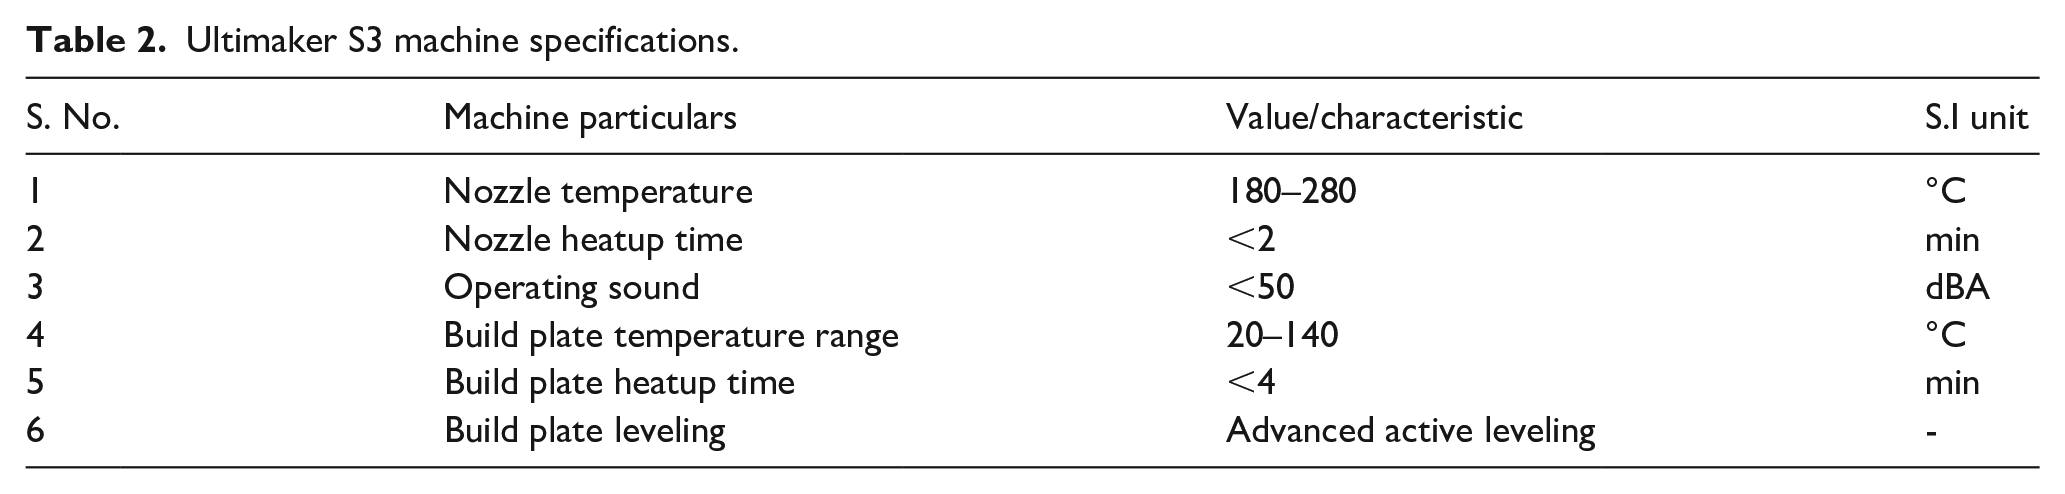
Figure 2 represents the six different infill patterns used in preparing experimental samples.
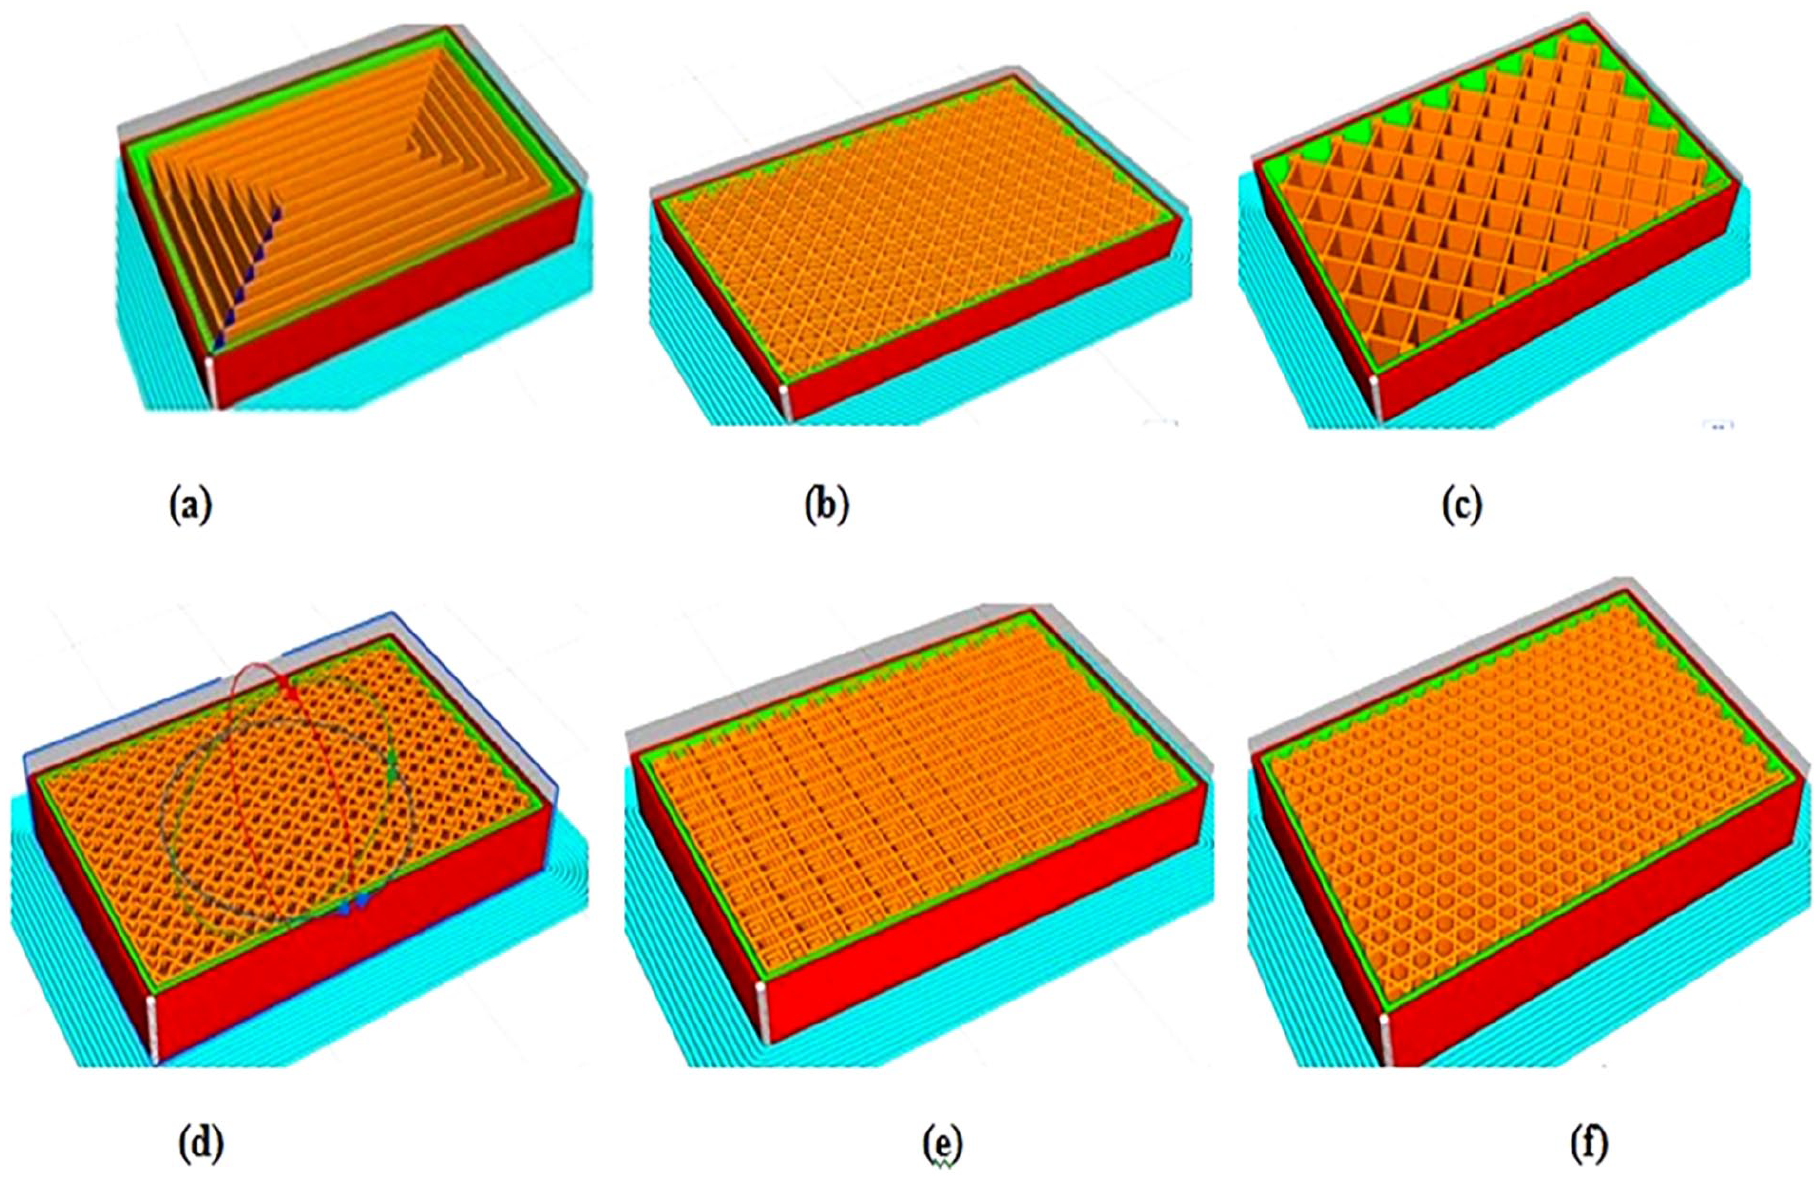
Infill patterns: (a) concentric, (b) cubic subdivision, (c) grid, (d) gyroid, (e) octet, and (f) trihexagon.
FDM parameters
In total six different parameters involved in FDM has been considered in the current study.
(a) Infill pattern: It represents the structure and shape of material inside a printed part. From the selected patterns in the current study, except Grid infill pattern all other pattern falls under 3D infill.27–29 Figure 2 shows the infill patterns used in sample preparation.
(b) Infill Density: It denotes the amount of material filled inside a part, where low density requires less time and material but results with poor strength for structural applications.30–32
(c) Layer thickness: The height of individual layer deposited one over the another. Low layer thickness results with good surface finished parts with loner printing time.33–35
(d) Part orientation: The deposition strategy for printing parts with three different types namely flat, Onedge and upright positioning. The optimum selection reduces time, cost, support structure requirement and also impacts surface finish, accuracy and mechanical properties of finished part.36–38
(e) Printing temperature: The temperature at which the filament gets extruded through the deposition nozzle. The optimum temperature improves the adhesion between the deposited layers and avoids part warping.39–41
(f) Raster angle: The angle of rasters with respect to horizontal axis in a printed part.42,43 It can be 0° (axial), 45° (cross), 90° (transverse), and +45°/−45° (criss cross).
FDM printer
Industrial grade FDM printer Ultimaker S3 has been used for sample creation. The printer has a build volume of 230 mm × 190 mm × 200 mm with presence of dual extruder. The printer has good compatibility in printing plain and composite filaments of ABS, PLA, PC, Nylon, TPU, and PET-G. Hardened nickel alloy extrusion nozzle of 0.4 mm diameter has been used for sample printing. Tabe 2 represents the Ultimaker S3 machine specifications.
Specimen preparation
The specimen for measuring shore D hardness at face and thickness region of Nylon AF80 filament is prepared by taking the dimensions 25 mm × 20 mm × 6 mm (Length × Breadth × Thickness) in accordance with ASTM D2240. The specimens have been printed as per the L18 Taguchi’s orthogonal array through the concept of mixed level fractional factorial design. The specimen printing starts by creating a brim of 0.1 mm over the bed and first layer of the specimen is deposited over the brim to avoid warpage issues resulting with specimens at initial stage of printing. The flat specimens were printed by specimen surface touching the bed, on-edge specimens were printed by making the longest edge of specimen 25 mm to be in contact with print bed and upright specimens were prepared making 6 mm specimen thickness touching the bed surface.44–46 Table 3 shows the detailed experimental plan. Figure 3 shows printing of sample and printed samples are in Figure 4.
Experimental design layout L18 Taguchi’s orthogonal array.

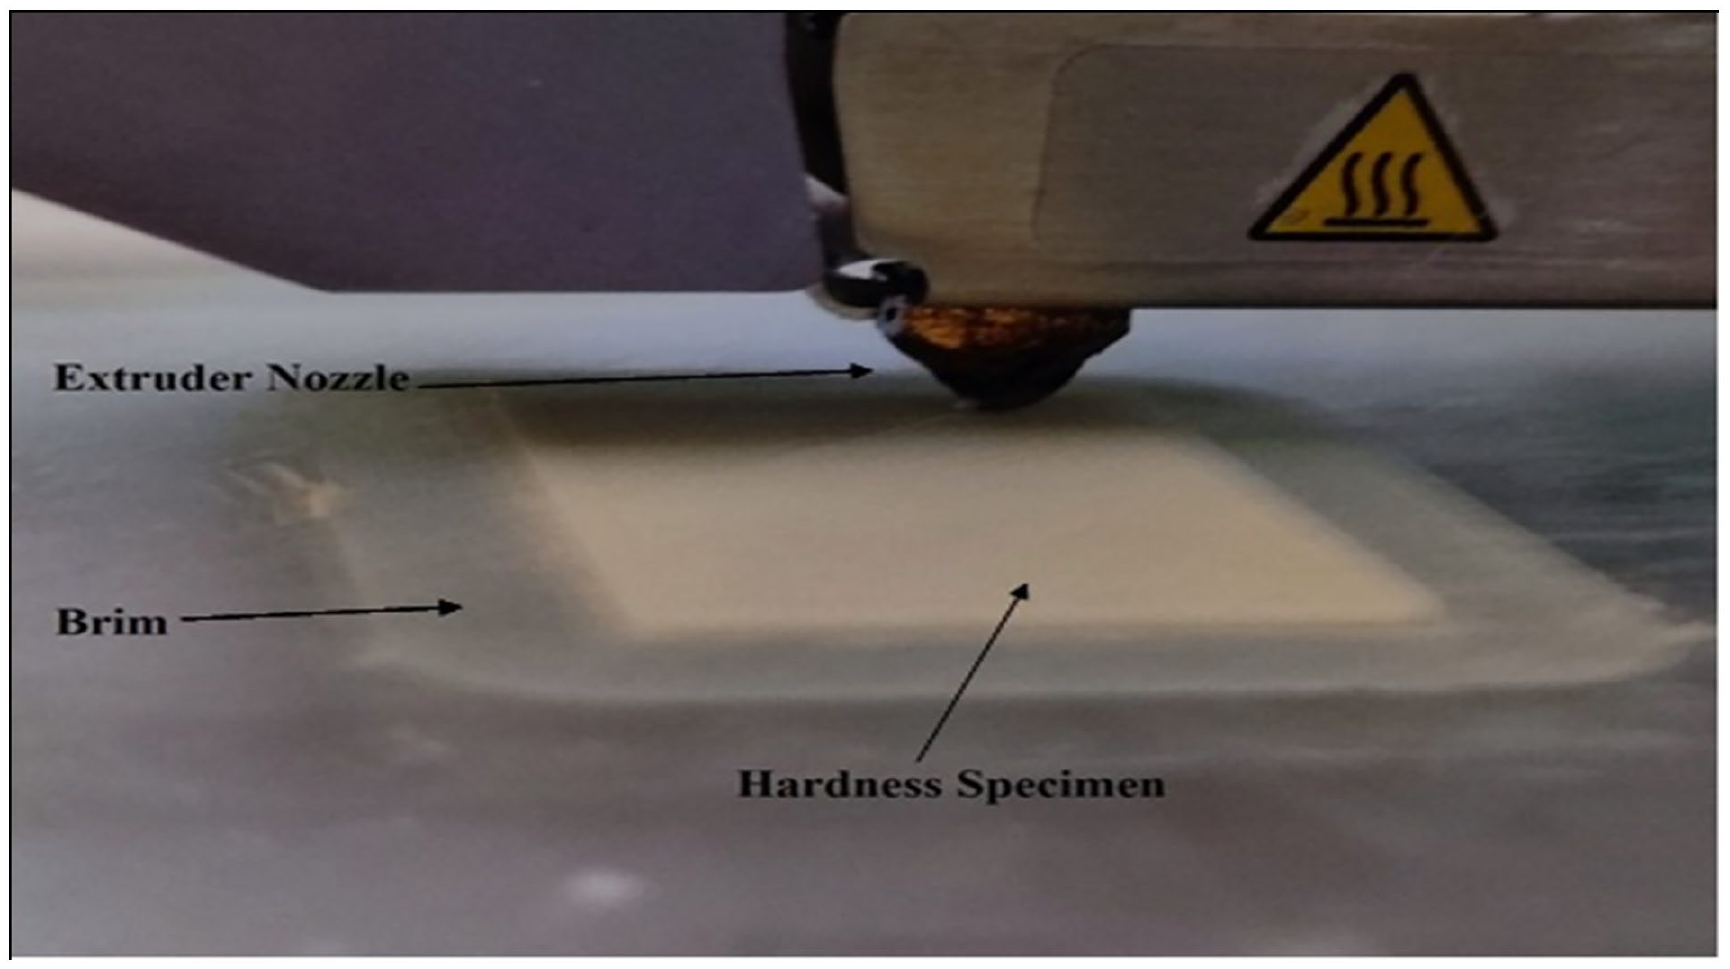
Printing of hardness specimen with brim.
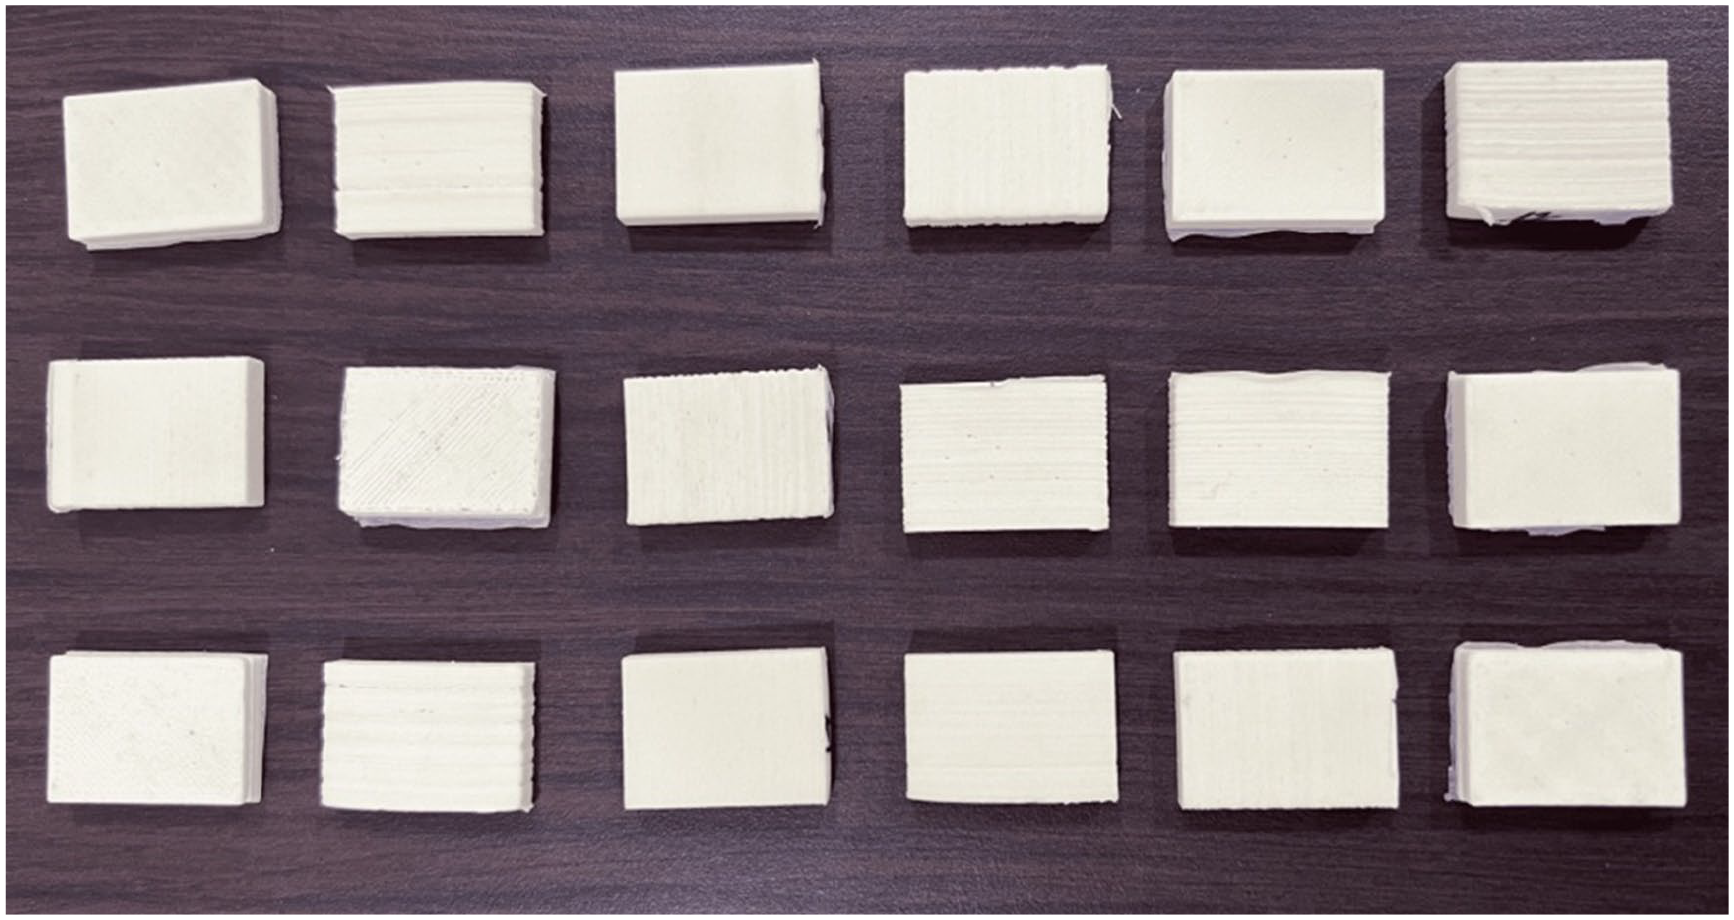
FDM printed hardness specimens.
Figure 5 shows the 2D view and 3D model of the hardness sample.Figure 6(a)–(c) shows the raster angles considered during sample making.

Hardness sample 2D view and 3D model.
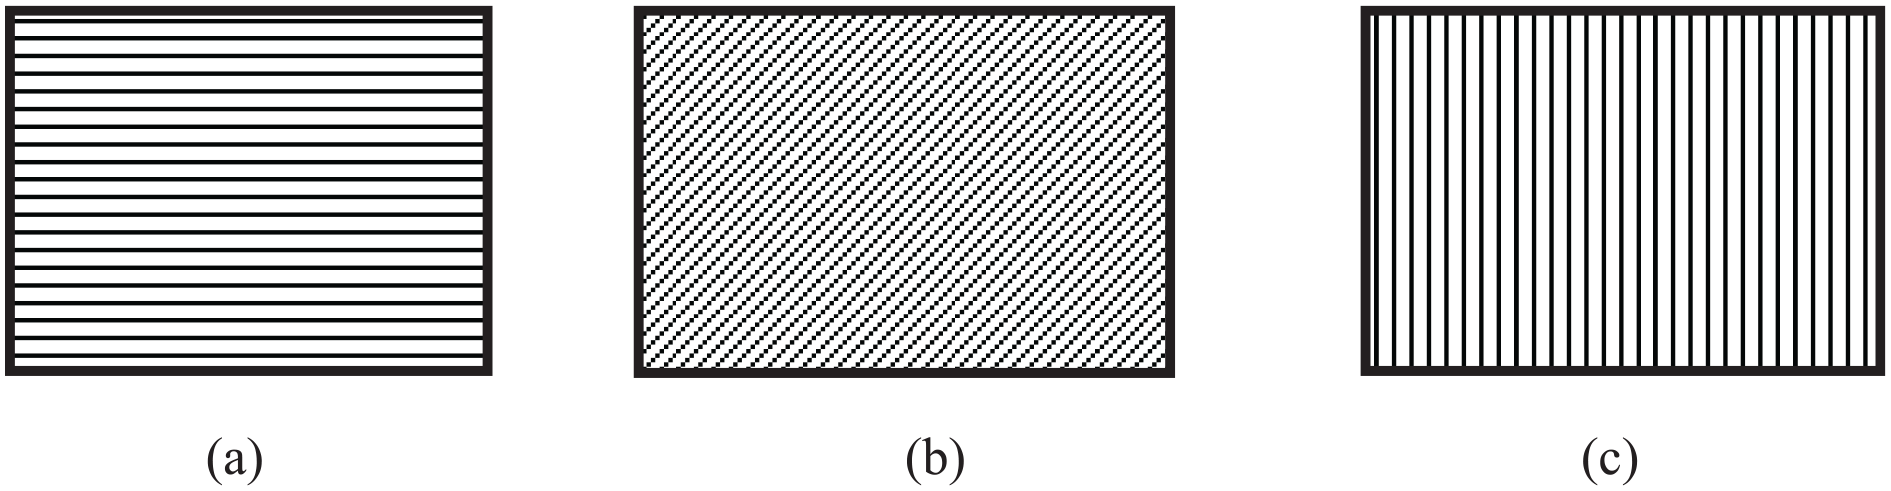
Raster angles: (a) 0°, (b) 45°, and (c) 90°.
Experimental work
The samples prepared through FDM process has been evaluated for output responses such as printing time, part weight, hardness at face and thickness regions. The printing time for the sample can be directly obtained from the digital display of ultimaker FDM printer. Based upon the changes involved in input factors, the sample printing time varies and it can be viewed in slicing software also.47–49 The prepared samples are weighed using a digital weighing machine and tabulated. The weighed samples are further measured for hardness values using a handheld durometer which measures the shore D hardness values. For each sample, three measurements at both the regions have been measured and average value has been considered for further computations. Figure 7 shows the measurement of sample hardness at both face and thickness region.

Measurement of hardness at face and thickness regions.
The measured values of hardness indicate anisotropic nature of printed parts and shore D hardness value ranged between 23 and 67 in both regions considered. In general, shore D hardness value ranging between 70 and 100 is extra hard, 40–70 is generally considered as hard, 10–30 as medium hard. From experimental values obtained it is clearly understood that the material behavior gets altered with changes in input parameter and this emphasizes parameter optimization.
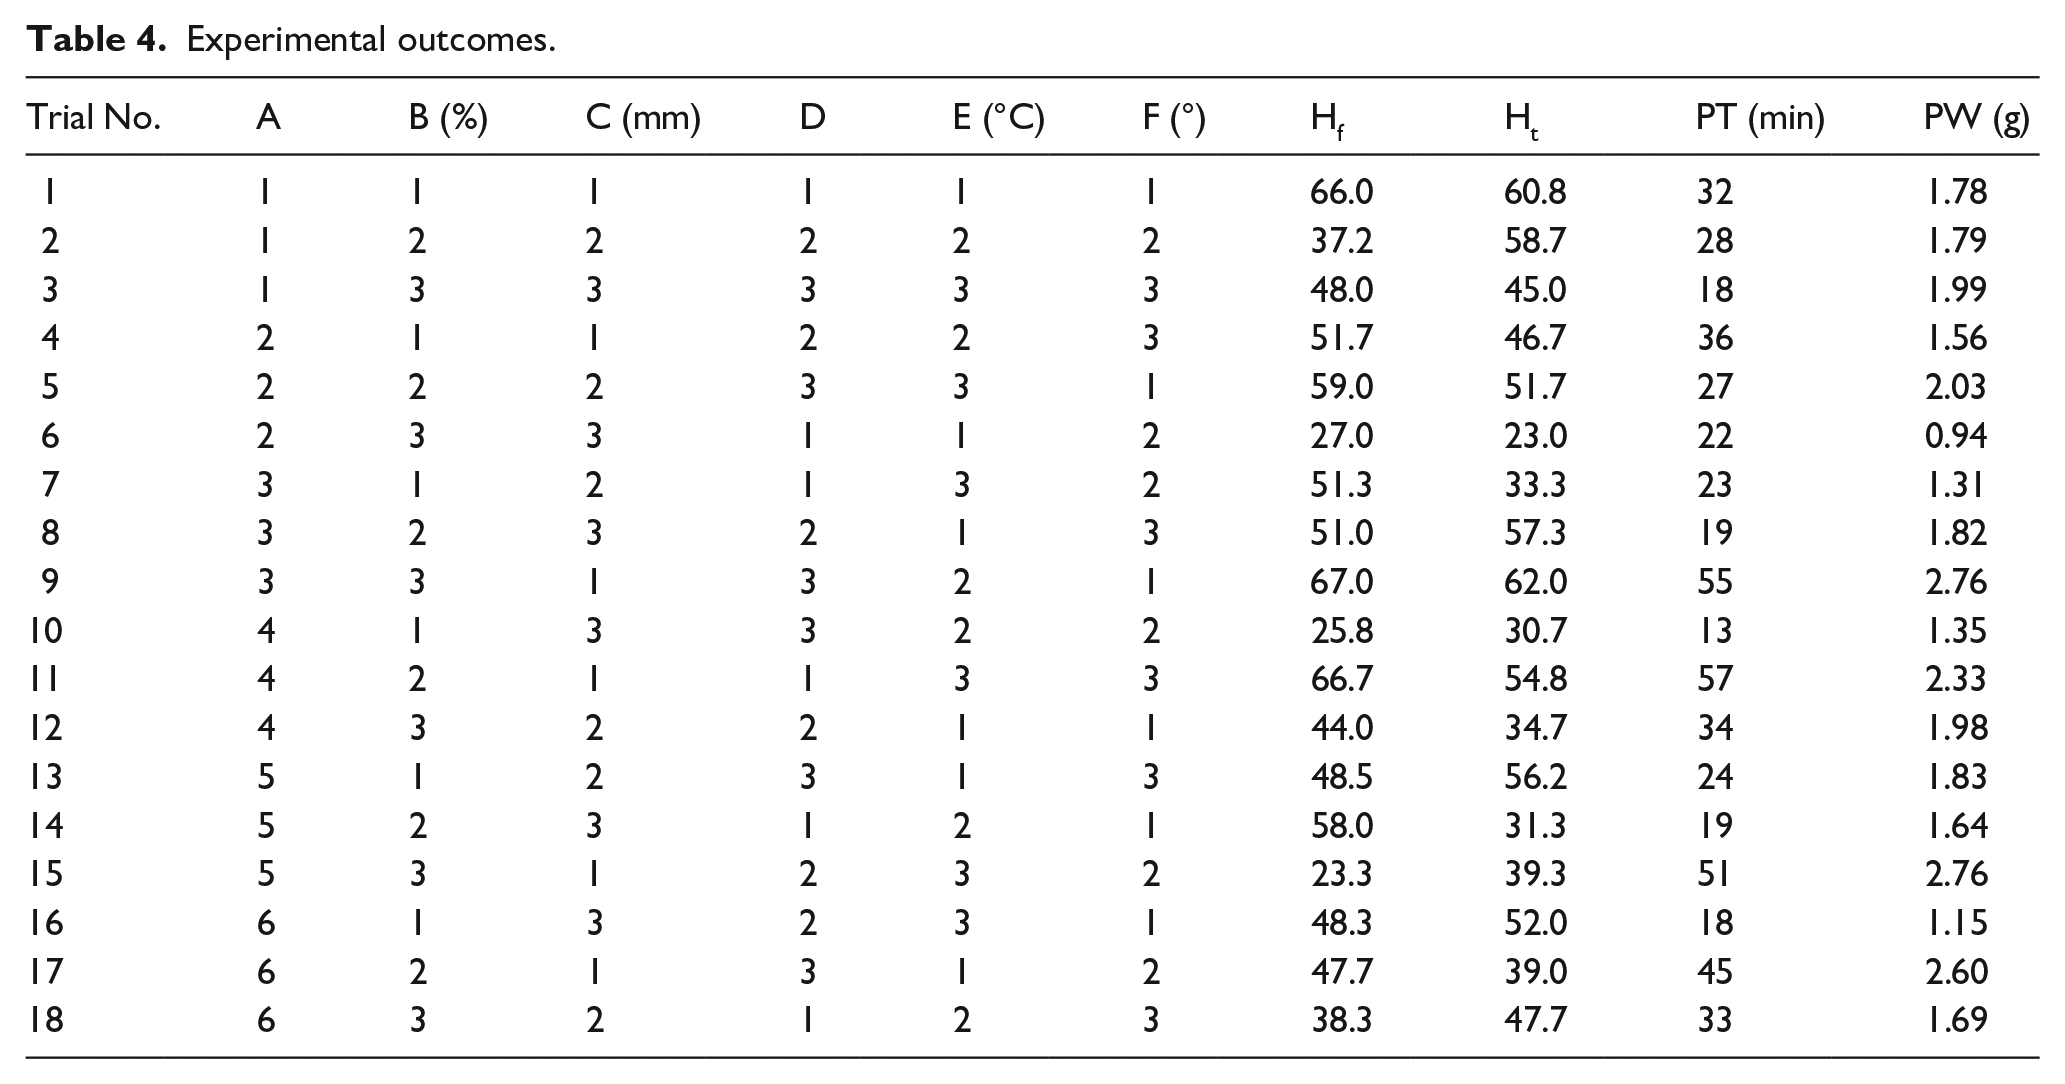
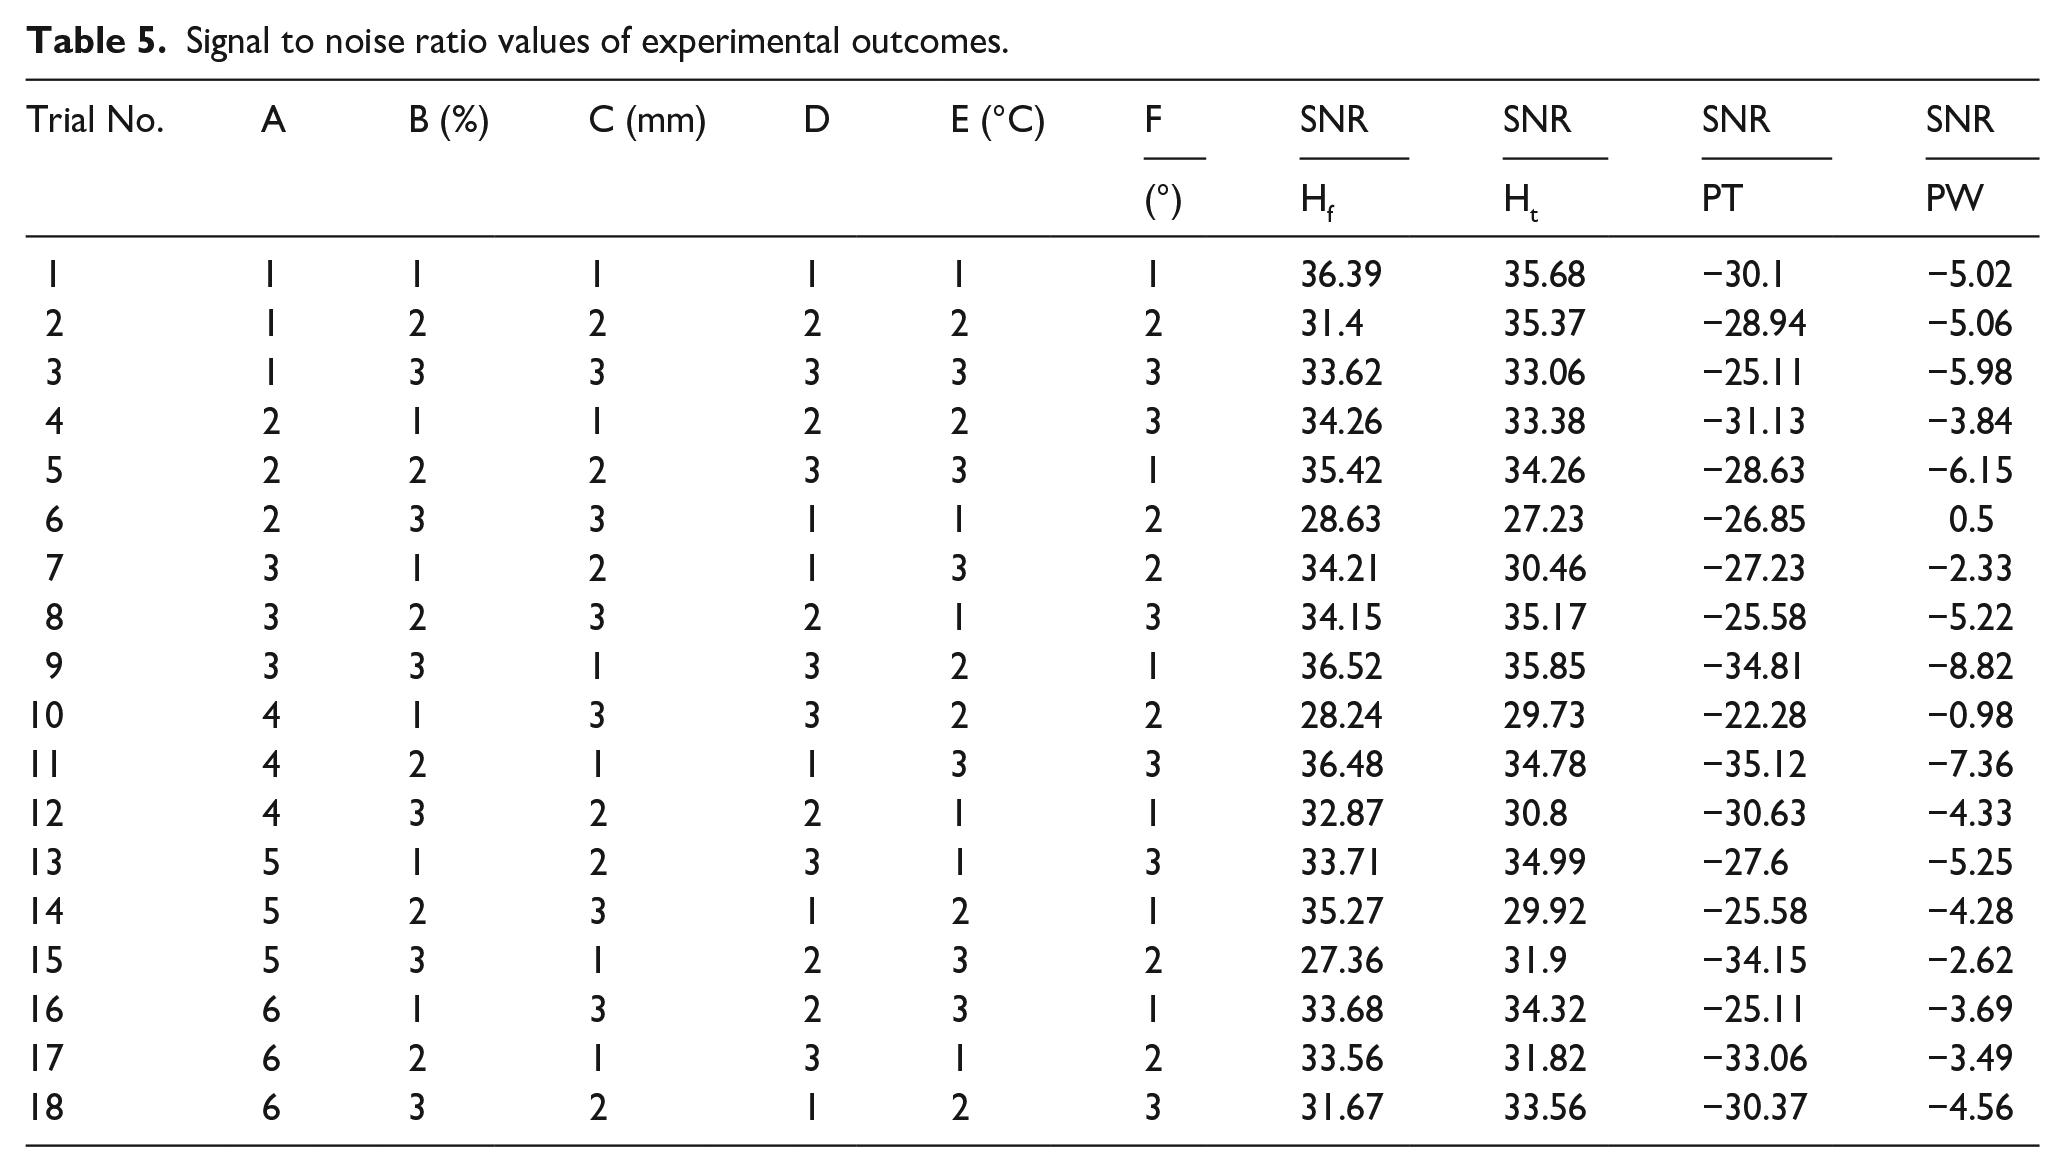
From the experimental values recorded as shown in Table 4, highest values for hardness at face and thickness region have been obtained for specimens with thin layers of material with other parameters varying in their levels from low to high. Table 5 has depicted the Signal to noise ratio values of experimental outcomes. The shore D hardness value ranging above 40 represents hard material behavior. The printing time and part weight increased with increase in infill density. The lowest value for hardness at face and thickness region results from thick layered specimens with patterns such as cubic division, gyroid and octet.50–52 Shore D hardness less than 30 indicates medium hard behavior of material. Printing time and weight considerably decreases with the pattern preferred and printing orientation. Lowest printing time of 13 min is obtained for samples printed with gyroid pattern, 33% infill density, 0.3 mm layer thickness, upright orientation, 245° print temperature, and 45° raster angle. Highest printing time of 57 min resulted with gyroid pattern, 66% infill density, 0.1 mm layer thickness, flat orientation, 255° print temperature, and 90° raster angle. The change in layer thickness from 0.3 to 0.1 mm is the major cause behind the increase in printing time as more number of layers need to be deposited when layer thickness value is low.53,54 Specimen weighing 0.94 g is resulted from cubic subdivision pattern, 99% infill density, 0.3 mm layer thickness, flat orientation, 235° print temperature, and 45° raster angle. The maximum weight of specimen 2.76 g resulted from two different combinations of parameters with infill density and layer thickness remains constant. Grid pattern, 99% infill density, 0.1 mm layer thickness, upright orientation, 245° print temperature, 0° raster angle and Octet pattern, 99% infill density, 0.1 mm layer thickness, onedge orientation, 255° print temperature, 45° raster angle. The changes in the settings have varied the hardness from hard to medium hard in the face region and in case of thickness region, material behavior remains hard but value changes from high range to low range due to changes in parameter levels.55–57
Experimental outcomes.
Signal to noise ratio values of experimental outcomes.
Results and discussion
The experimental values of output responses have been transformed into appropriate signal to noise ratio value to understand the effect of input factors and to obtain the optimum parameter combination for maximizing or minimizing the output response. Equations (1) and (2) show the formula for evaluating signal to noise ratio values for different cases. The equations (1) and (2) proposed for evaluating the signal to noise ratio can be adopted based upon the requirement. For output responses which are beneficial such as improvement in mechanical properties equation (1) should be considered and for output responses to be minimized such as cost, manufacturing time and material consumption, equation (2) can be considered. The current study considers the values of hardness at both the regions to be larger the better and smaller the better is considered for printing time and part weight.

where Y = responses for the given factor level combination and n = number of responses in the factor level combination.
Table 5 shows the signal to noise ratio values of output responses. ANOVA is an effective statistical tool for understanding significant parameter influencing and its crucial contribution. In the present work with a confidence interval of 95% for p-value less than 0.05 the model adequacy has been checked through Minitab 17.0 software. The ANOVA tool highlights the highly influencing parameter with values of p less than 0.05 or higher values of F test. The contribution percentage of individual parameter can be estimated and also the error involved.
Hardness at face region (Hf)
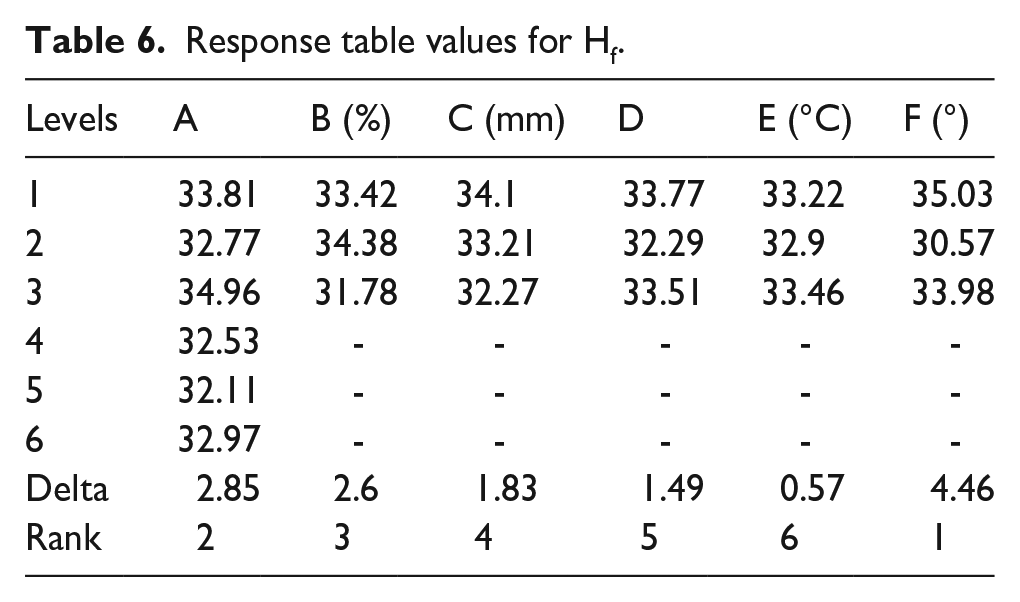
The hardness values obtained at the specimen face region has been converted to signal to noise ratio with higher the better characteristic. Response table ranks raster angle as the significant parameter followed by infill pattern, infill density, layer thickness, part orientation, and print temperature as shown in Table 6. From Figure 8 main effect plot suggests A3B2C1D1E3F1 (Grid infill pattern, 66% infill density, 0.1 mm layer thickness, flat orientation, 255°print temperature, and 0° raster angle) for improved hardness value at face region. The confirmation experiment conducted through suggested combination of parameters has resulted with 68.7 shore D hardness at face region, 53.3 shore D hardness at thickness region with 55 min of printing time and 2.55 g part weight. The 0° raster orientation is found to be better than other orientations as the layers deposited will be in direction perpendicular to the durometer plunger and provides better resistance against the force applied.58,59
Response table values for Hf.

Main effect plot for Hf.
The value of face hardness decreases when the layer become thick, this can be attributed to the non uniformity in layer width which generally increase the void area inside the sample and it leads to low hardness value. 60 On the contrary, when layer are thin, better uniformity can be attained in layers with reduced void level.
From ANOVA results described in Table 7, no factor is found to have significance over face hardness as p-value for all the factors are higher than 0.05. From F-test higher value of 6.72 is obtained for raster angle with a higher contribution of 50.09% with an error percentage of 7.45%. Results of response table and ANOVA analysis interms of top ranked parameter are in good agreement.
ANOVA results for face hardness.

Hardness at thickness region (Ht)
In similar to Hf, Hardness at thickness of specimen values from experimental data is analyzed for signal to noise ratio values with higher the better category. The main effect plot suggests A1B2C1D2E3F3 as shown in Figure 9 (concentric infill pattern, 66% infill density, 0.1 mm layer thickness,onedge orientation, 255° print temperature, and 90° raster angle). Response table values ranks top for infill pattern with follow-up of raster angle, layer thickness, part orientation, infill density and print temperature as shown in Table 8. The confirmation experiment has revealed shore D hardness of 65 at thickness region, 52.3 for Hf with 70 min of printing time, and 2.43 g of part weight. Concentric infill pattern with 90° raster angle has exhibited higher hardness at thickness region when thin layers have been deposited and as more number of layers is present the resistance is high.

Main effect plot for Ht.
Response table values for Ht.

In similar to face hardness ANOVA results, no input factor has received p-value lesser than 0.05. Higher F-Test value of 1.91 has been obtained for raster angle with 30.11% of contribution, followed by infill pattern with 21.76% and 16.65% of contribution by layer thickness. 15.78% of error results from the analysis.Results of response table and ANOVA analysis interms of top ranked parameter are in good agreement. Table 9 shows ANOVA results for hardness value at thickness region.
ANOVA results for hardness at thickness region.

FDM parts generally have anisotropic nature due to the presence of voids and gaps due to the changes in infill pattern, raster angle and orientation. From the values obtained for hardness at face and thickness region, the presence of anisotropy is evident and when layer are at low levels such as 0.1 mm, the hardness values in face and thickness region are closer to each other with minor differences at selective infill patterns such as concentric and grid at 0° raster angle. On the contrary, when layer are thicker, the hardness values are lower and their differences are in a considerable range with changes infill pattern, raster angle and part density.
Printing time (PT)
Time for printing falls under smaller the better category of signal to noise ratio. Layer thickness ranks top as per response table values subsequently followed by infill density, infill pattern, part orientation, raster angle, and print temperature which is shown in Table 10. The main effect plot recommends A1B1C3D3E2F2 as shown in Figure 10 (concentric infill pattern, 33% infill density, 0.3 mm layer thickness, upright orientation, 245° print temperature, and 45° raster angle).The recommended combination resulted specimen making in 14 min printing time, 1.15 g part weight with Hf = 27 and Ht = 24. Higher layer thickness always results with less number of layers to be deposited which drastically reduces the printing time but it will have great effect over other material properties as void content will be higher.
Response table for printing time.


Main effect plot for printing time.
ANOVA result indicates layer thickness as highly significant with p-value of 0.025 with a major contribution of 81.95% as per Table 11 and an error of 2.11% is resulted. ANOVA and response table rankings are in good agreement.
ANOVA results for printing time.

Part weight (PW)
Weight is a crucial factor in product design as it increases material consumption and cost, keeping it the desired or smaller will be better. From Figure 11, main effect plot suggests A2B1C3D1E2F2 (cubic subdivision infill pattern, 33% infill density, 0.3 mm layer thickness, flat orientation, 245° print temperature, and 45° raster angle). Layer thickness ranks top with infill pattern, infill density,part orientation, raster angle, and print temperature are subsequent followers as shown in Table 12 The specimen weight resulted 1.71 g at 24 min with Hf = 43.3 and Ht = 43.3. The parameter combination has resulted with similar hardness values at face and thickness regions but falls under the category of medium hard material in low range. Thirty-three percent infill density requires low material for filling the part and also it reduces printing time.

Main effect plot for part weight.
Response table for part weight.
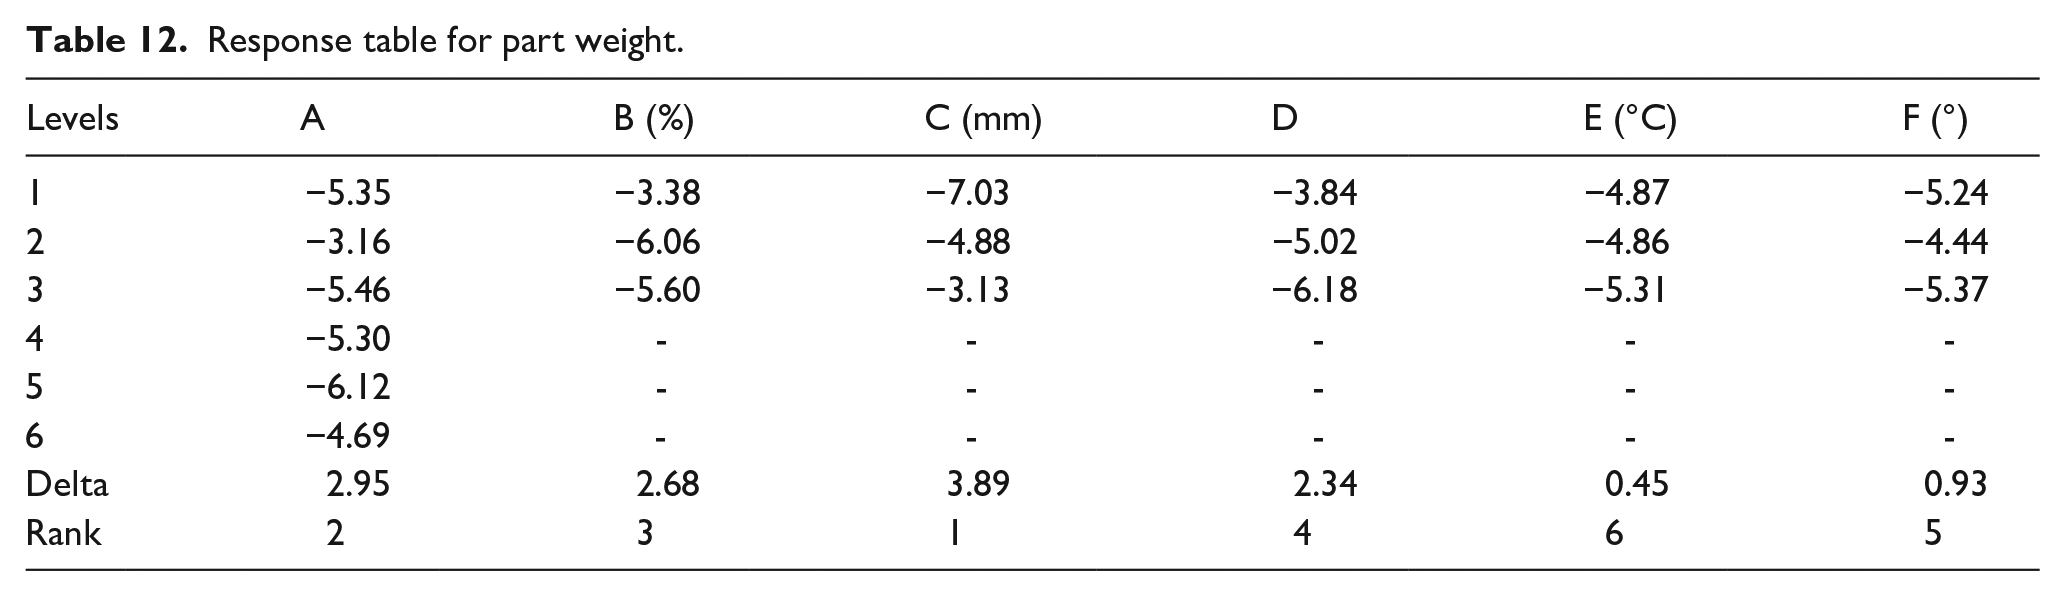
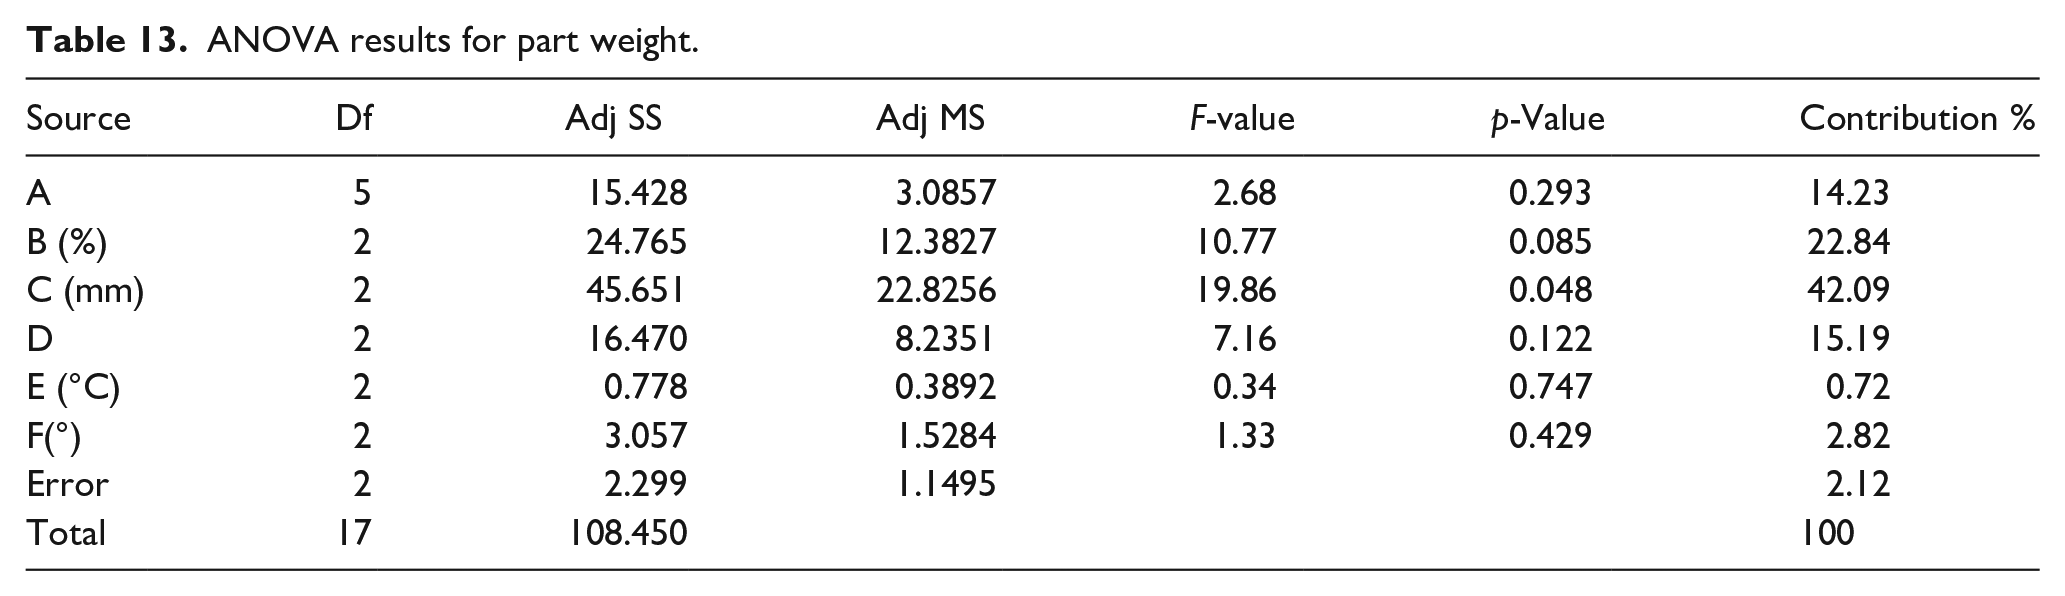
ANOVA results represent layer thickness as highly significant with p-value of 0.04 with 42.09% contribution with an error of 2.12%. In similar to previous results, both response table rankings and ANOVA results are in good agreement. Table 13 shows ANOVA results for part weight.
ANOVA results for part weight.
Effect of input factors over output responses
The experimental data is further analyzed to interpret the effect of individual factor over the output responses by considering all the output responses together by calculating their average values and also the individual factor levels.Figure 12 shows the effect of individual infill pattern over the output responses. It can be clearly understood that the value of hardness at both the regions are very closer for pattern such as octet and trihexagon. But grid, the 2D infill pattern considered has exhibited higher hardness value at face region. Figure 13 has portrayed the variation of Infill density against average values of output responses.

Infill pattern versus average values of output responses.

Infill density versus average values of output responses.
In terms of infill density, high density parts with higher layer thickness has exhibited low hardness values with considerable increase in printing time and part weight, in comparison with moderate and less filled parts. This is due to that fact that deposition of non uniform layers at higher thickness value and the combination of maximum temperature makes the layers weaken as they will get deposited in liquid state rather than semi molten state.
From Figure 14, the impact of layer thickness over output responses can be understood. Thin layers deposited have higher hardness and printing time values than thick layers. Similarly part weight has reduced when the layers are becoming thick.
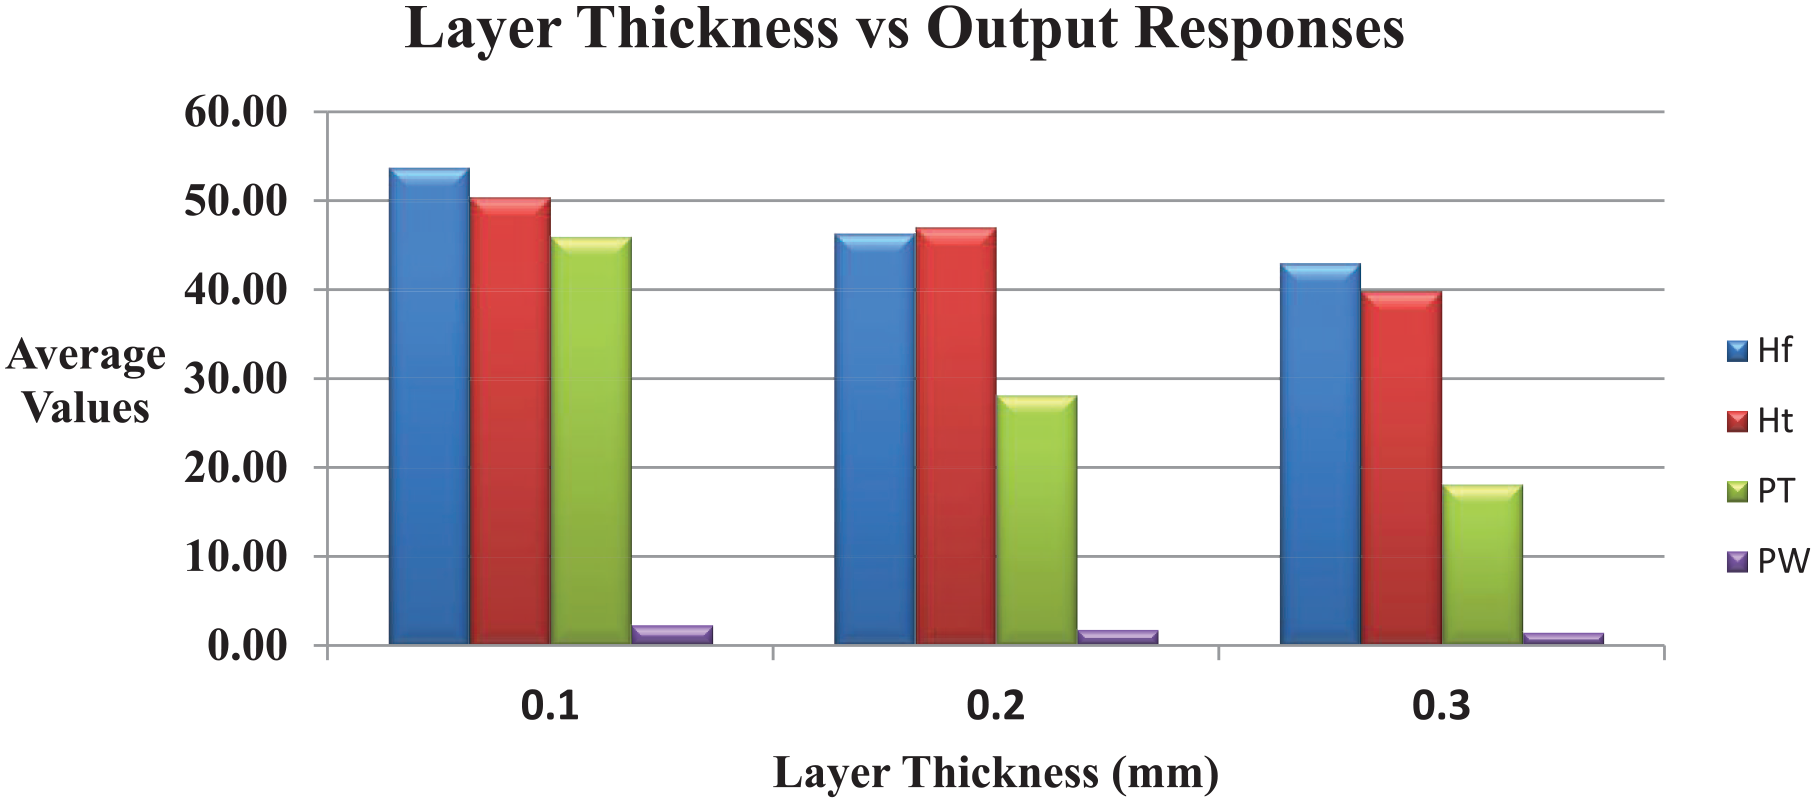
Layer thickness versus average values of output responses.
In regard to the impact of part orientation over output responses, the hardness values are very closer when the samples are prepared in the upright position. In addition that, the average values of printing time are very closer in all the orientations considered. Figure 15 depicts the effect of input factors over output responses.

Part orientation versus average values of output responses.
Printing temperature has no major impact over the output responses as shown in Figure 16 as all the output response values are closer with each other at varying levels of input factors.

Printing temperature versus average values.
Figure 17 shows raster angle effect over the output response and at 0° raster angle, the face hardness is higher than thickness section hardness, but at both 45° and 90° raster angles, the hardness values are very closer with other. No significant changes in printing time and part weight are observed.

Raster angle versus average values.
Supervised machine learning techniques
Supervised Machine Learning is a category of machine learning where a machine is trained using labeled data. Initial dataset fed for training consists of both input and output parameters, where the output responses are prelabelled for training. In the current study, the output responses have been transformed to labels such as Class 1 and Class 2, based upon the average values obtained from the experimental data. Decision tree and k-nearest neighbor algorithms have been considered for training and testing of initial dataset of all the output responses.
Table 14 shows the conditions for labeling a dataset as class 1 or class 2. Table 15 represents the labeled output responses with number of class 1 and class 2 labels and also the targeted class labels for particular output response. Figure 18 shows the supervised machine learning workflow.
Criteria for labeling output responses.

Labeled output response.


Supervised machine learning workflow in orange software.
For improving the accuracy of classification algorithm such as decision tree and k-nearest neighbor algorithms adopted in the current study, various factors inherent to the algorithm have been varied to attain their maximum performance in classifying the labeled data. In terms of decision tree algorithm, the factors such as minimum number of leaves in the trees (2,3,4), limiting the maximum tree depth (50, 75, and 100) splitting subsets not smaller than (2,4,6) have been varied and the optimal values are found to be 2, 100, and 6 respectively for improved performance. In addition to that for kNN algorithm, factors such as number of neighbors (2,4,6), type of metric (Euclidean and manhattan) and type of weight (uniform and distance) have been varied and six neighbors, euclidean metric and uniform weight found to be optimal.
Hardness at face region
The initial dataset for hardness at face region consists 18 instances of labeled data. The entire dataset has been divided in to 80:20 for training and testing. The average value of experimental face hardness has been found as 47.71, based upon the average value 7 class 1 labeled data and 11 class 2 labeled data has been obtained. Table 14 shows the conditions for labeling a dataset as class 1 or class 2. The initial dataset has been trained and tested using decision tree and k-nearest neighbor algorithms. Table 16 shows the evaluation metrics of both the algorithm models after training. From the values of area under curve and classification accuracy, the performance of decision tree algorithm is found to be better than k-nearest neighbor algorithm with 94.4% classification accuracy with area under curve value of 0.9805. One major advantage of decision tree algorithm is the tree structure which represents the conditions for attaining various class labels and also the order of significant factor for an output response. Figure 19 shows the tree structure for hardness at face region which consists nine nodes and five leaves. The factor infill density is the root node which has major influence over face hardness value, followed by part orientation and raster angle in equal positions as decision node. The conditions for attaining class 2 labeled data are:
Condition 1: 99% infill density with upright positioned printing.
Condition 2: 33% or 66% infill density with raster angles either 0° or more than 45°.
Evaluation metrics for hardness at face region.


Decision tree structure for hardness at face region.
According to the decision tree structure obtained for attaining higher hardness value at surface of the sample, the infill density has to be fixed at higher filler such as 99.5 which actually fills the complete solid with presence of micro or nano pores while printed in upright positioning. On the contrary, the decision tree structure suggests filling the sample with 33% or 66% of material with raster angles either 0° or 45°.
Confusion matrix represents the number of correct predictions of class labels made by algorithms with respect to the initial dataset. In case of hardness value at face region, decision tree algorithm has wrongly predicted one class 2 labeled data as class 1, but k-nearest neighbor algorithm has wrong predictions in case of both class 1 and class 2 labeled data with low classification accuracy of 61.11%. Figure 20(a) and (b) represents the confusion matrix of decision tree and k-nearest neighbor algorithm for sample’s face hardness.

(a) Hf—confusion matrix decision tree and (b) Hf—confusion matrix k-NN.
Hardness at thickness region
In similar to hardness at face region, the hardness at thickness region data has been labeled with 8 class 1 and 10 class 2 labeled data out of 18 instances. Decision tree algorithm performed better than k-nearest neighbor algorithm with 83.33% classification accuracy with area under curve value of 0.9438.The tree structure shown in Figure 21 consists of 11 nodes and 6 leaves. It denotes layer thickness as the root node, followed by infill pattern as the decision node and raster angle as the leaf node. For obtaining higher hardness value at the thickness region, the conditions suggested are: Layer thickness of 0.1 mm or 0.2 mm with concentric or cubic subdivision infill pattern and layer thickness of 0.1 mm or 0.2 mm with infill pattern ranging from level 3 to level 6 with raster angle greater than 45°.
Decision tree structure for enhanced hardness at thickness region.
The decision tree structure recommends building the sample with thin layers which deposits more number of layers as per the sample height and it also increases the hardness value in the thickness region.In addition to that, infill pattern considered has a strong effect over the thickness value and a proportional increase in printing time and sample weight.
Figure 22(a) and (b) shows the confusion matrix for hardness at thickness region. Table 17 shows the evaluation metrics. In case of hardness value at thickness region, decision tree algorithm has wrongly predicted three class 2 labeled data as class 1, but k-nearest neighbor algorithm has wrong predictions in case of both class 1 and class 2 labeled data with poor classification accuracy of 61.11%.

(a) Ht—confusion matrix decision tree and (b) Ht—confusion matrix k-NN.
Evaluation metrics for hardness at thickness region.

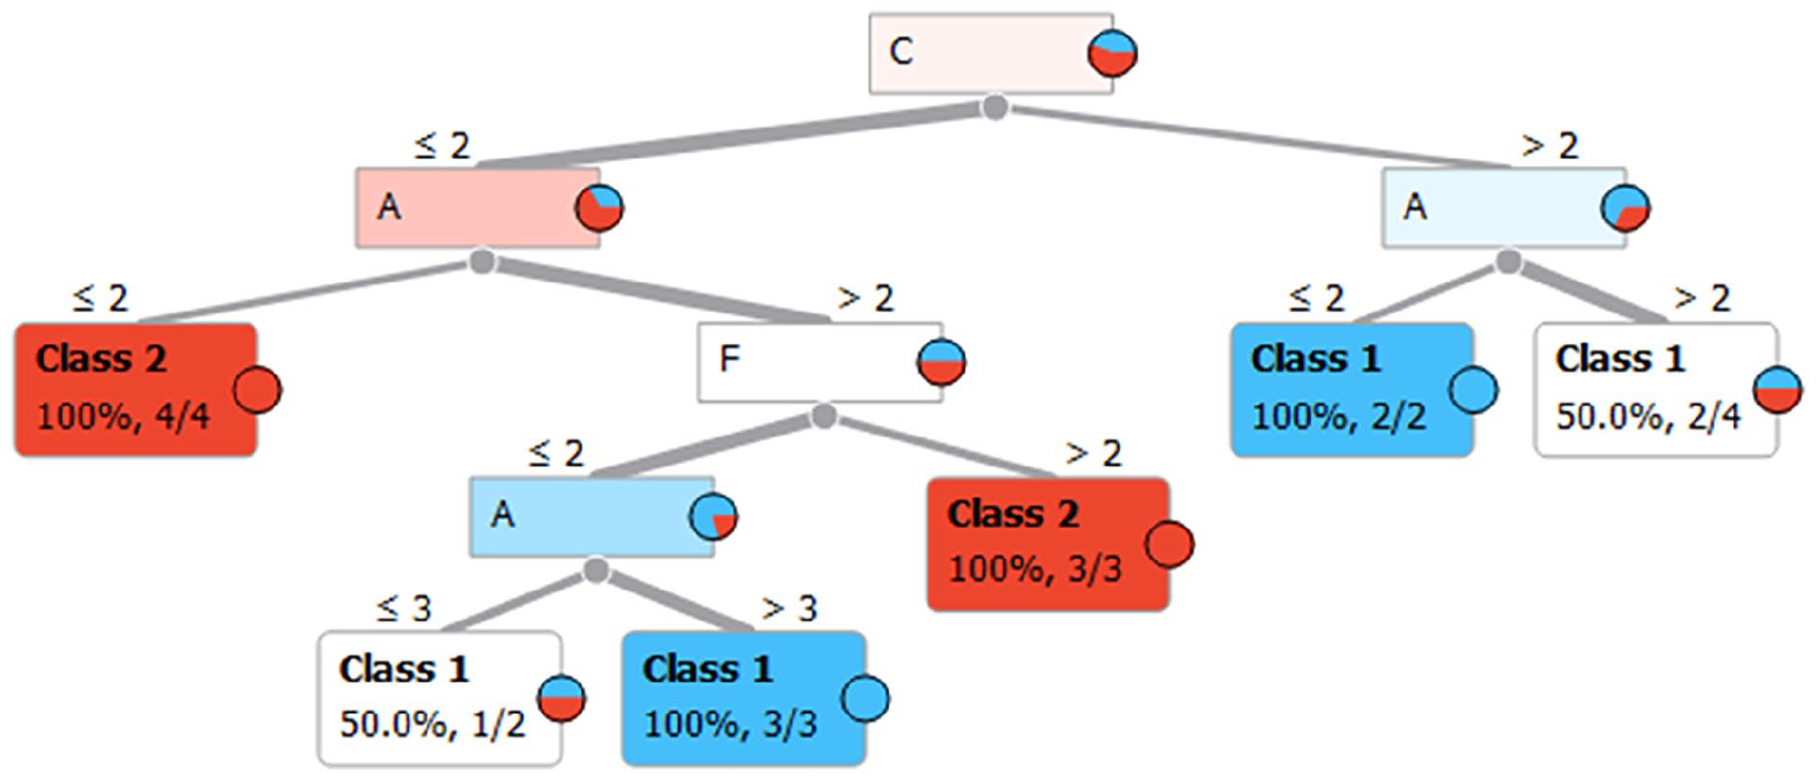
Printing time
In case of printing time, the targeted class label is class 1 and out of 18 instances, 10 class 1 and 8 class 2 labels were inputted as initial dataset. The tree structure consists of seven nodes and three leaves. The tree structure denotes layer thickness as the root node and infill density as the decision node. For obtaining lower printing time, layer thickness more than 0.1 mm and infill density less than 66% should be considered. The performance of decision tree algorithm is very higher with 100% classification accuracy, where k-nearest neighbor algorithm results with 83.33% accuracy.
Figure 23 shows the decision tree structure for attaining lower printing time values and table shows the evaluation metrics for the machine learning algorithms applied. In case of confusion matrix, decision tree has accurate prediction of class labels with 100% accuracy and k-nearest neighbor algorithm has shown only 83.33% accuracy due to wrong prediction of three class 2 labeled data. Table 18 shows the evaluation metrics for printing time. Figure 24(a) and (b) shows the confusion matrix for printing time.

Decision tree structure for reduced printing time.
Evaluation metrics for printing time.

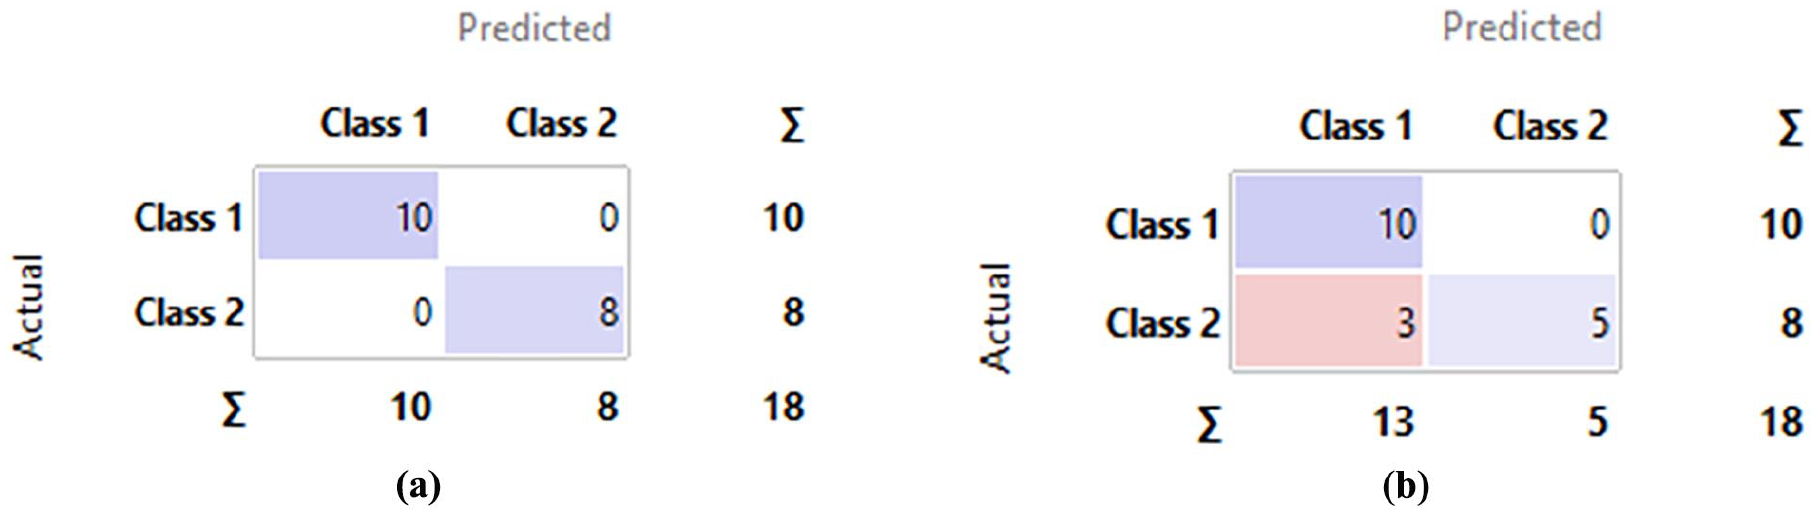
(a) PT—confusion matrix decision tree and (b) PT—confusion matrix k-NN.
Part weight
For reduced part weight, the factor infill density is found to be highly influencing as it becomes the root node in tree structure. Followed by layer thickness and part orientation as decision node, where infill pattern becomes the leaf node. Nine nodes and five leaves forms the tree structure with suggesting the conditions: Infill density less than or equal to 66% with layer thickness value less than 0.1 mm. When considering infill density more than 66%, flat orientation should be preferred. Similarly at layer thickness greater than 0.1 mm any infill pattern may be considered for part weight reduction. Figure 25 shows the decision tree structure for reduced part weight and Table 19 represents the evaluation metrics.

Decision tree structure for reduced part weight.
Evaluation metrics for part weight.

Figure 26(a) and (b) shows the confusion matrix for reduced weight. Decision tree algorithm has wrongly predicted 3 class 2 labeled data as class 1 with classification accuracy of 83.33%. Comparatively, k-NN algorithm has resulted with 77.78% of accuracy.

(a) PW—confusion matrix decision tree and (b) PW—confusion matrix k-NN.
Surface and structural morphology
Using a CARL ZEISS FESEM analyzer, the surface morphology of the printed specimens has been examined. The FESEM images at a size of 200 µm and a magnification of 100× reveal the presence of surface pores in the deposited thin layers which are closely alignedat full density. In general pores present in the surface and structure, weakens the mechanical properties in both surface and also the structure. Figure 27 shows the presence of surface pores.

FESEM image of surface porosity.
At a magnification of 100× with a scale of 200 µm, the internal microstructure of the sample has been viewed and it is being identified that at high layer thickness values, the layer are found to have irregularity along their length with surface pores and also it leads to the formation of internal voids with the adjacent layers deposited inside the part. Figure 28 depicts the FESEM image showing the presence of internal voids. The void formation generally leads to the lack of material presence which generally reduces the properties such as hardness as the durometer plunger movement can easily penetrate and indicates less values. Similarly at higher infill density with low value of layer thickness such as 0.1 mm produces closely aligned layer with less surface porosity.

FESEM image of internal voids and layer irregularity.
Conclusion
The study involves analyzing the effect of FDM parameters such as infill pattern, infill density, layer thickness, part orientation, print temperature and raster angle over hardness at face and thickness region of the sample, printing time and part weight for nylon 12 filament reinforced with 8% short cut aramid fibers. The major findings of the study are detailed herewith.
Samples of dimension 25 mm × 20 mm × 6 mm have been prepared through ultimaker FDM printer by adopting L18 mixed fractional factorial design
The shore D hardness value of samples ranged from 23 to 67 in both the face and thickness regions of the sample. In addition, printing time ranged from 13 to 57 min and part weight varied from 0.94 to 2.76 g.
Raster angle is found to be highly significant for face hardness with 50.09% contribution and 30.11% contribution on hardness at thickness region.
Similarly for printing time and part weight, layer thickness is the significant factor with 81.95% and 42.09% contributions respectively.
Thin layers are found to be beneficial in comparison with thick layers, for attaining higher hardness values at both the regions by compromising increase in printing time and part weight.
In terms of infill pattern, grid pattern has higher face hardness and patterns such as gyroid, trihexagon and octet are found to have closer hardness values at both regions.
Output responses have been labeled as class 1 and class 2 based upon average values and analyzed using classification based machine learning algorithms.
For all the four output responses considered, decision tree algorithm outperformed k-nearest neighbor algorithm with better performance on evaluation metrics.
Decision tree structure represents that for both face hardness and part weight, infill density is the most significant factor. For hardness at thickness region and printing time, layer thickness is found to be significant from the tree structure.
FESEM analysis of sample surface and internal structure has revealed the presence of internal voids, surface pores and layer irregularities.
Footnotes
Acknowledgements
Shubham Sharma is also affiliated to Department of Technical Sciences, Western Caspian University, Baku, Azerbaijan.The authors extend their appreciation to the Deanship of Research and Graduate Studies at King Khalid University for funding this work through Large Research Project under grant number RGP2/485/45.
Author note
Shubham Sharma is also affiliated to Department of Technical Sciences, Western Caspian University, Baku, Azerbaijan.
Author contributions
Conceptualization, MRN, GBK, DKS, RS, SS; methodology, MRN, GBK, DKS, RS, SS; formal analysis, MRN, GBK, DKS, RS, SS; investigation, MRN, GBK, DKS, RS, SS; writing—original draft preparation, MRN, GBK, DKS, RS, SS; writing—review and editing, SS, SPD, SK, MA, DK, JL; supervision, SS, SPD, SK, MA, DK, JL; project administration, SS, SPD, SK, MA, DK, JL. All authors have read and agreed to the published version of the manuscript.
Data availability statement
My manuscript has no associate data.
Declaration of conflicting interests
The author(s) declared no potential conflicts of interest with respect to the research, authorship, and/or publication of this article.
Funding
The author(s) disclosed receipt of the following financial support for the research, authorship, and/or publication of this article: The authors extend their appreciation to the Deanship of Research and Graduate Studies at King Khalid University for funding this work through Large Research Project under grant number RGP2/485/45.
Ethical approval
Not applicable.
Consent to participate
Not applicable.
Consent to publish
All authors have read and approved this manuscript.