
Abstract
Fused deposition modeling involves line-by-line and layer-by-layer deposition of a semisolid polymer, and the material consolidation mechanisms eventually result in a composite of the polymer substrate with interspersed inter-road voids. Considering the potential capability of the process for direct digital production of end-use parts with materials of engineering significance, methods such as adaptive slicing were attempted targeting better part qualities together with improved production times. While adaptive slicing was attributed with several useful qualities, a careful consideration reveals that most of these attempts were mere mathematical approaches, with very little or no theoretical and experimental evaluation of the actual effects. Theoretical models predicting the mechanism of inter-road bonding through solid-state sintering existed for a while, and with the advent of advances made in understanding the inter-road coalescence and mechanism of material consolidation, it is necessary to revisit adaptive slicing and establish the true attributes. This article attempts this through mathematical and experimental evaluation, considering in particular, the time- and speed-dependent variation of the inter-road coalescence.
Introduction
Rapid prototyping (RP) allows novel methods of material consolidation, and with more recent developments, some of the techniques have actually acquired abilities to process true engineering materials to produce finished parts directly from computer-aided design (CAD) files. While these developments are likely to have profound influences on the future manufacturing systems, the key controlling factors are material limitations and mechanisms of consolidation. Fused deposition modeling (FDM), being relatively cheap, is one of the most widely used additive manufacturing techniques and is a potential candidate for rapid manufacturing. Surface roughness and dimensional irregularities resulting from stair-step effects and poor mechanical properties due to the internal meso-structure are critical aspects for research in FDM.
While part quality is paramount in any manufacturing method, in FDM, better parts were envisioned to be made by reducing the layer thickness, although at the cost of increased build times. 1 Adhesive strength between layers or across filaments is weaker than the strength of a continuous filament, 2 and the air gap and raster orientation affect the tensile strength of the FDM parts. Different approaches were attempted in the past to improve surface and overall part qualities. While optimum part orientation 3 and alternative print styles 4 were methods reported for better surface quality, different slicing strategies evolved, targeting better part quality and build times. Kulkarni and Dutta 5 implemented adaptive slicing based on variable thickness slicing for optimum number of slices and cusp-height. Sabourin et al. 1 used stepwise uniform refinement, resulting in reduced build times, without losing the overall accuracy. Hope et al. 6 developed an adaptive slicing procedure based on surface curvature and angle of the surface normal for the best geometric accuracy. Sabourin et al. 7 also presented a new approach to layered manufacturing based on the concept of building parts with precise exterior and a rapidly built interior region, and Tyberg and Bohn 8 presented a new approach that first identifies the individual parts and features that comprise each layer in a given build. While most of the slicing techniques reported in the literature were based on mathematical algorithms, practical implementation and testing were limited, and the confounding effects of filament size with the speed of extrusion and printing were never considered.
In terms of improving the internal structure, the inter-layer and inter-road bonding mechanisms need to be thoroughly understood. FDM prototypes are constructed by filling with semi-molten filament and form a typical meso-structure, due to partial bonding, as shown in Figure 1. While the meso-structure significantly influences the final part characteristics, its own form is affected by the choice of the process parameters. While investigating with unidirectional P400 ABS plastic material parts, Rodríguez et al. 9 quantified the nature and the range of the meso-structure tailoring capability of the FDM material and, with further experimental evaluation, showed significant meso-structural influence on the stress–strain response. 10 Based on these results, elastic and shear moduli values of 11%–37% lower and yield strength values of 22%–57% lower than the ABS monofilament were noted, and the same will also fall short of the injection molding counterparts.
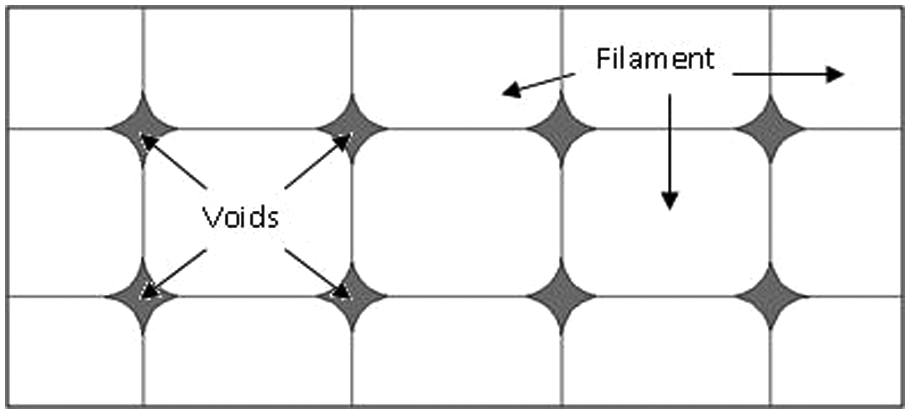
General meso-structure of an FDM part.
Meso-structural enhancements could be attempted by both improvements in external deposition styles and internal consolidation mechanisms. Sood et al. 11 suggested that higher layer thickness (0.254 mm), 0° orientation, maximum raster angle (60°), medium raster width (0.4564 mm) and maximum air gap (0.008 mm) are desirable along the length, while medium raster angle (30°) and air gap (0.004 mm) are desirable along the width using the gray Taguchi method. Thrimurthulu et al. 12 presented a single-objective optimization scheme by adding average part surface roughness and build time to determine the optimum part deposition orientation using a genetic algorithm. Masood et al. 13 also applied the minimum volumetric error as the criterion of optimizing orientation. Furthermore, equidistant tool path generation 14 and adaptive layers 15 and curved layer 16 methods were also attempted to improve the mechanical characteristics of FDM parts.
Evidently, FDM literature presents approaches such as adaptive slicing, but mainly as mathematical models, without any experimental backup and optimum raster orientations that are not directly supported by the theories of material consolidation. It was observed by Bellini 17 that higher mass deposition rates could be achieved during the road formation by reducing the speed of deposition. This brings up yet another factor, the print speed into the experimental domain. It is necessary to view adaptive slicing in terms of the consolidation mechanisms, with a due consideration of the time dependency in order to explain the possible effects. This article attempts the same through experimental and analytical evaluations.
In FDM, inter-road bonding is driven by the thermal energy of the semi-molten material. As shown in Figure 2, and described by Bellehumeur et al., 18 the first step of the process is the establishment of interfacial molecular contact by wetting. The molecules then undergo motions toward preferred configurations to achieve the adsorptive equilibrium. 19 Molecules diffuse across the interface, forming an interfacial zone, and/or react to form primary chemical bonds across the interface. The randomization can be reached only after extensive inter-diffusion of chain segments under critical conditions. It can also be modeled following approaches similar to those used to describe polymer welding, where the issue of molecular diffusion dominates. 20
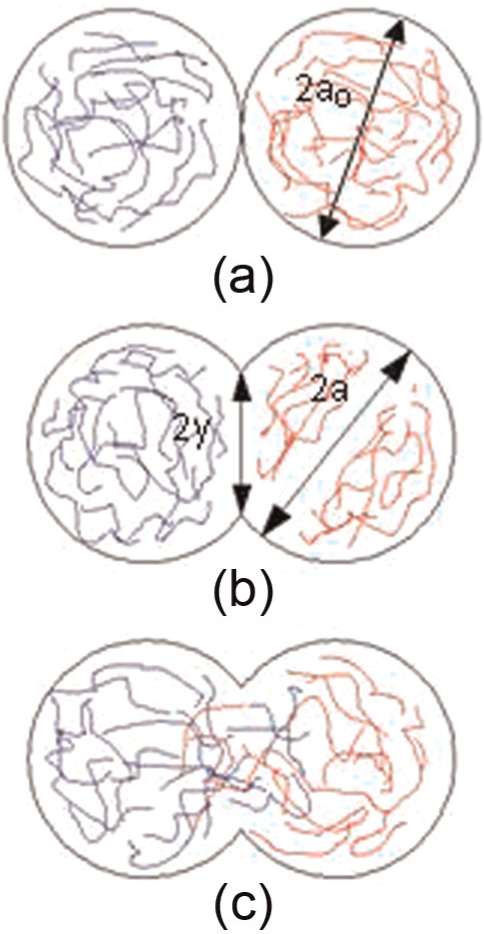
Bond formation process between two filaments: (a) surface contacting, (b) neck growth and (c) molecular diffusion at interface and randomization
The inter-road and inter-layer bonding process in FDM was analyzed by means of mathematical models based on two different mechanisms: sintering and diffusion. Sintering is the coalescence of particles under the action of surface tension. Frenkel 21 derived the first analytical model describing the rate of the coalescence occurring by viscous flow for two identical spherical particles
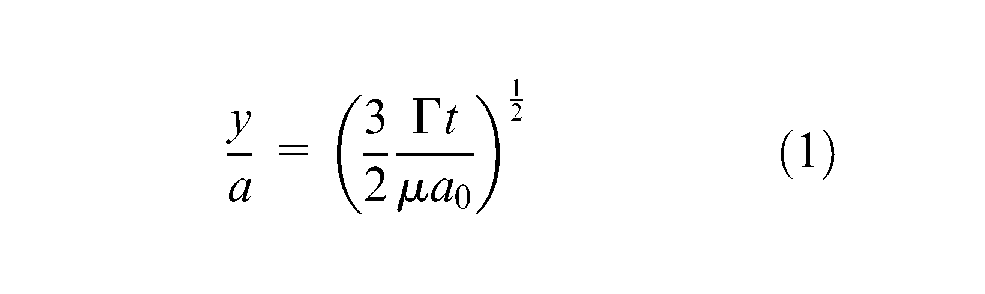
where
The theory of intermolecular diffusion across the interface under isothermal conditions is well established in the literature. The isothermal models work quite well for quasi-isothermal processes such as autoclaving. However, for online consolidation-type processes such as FDM, where thermal transients are present at multiple time scales, a non-isothermal model is needed. While both sintering and diffusion models have their own strengths and limitations, the time spent on the unit length cannot be ignored. Furthermore, the diffusion model does not take the shape of the contact area into consideration, which leaves it far from the reality. Relatively, the sintering model simulates the bonding process in FDM close to the reality and will be used in the current analysis. 18
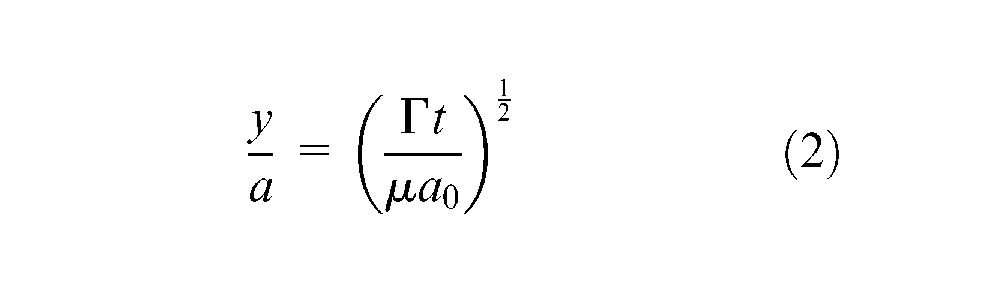
While equation (2) predicts the inter-road coalescence between two adjacent filaments, in actual practice, when a part of a given set of dimensions is printed, there will be a number of adjacent roads and a number of layers of roads, stacked one over the other. The strands will also assume distorted cross-sectional shapes, as the semisolid polymer material collapses under its own weight and spreads sideways. Furthermore, the speed of printing and the time of printing of a unit length of a filament and the filament size will critically influence the inter-road and inter-layer coalescences. All these aspects need to be considered together with equation (2), to be able to develop a mathematical model to predict the mechanical attributes of parts produced by FDM. This is attempted through two different models in this research, as discussed in the following sections, considering the excessive interactions and confounding effects of the three factors. The explicit influences of speed of printing and time of printing together with the number of layers for a given part predicted through these models also paved way to a direct verification by experimental means, as presented in section “Experimental evaluation.”
Modeling layer thickness and print speed effects
The flexural strength measured by the three-point bending experiment on a flat piece specimen of dimensions of 50 mm × 20 mm × 4 mm is considered as the basis for all analytical and experimental investigations carried out as part of this work. While the flexural strength is the same as the tensile strength in an ideal case for which the material is homogeneous, in FDM, the meso-structure dominates the internal structure and will affect the final properties of the part. Assuming pure bending and constant flexural strength, the stress equation from the elementary principles of solid mechanics is

where
Considering that the deposited filaments partly fuse into one another, an exact cylindrical road is far from the reality and the actual shape of each filament depends on the rate of coalescence. The shape of each filament is considered as a square with elliptical fillets, and multilayer models are constructed as shown in Figure 3.
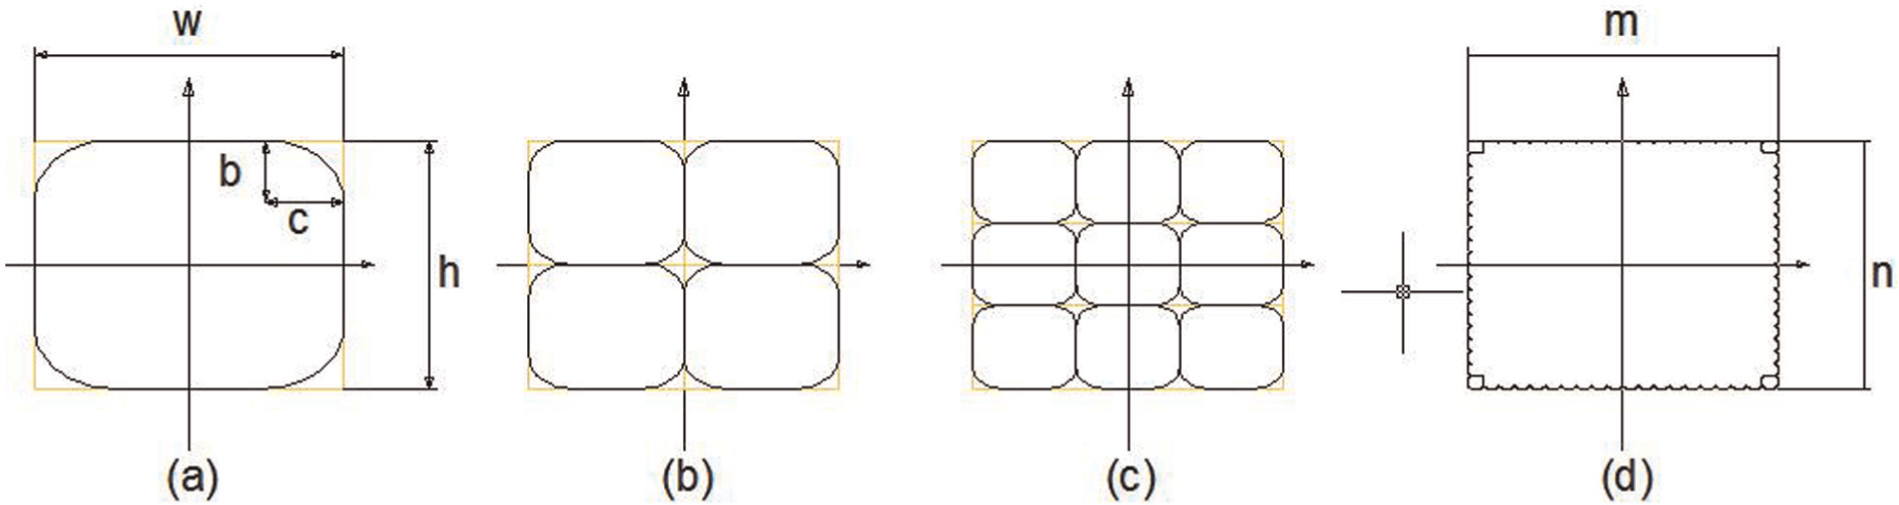
Cross-sectional area of a square shape with precise filling: (a) single layer, (b) two layers, (c) three layers and (d) multilayers.
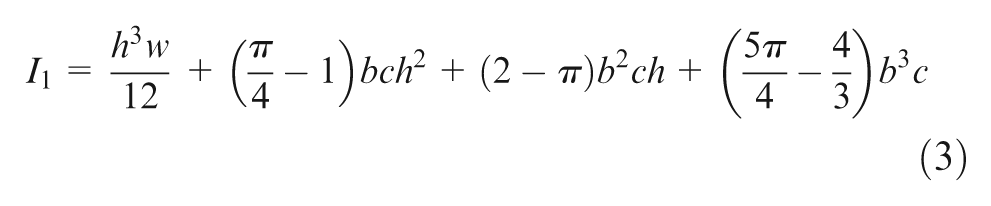
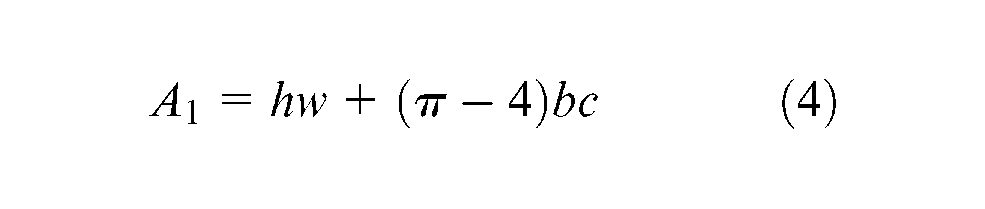
For this model, the second moment of area and the area of the single layer (Figure 3(a)) are as follows
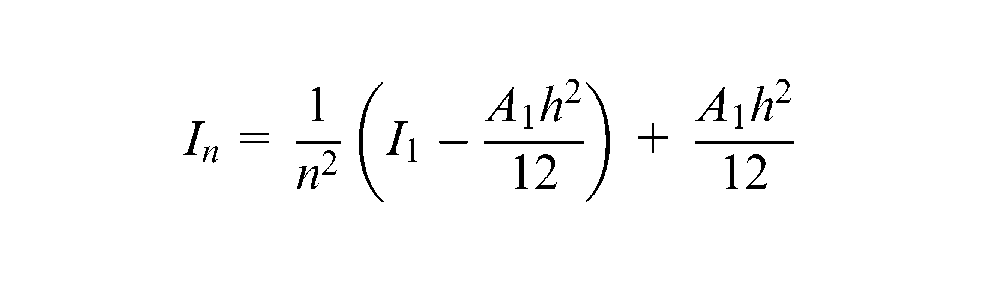
For the multilayer model, the equations become
For each of the areas
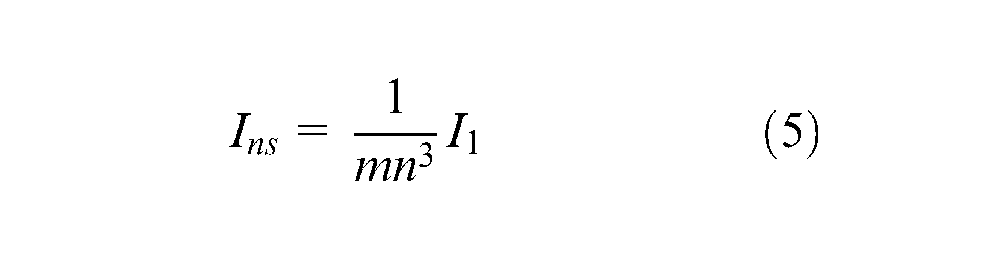
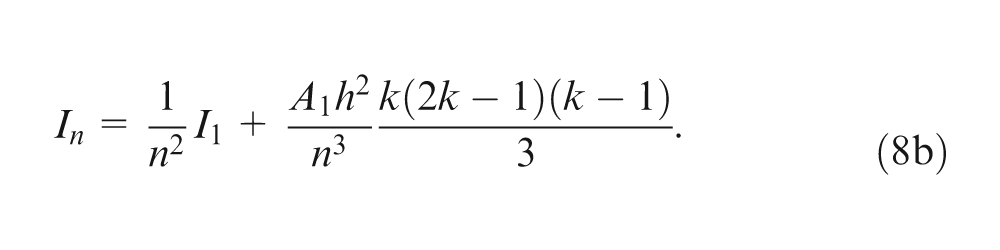
For a model with m rows and n layers, the I of the whole area is
when n = 2k, k ∈ N
when n = 2k + 1, k ∈ N
After simplification and substituting
when n = 2k, k ∈ N
when n = 2k + 1, k ∈ N
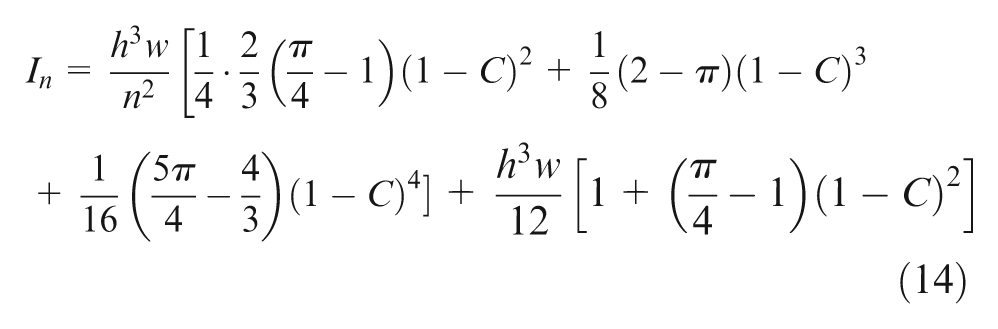
The final equation for the I of the model with m rows and n layers is
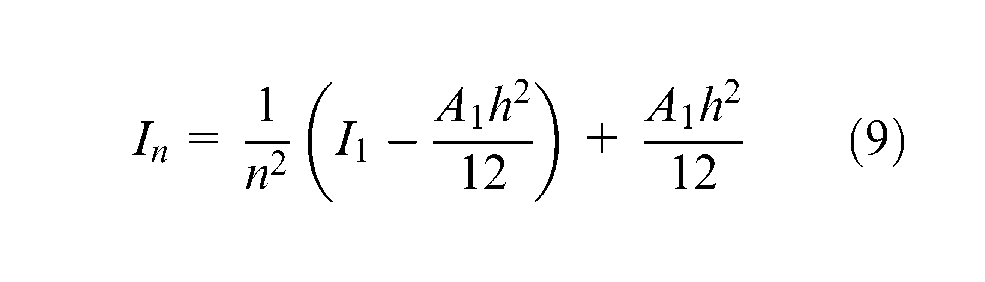
Substituting
However, this equation needs to be modified to consider the effects of coalescence. Bellehumeur et al. 18 proved that Frenkel–Eshelby model could be used to predict the inter-road sintering phenomena in FDM. Assuming the print speed is constant; time elapsed for a unit length of deposition is the same. Viscosity and surface tension of the material are temperature-sensitive material properties, but if the same material is used with different thicknesses, equation (2) can be written as
where
Furthermore
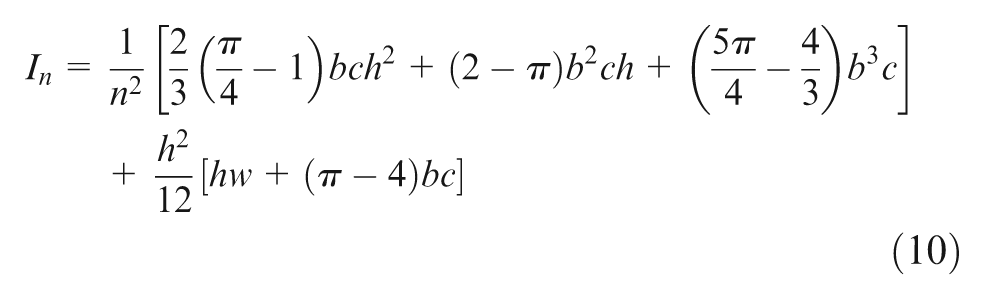
Substituting b (equation (12)) and c (equation (13)) in equation (10)
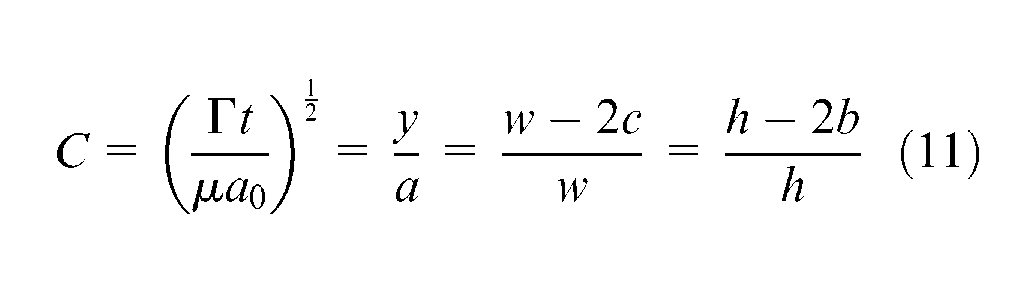
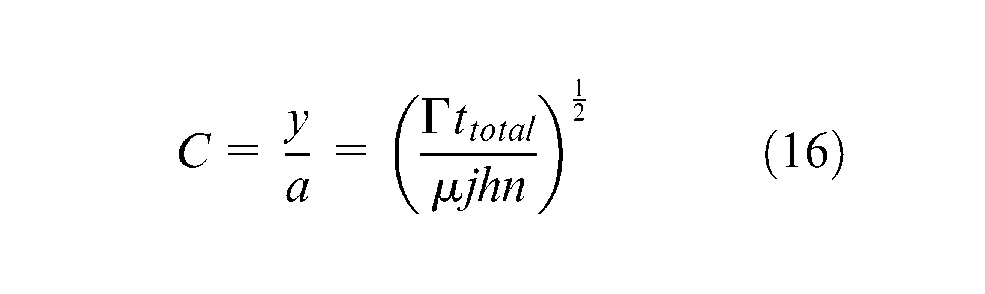
The speed at which the filament is extruded must be equal to the speed at which it is printed, and it must allow the smallest of the filaments to coalesce. Considering a specific print speed, v, the equation for the coalescence factor C can be rewritten as

where n, m, l and h are the number of layers, number of roads, part length and part height, respectively. Then, it can be simplified as follows
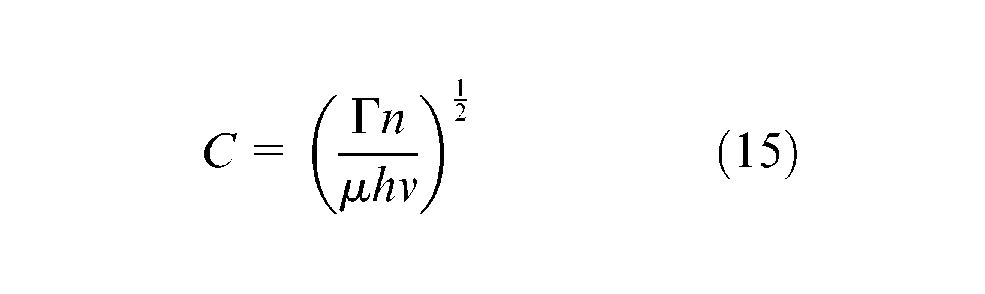
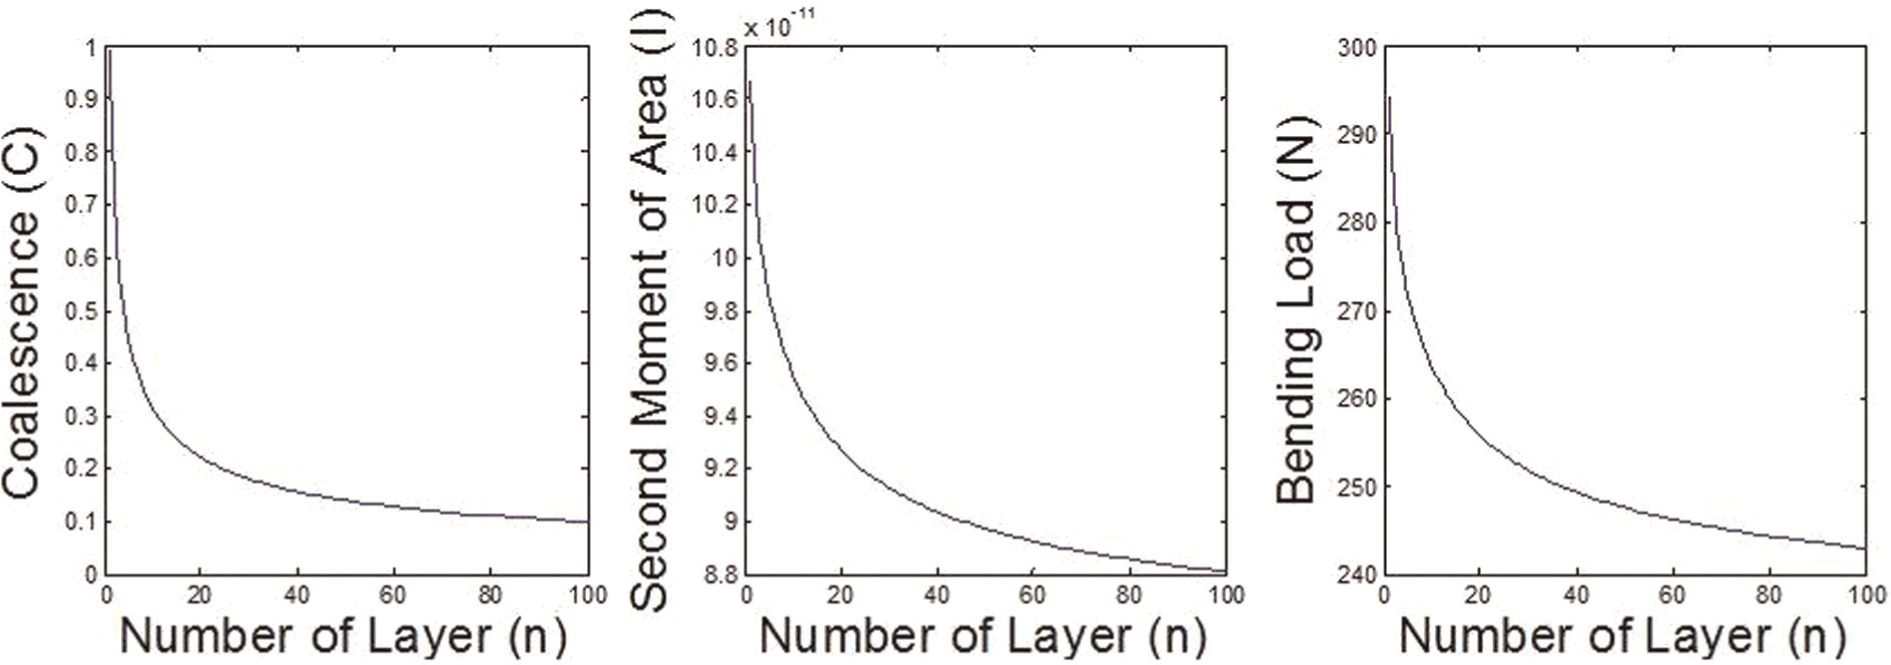
This equation for C allows predicting the influences of speed of printing on the rate of coalescence between adjacent strands and also on the second moment of area, when used in equation (15), considering different filament sizes, for a multilayer component. Figure 4 depicts variations in C and I with varying number of layers for a given speed of printing, 60 mm/s. While printing with a given speed, the higher the number of layers, the higher is the coalescence and the better the second moment of area. For a test piece of given dimensions, as stated at the start of this section, the filament size varies with the number of layers. As the filament size varies, the deposition head needs to adjust the extrusion speed and the X–Y gantry of the FDM system needs to match the printing speed, so as to keep the speed of printing the same.
Coalescence, second moment of area and bending load versus number of layers based on the model for print speed effects (speed of printing = 60 mm/s).
This result indicates that for a fixed speed, adaptive slicing with thicker slices employed to save time could lead to an actual loss of the strength of the part, while finer slicing results in better part strength, apart from improved surface quality due to reduced stair-step effects, as reported in the literature. Furthermore, Figure 5 predicts the variations in C and I with increasing speed of printing, for a given filament size, in this case the size corresponding to 20 layers making up the standard test specimen. As evident, for a given filament size, C and consequently I decrease with increasing print speed. It may be readily observed, the faster the speed, the lesser is the time for a unit length of filament to coalesce with the adjacent filaments and the lesser is the value of C.
Coalescence, second moment of area and bending load versus print speed based on the model for print speed effects (number of layers = 10).
Equation (9) also depicts the upper limit of the moment of inertia for the FDM part in accordance with the mathematical expression
This is the reason the value of C in Figure 4 reaches the limiting value of 1, and the curve representing the variation of I becomes asymptotic with the horizontal axis after a certain number of layers, as dictated by the overall dimensions of the part.
Modeling layer thickness and print time effects
It is evident that the part strength increases with increasing number of layers, as long as the print speed is kept constant. Inadvertently, the total time of printing is affected in this process. The next step in this analysis is to consider the effects of print time together with the layer thickness. This is achieved by inserting into equation (2) the time required for printing a unit length of filament of a given size, which then takes the form
where n, m, l and h are the number of layers, number of roads, part length and part height, respectively.
The longer the time spent on a unit length filament, the higher is the inter-road coalescence and the better is the strength of the part. Considering the internal mechanism of material processing of the deposition head in FDM, the speed of extrusion, as well as the flow velocity of the filament, needs to be adjusted in order to achieve a given time of printing. Considering two nozzles with diameters
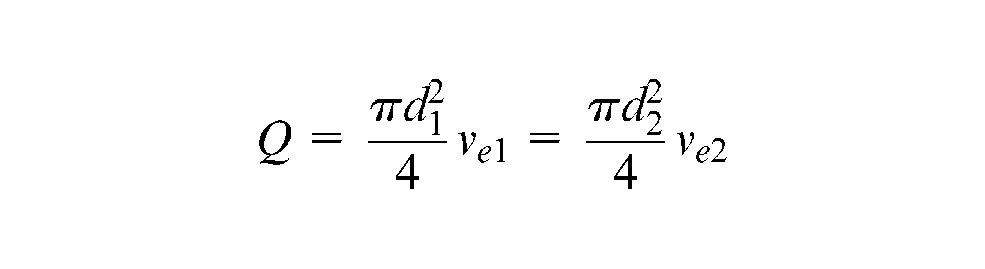
Then

where
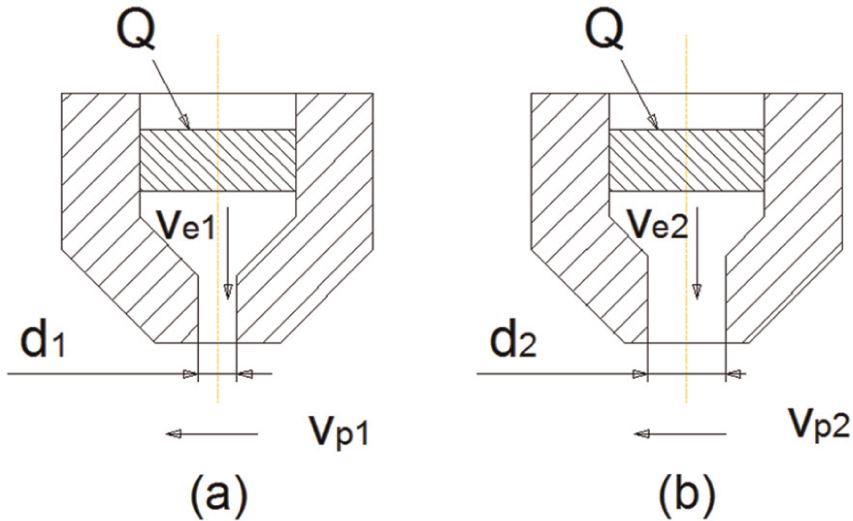
Two nozzles with different diameters.
Based on the volume continuity
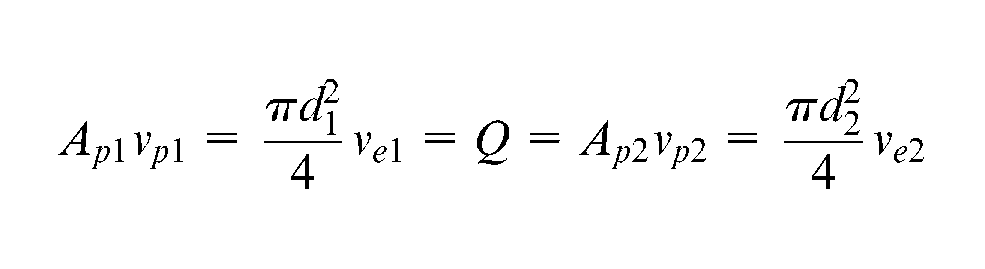
where
In order to simulate variations of filament forms close to the reality, the shape of the cross-sectional area of the road was assumed to be as shown in Figure 7. The width and the thickness of the cross-sectional area in Figure 7(a) are in the same linear portion to their counterparts in Figure 7(b). Assuming that the ratio of the two cross-sectional areas to be equal to l, as earlier, the relationship between

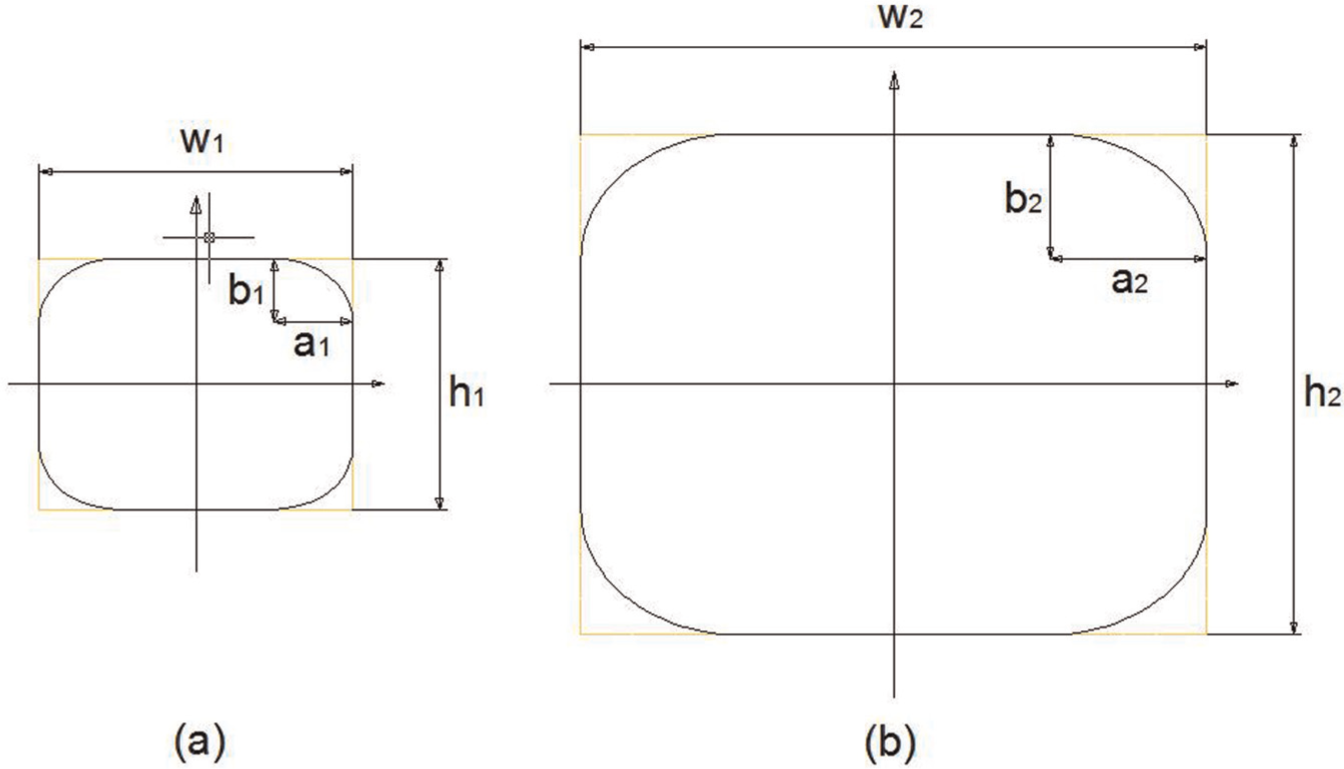
Road shape of each cross-sectional area in two different nozzle settings.
When a number of strands are used to constitute the cross section, the ratio number of rows to number of columns is taken as j

In order to understand the influence of the time factor, the mathematical model developed earlier needs to be revisited now. Previously,

where j is a constant that depends on the cross-sectional shape.
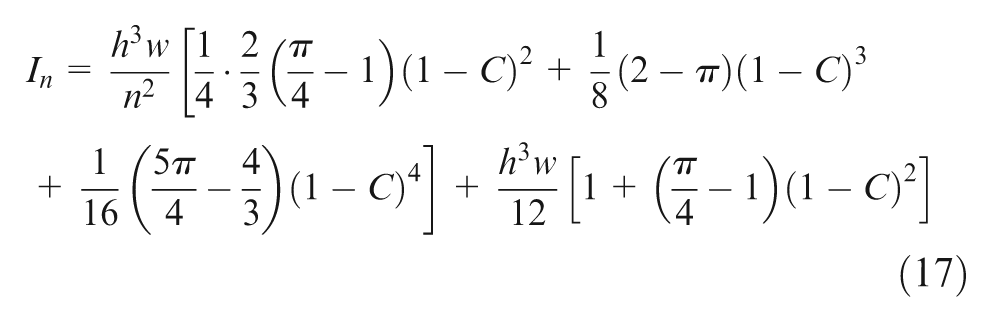
The expression for C is again derived as a function of the total time. For a given part dimensions, with a fixed total time, the time for printing a unit length and consequently the print speed will change as the filament size varies
Furthermore, the expression for the second moment of area as a function of C will take the same form as equation (16) and is repeated below for convenience
These equations allow evaluation of effects of varying total time and filament sizes on the values of C and the moment of inertia. First, considering the variation of number of layers, Figure 8 shows both C and I decreasing with increasing number of layers, for a given total time of printing the test piece, which is 16 min in this case. The total time being fixed, the speed of printing increases with increasing number of layers, allowing lesser time for a unit length of deposition, and lesser coalescence. It may be noted that this trend is an almost reversal of that shown in Figure 4. Thus, the time factor and the speed of printing while contradicting each other, their influences also interact with the filament size.
Coalescence, second moment of area and bending load versus number of layers based on the model for print time effects (total print time = 75 s).
It is also interesting to note the influence of the total time with the filament size fixed at a particular level. Figure 9 presents variation of C and I with increasing total time of printing, with the number of layers fixed at 20. For a given filament size, the more the time given to complete a part of given dimensions, the lesser are extrusion and print speeds, and the better will be the inter-road coalescence and the moment of inertia. This result is again a reversal of the trend, as shown in Figure 5, where increasing print speed has an adverse effect on the coalescence.
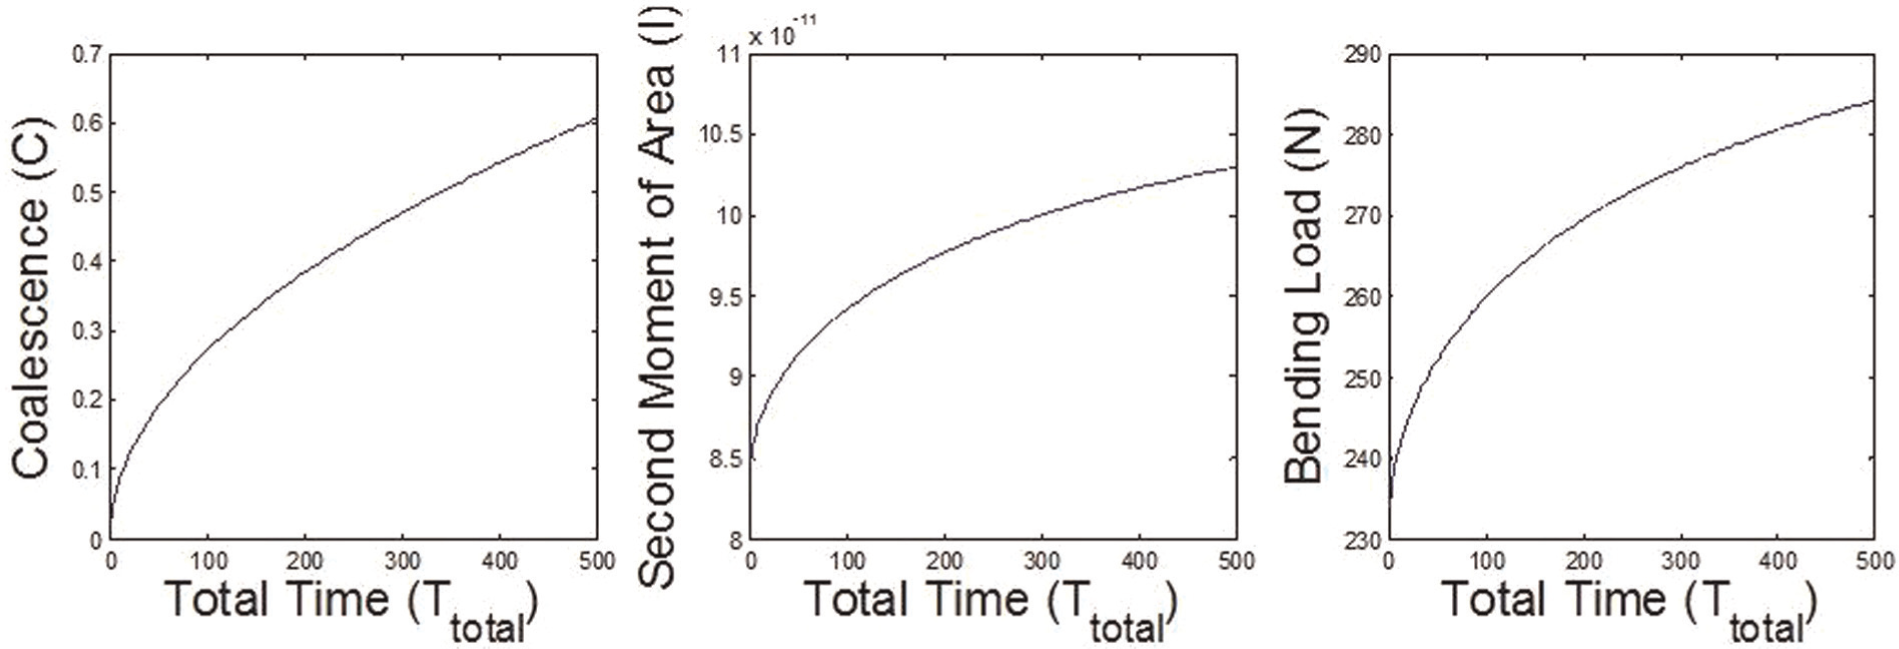
Coalescence, second moment of area and bending load versus total time based on the model for print time effects (number of layers = 10).
Based on predictions from analytical models, it is evident that the print speed, time of printing and the filament size have confounding effects on the final strength of the part, when varied together. The end result evidently depends on the actual combination of these parameters for a given part. The existing literature only talks about the possible improvements in the surface quality with adaptive slicing, notwithstanding significant effects on other aspects such as the part strength. From the observations of the results of the analytical models developed here, it is apparent that true benefits of adaptive slicing can only be realized by properly adjusting the three process parameters so as not to loose the mechanical characteristics. For a fixed total printing time, it is clear that thick layers result in better mechanical properties compared to thinner layers, much against the popular belief in adaptive slicing literature. An experimental verification of these results is essential at this stage, and the next section presents the results of three-point bending tests designed for this purpose.
Experimental evaluation
The purpose of the experimental evaluation is to verify the two mathematical models developed in the previous section. Test pieces for three-point bending need to be printed with varying speed and total time of printing, to be able to provide direct experimental support of the analytical models. Commercial FDM machines usually work as black boxes and do not allow much freedom to alter process conditions. Makeshift test facilities could be built, but will have limitations on the quality of controlling the parameters. After trying a couple of other alternatives, a MakerBot cupcake Computer Numerical Control (CNC) kit was finally procured and assembled, which uses a heated metal plate as the platform for printing, allowing for the temperature of the substrate to be controlled. The injection head draws ABS feed rod of 3 mm diameter to extrude through a heated nozzle of selected size. The arrangement of the print head and the heated platform is shown in Figure 10.
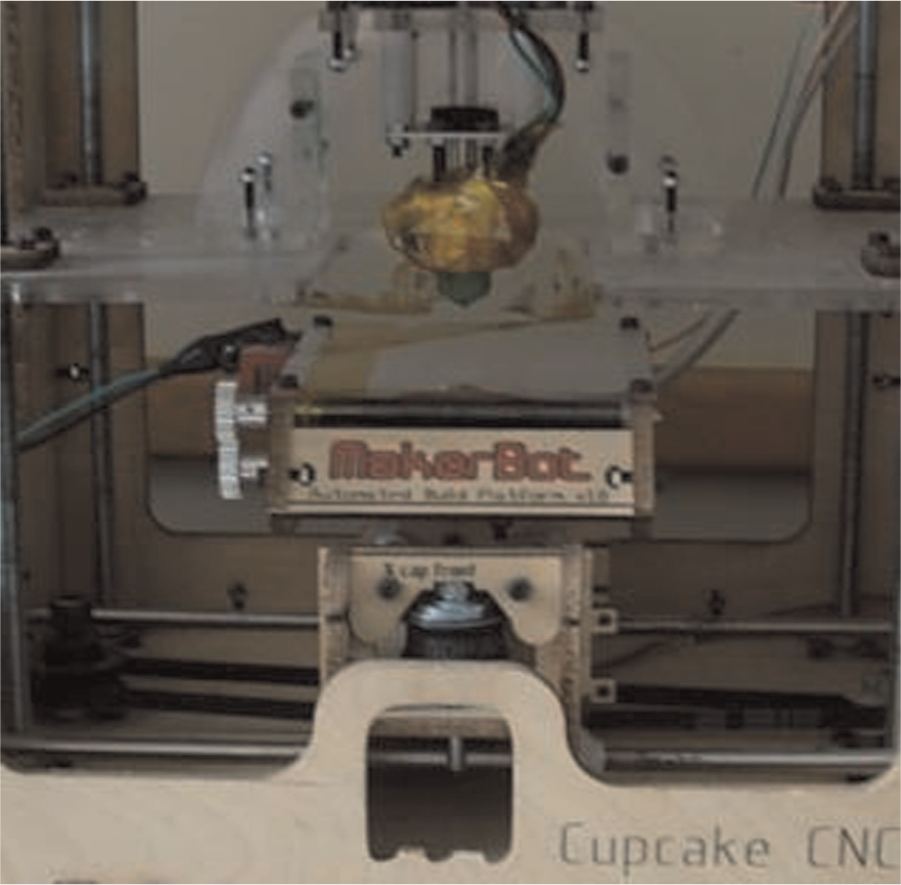
Experimental setup.
Given that the MakerBot kit is a makeshift FDM device, considerable amount of fine tuning and improvization became necessary, before being able to produce test pieces of consistent quality with carefully controlled process parameters. Nozzle tips of different orifice diameters were made to go with the extrusion head, to produce filaments of different diameters. The power rating and control means of the drive motor used on the extrusion head needed adjustments so as to handle seamless production of filaments of different sizes under varying speeds. Furthermore, deposition path data generated by processing the STL files created from the CAD models are used to circumvent the system software and implement varying layer thickness options.
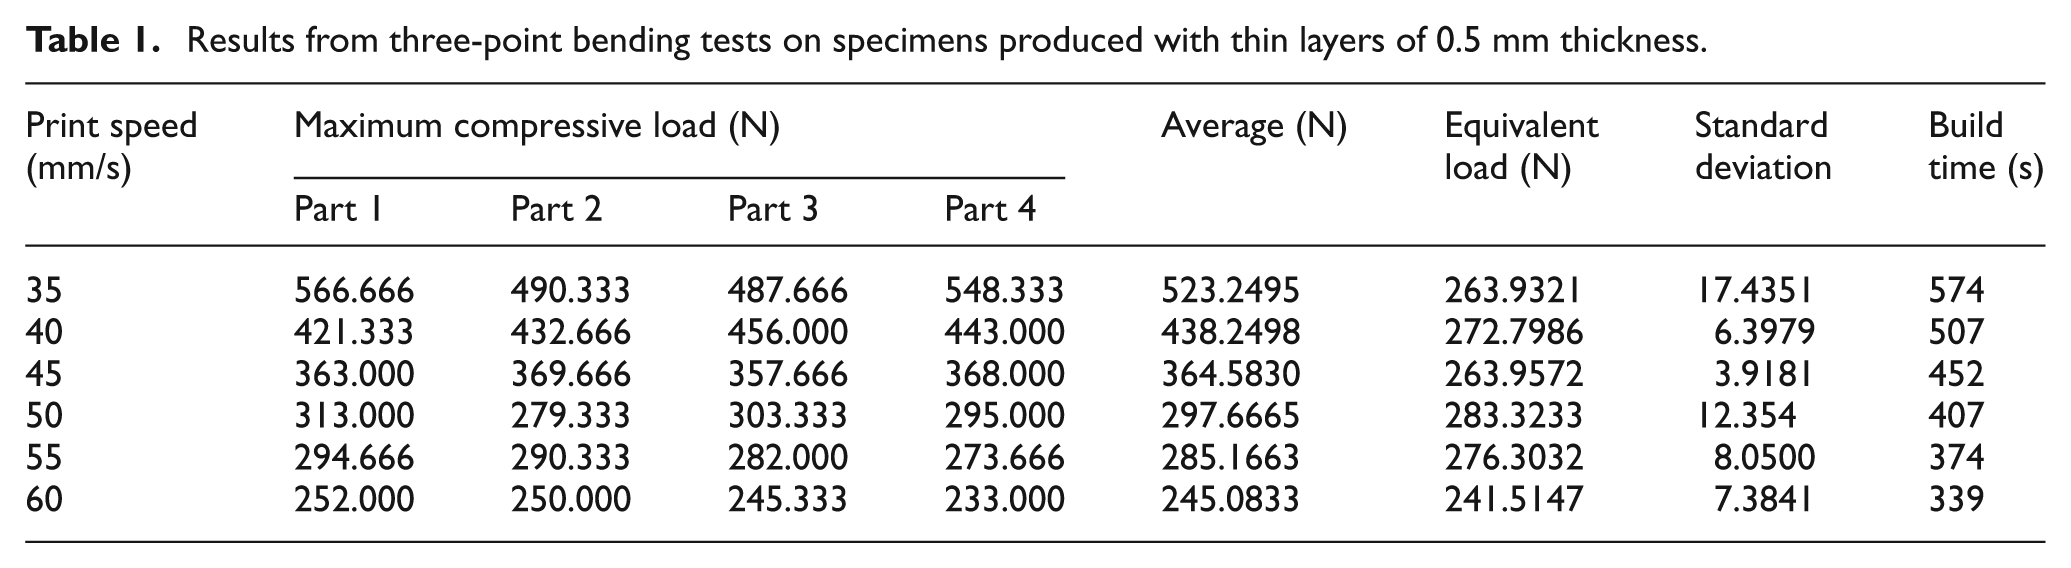
The first step is to establish the significance of speed of printing on the resulting mechanical characteristics and verify the results presented in Figure 5. There are two critical speeds that can be controlled in FDM: the extrusion speed, which is internal to the deposition head, and then the actual printing speed, which depends on the speed of movement of the X–Y gantry. Both of them need to be controlled and synchronized in order to achieve a given print speed, as the continuity of material flow needs to be maintained. In the current trials, test pieces of the same dimensions as used in the analytical models are printed with the print speed varying from 35 to 75 mm/s, using a filament size of 0.5 mm. The average compressive loads under three-point bending tests are recorded, as shown in Figures 11–16, and consolidated in Table 1. The average compressive load may be observed to decrease with increasing print speed due to decreasing time allowed for inter-road coalescence.
Results from three-point bending tests on specimens produced with thin layers of 0.5 mm thickness.
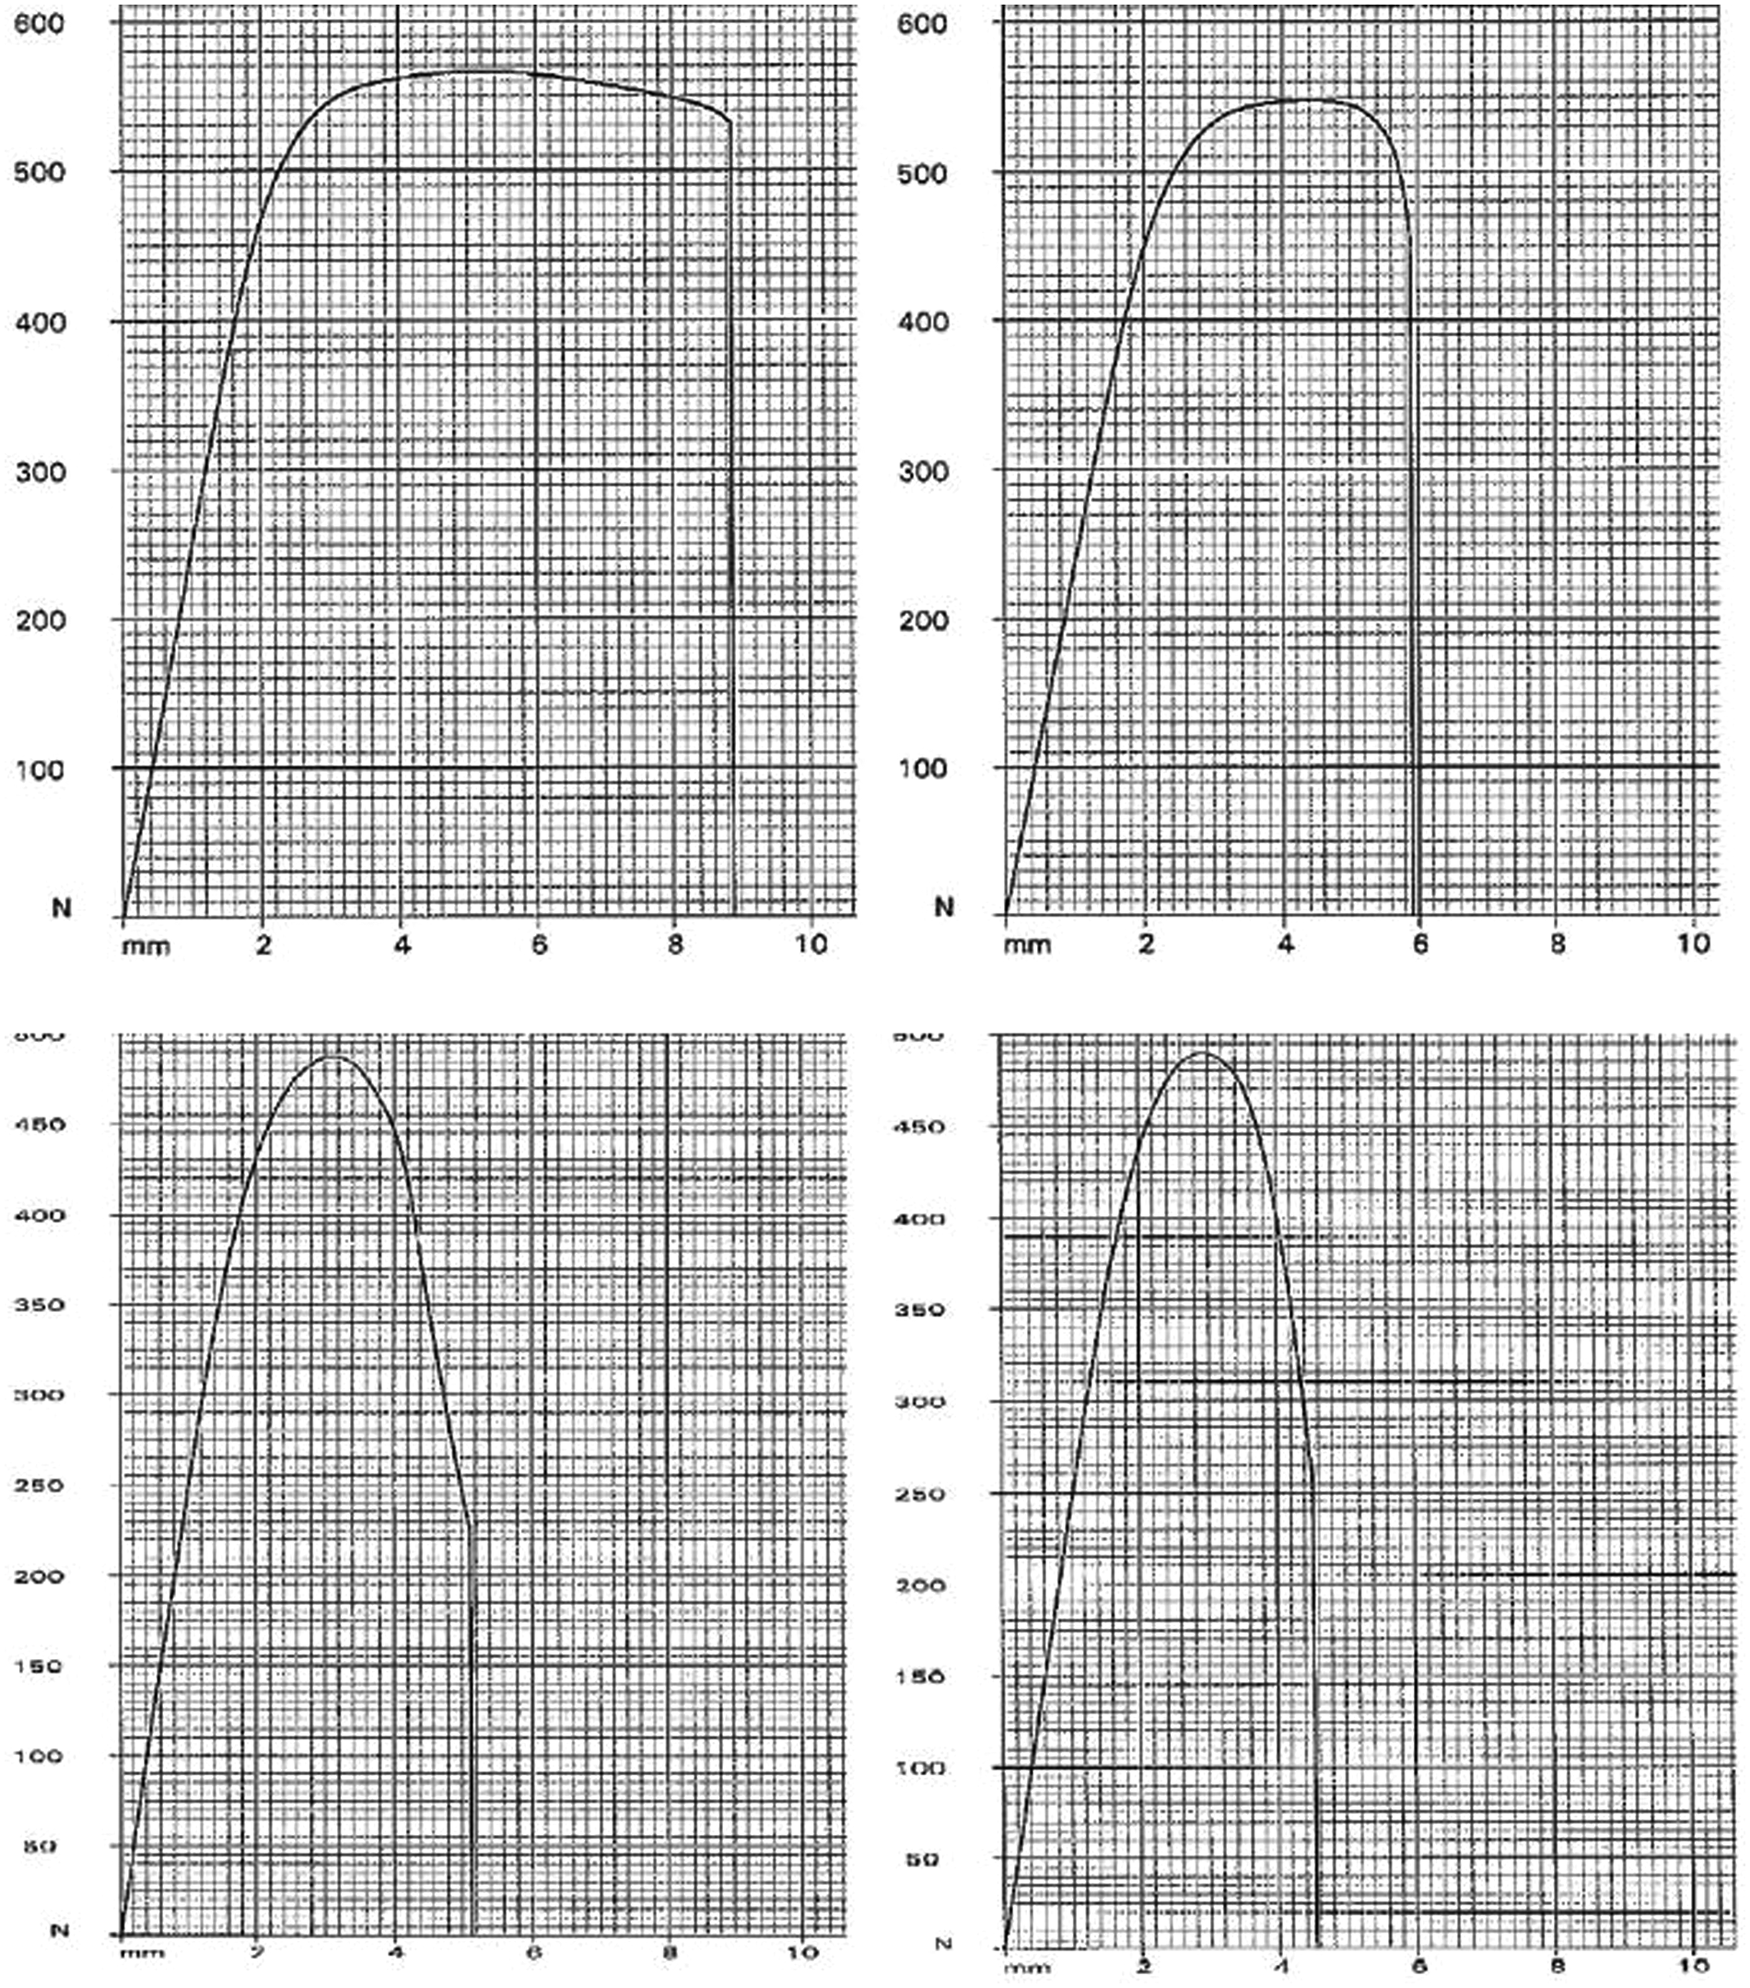
Load deflection diagrams from three-point bending tests of thinner layer parts with print speed at 35 mm/s. (Y-axis: Load (N) and X-axis: Deflection (mm)).
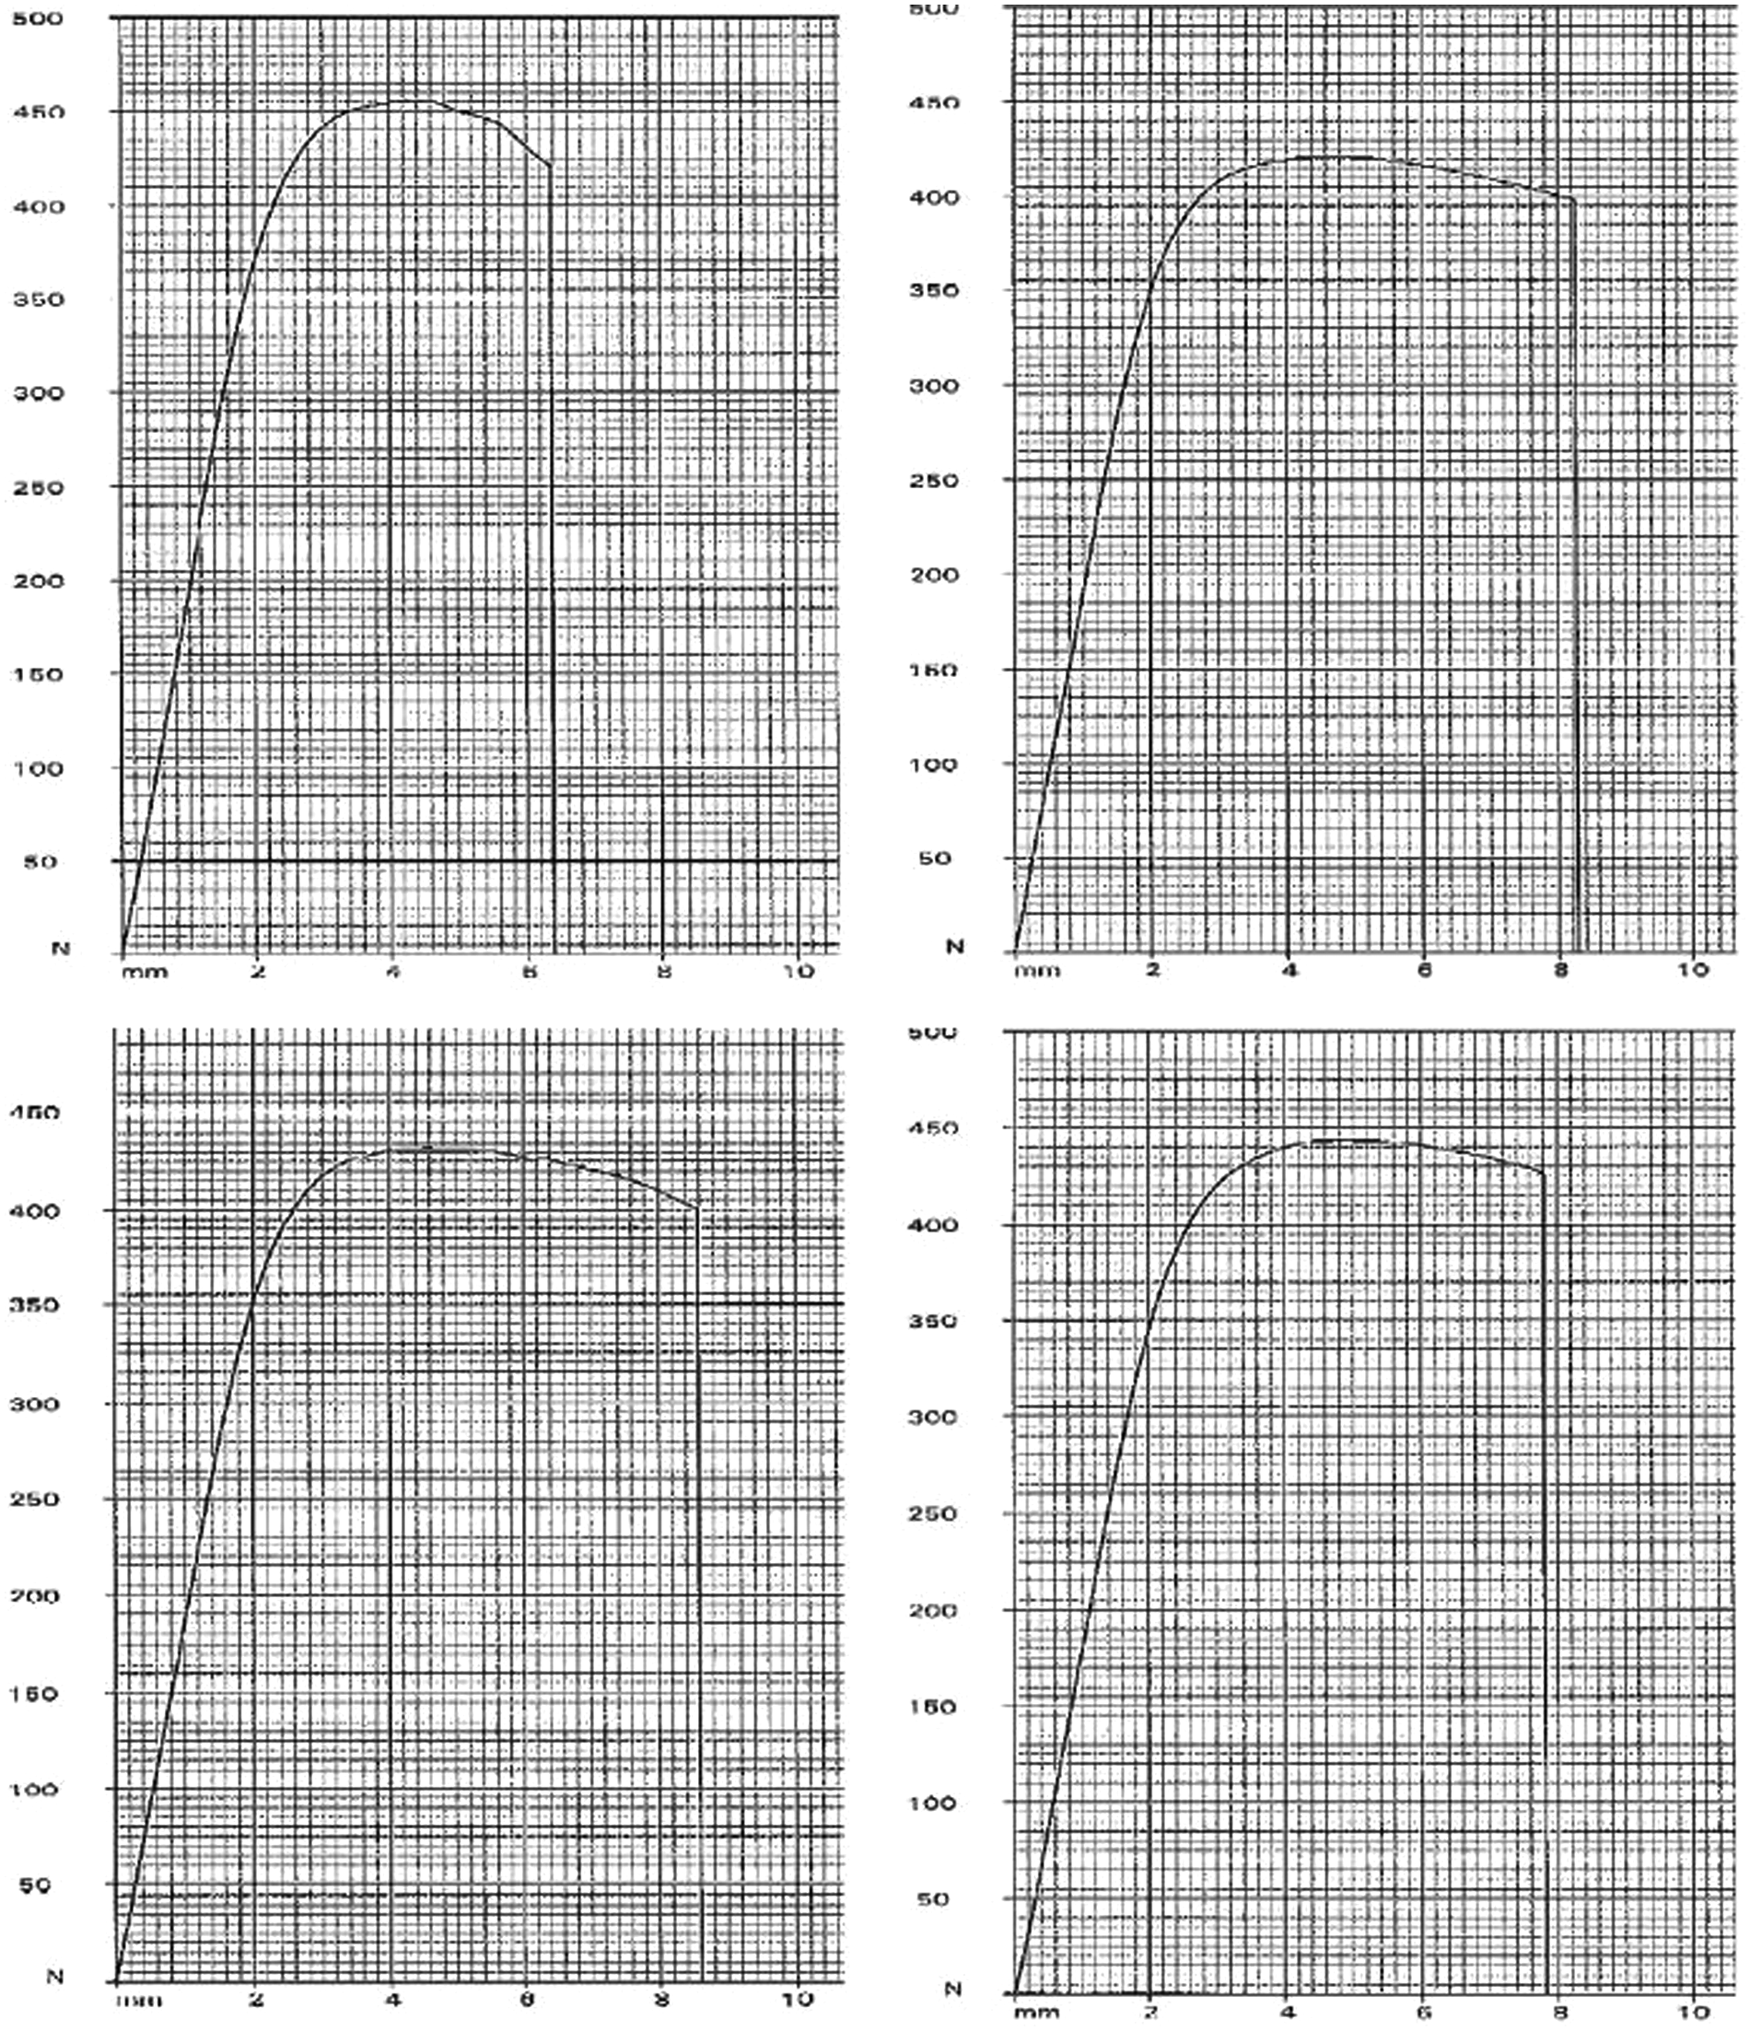
Load deflection diagrams from three-point bending tests of thinner layer parts with print speed at 40 mm/s. (Y-axis: Load (N) and X-axis: Deflection (mm))
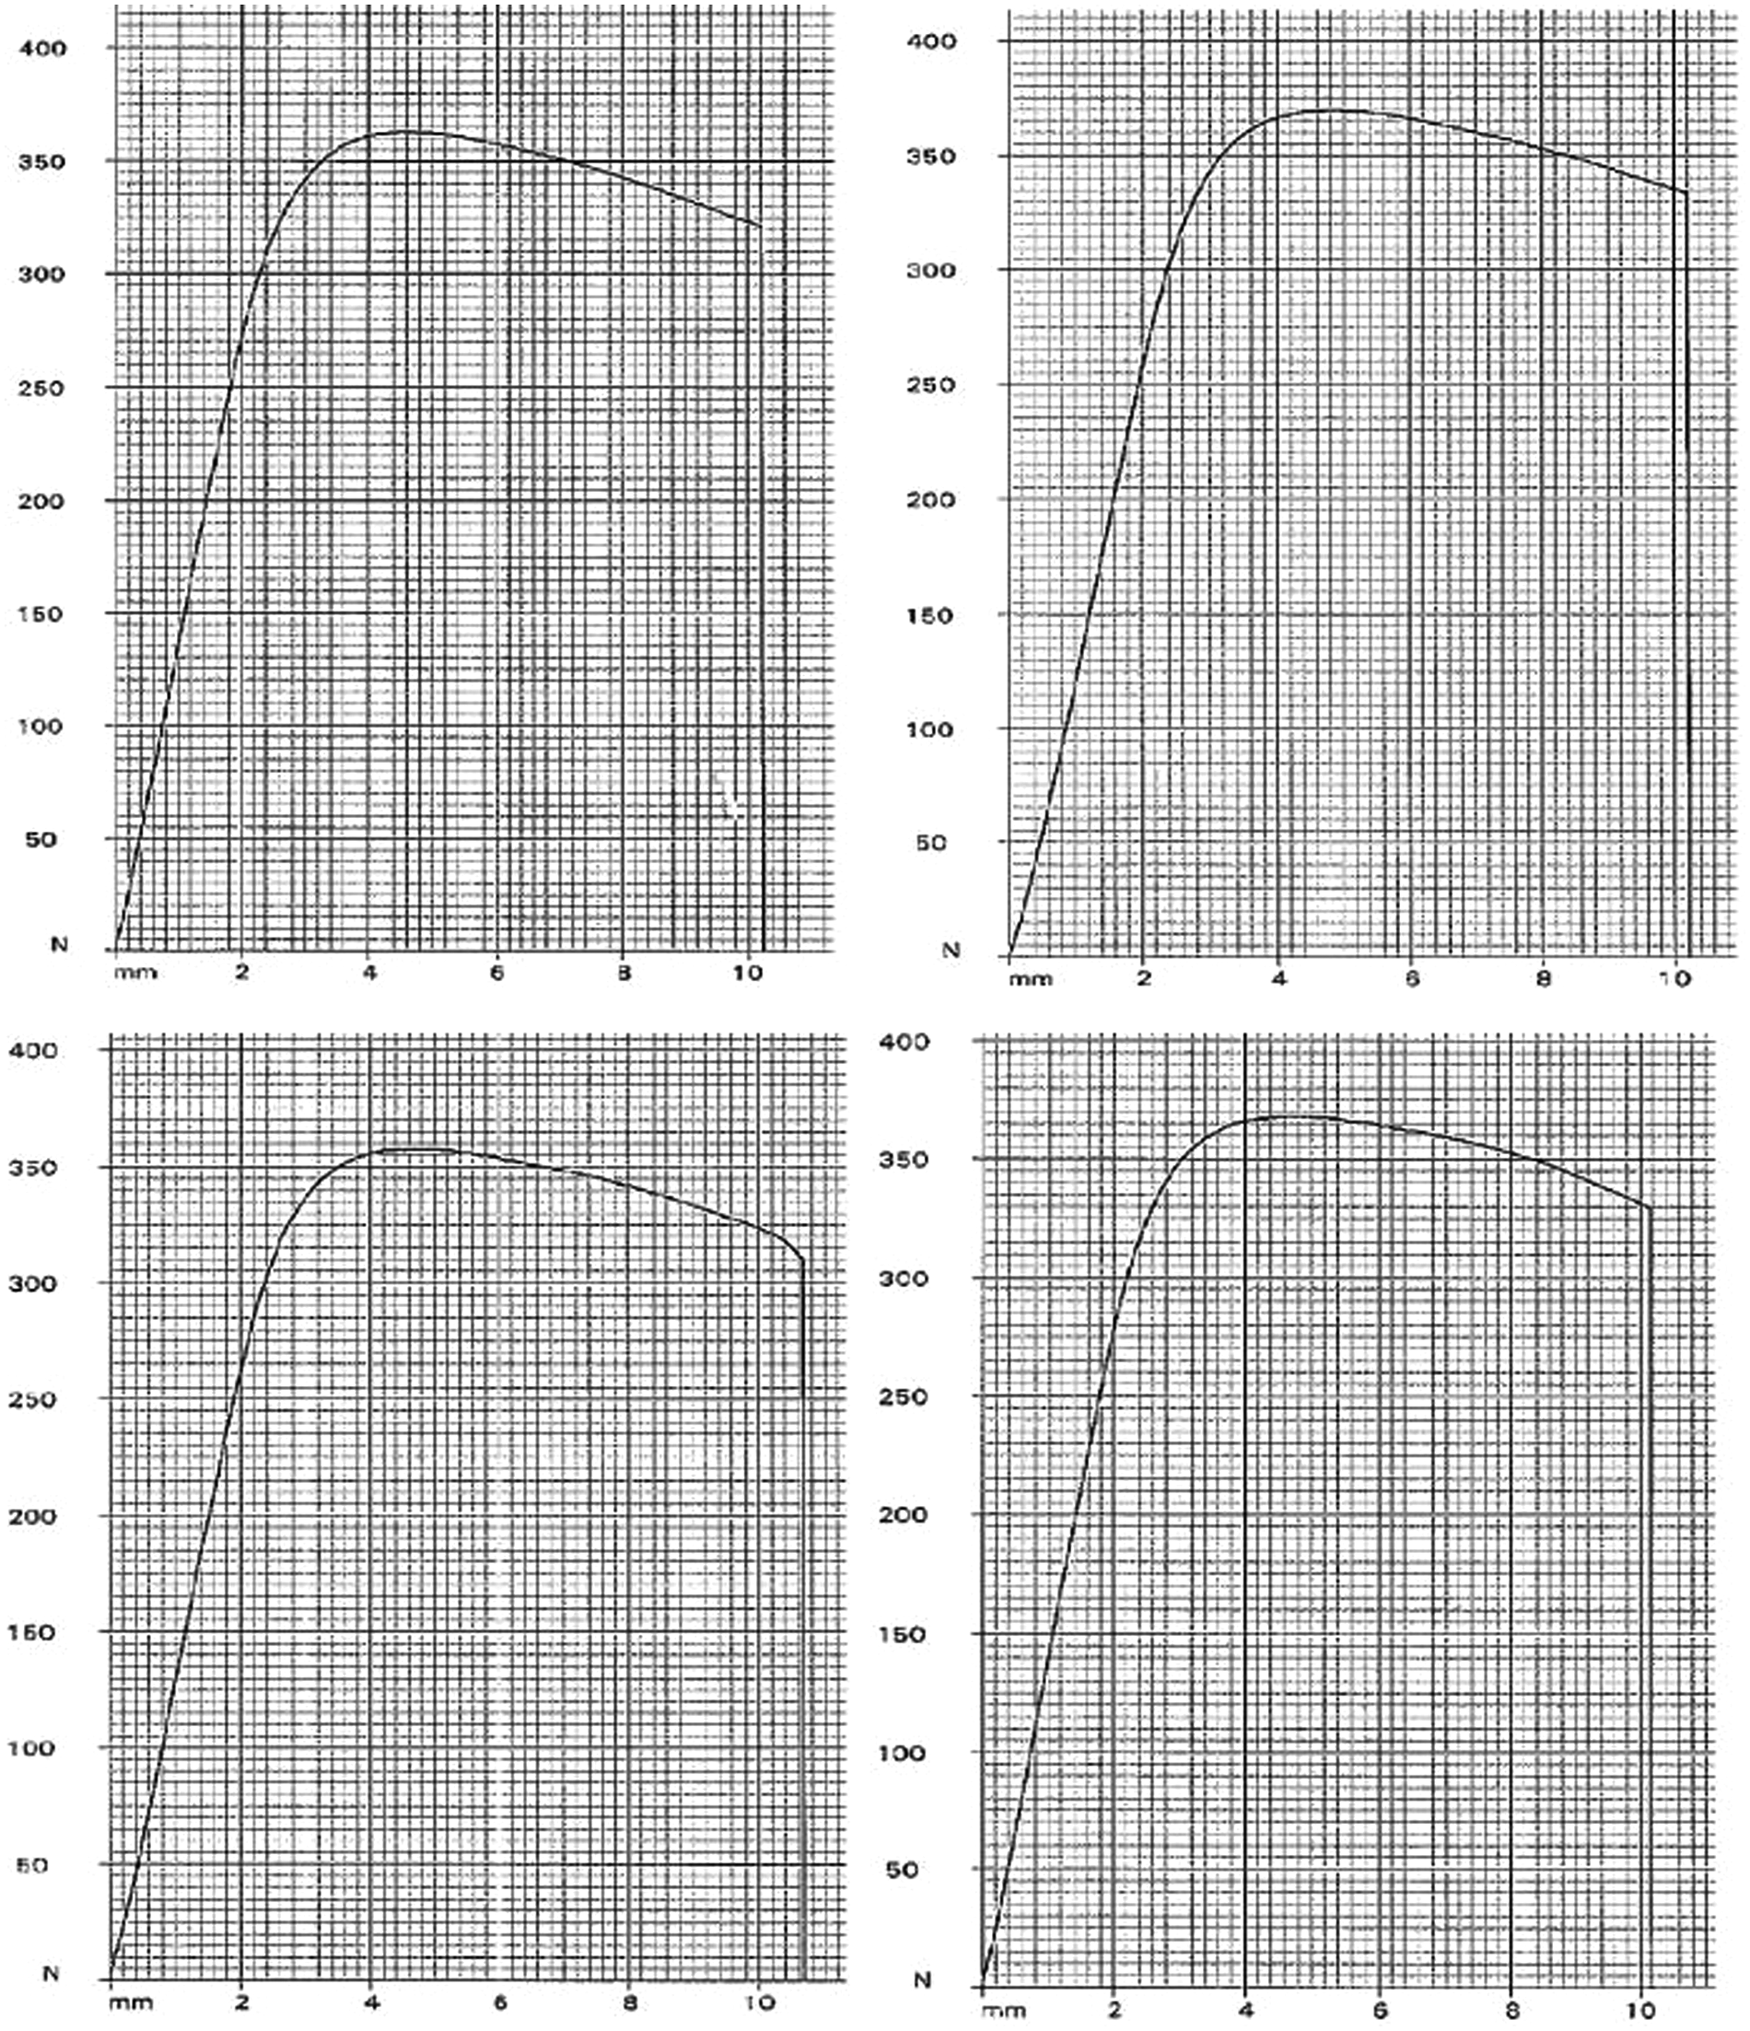
Load deflection diagrams from three-point bending tests of thinner layer parts with print speed at 45 mm/s. (Y-axis: Load (N) and X-axis: Deflection (mm))
Load deflection diagrams from three-point bending tests of thinner layer parts with print speed at 50 mm/s. (Y-axis: Load (N) and X-axis: Deflection (mm)).
Load deflection diagrams from three-point bending tests of thinner layer parts with print speed at 55 mm/s. (Y-axis: Load (N) and X-axis: Deflection (mm)).
Load deflection diagrams from three-point bending tests of thinner layer parts with print speed at 60 mm/s. (Y-axis: Load (N) and X-axis: Deflection (mm)).
Average values of maximum compressive loads obtained for various printing speeds and times listed in Table 1 are used for the plots, as shown in Figure 17, with the corresponding graphs based on analytical models juxtaposed, for direct comparison. Due to practical limitations with the experimental setup, the print speed could only be varied within a narrow range. Now, a comparison of the results in Figure 17 reveals a certain degree of correlation between analytical predictions and experimental results within the range of experimental factors. However, the experimental values tend to deviate much from the predictions by the analytical model at lower total time settings, or higher print speeds, probably due to problems associated with the synchronization of the extrusion and the actual print speeds, a limitation of the current test setup. The FDM test bed employed for the experiments uses a direct current (DC) motor for driving the extrusion head. The rate at which the filament can be driven is limited by the rate at which heating takes place, which in turn depends on the resistance of the heating element, which is fixed in this case. These limitations restrict the range of print speeds on the current system and development of a more flexible and sophisticated injection head and XY positioning system are the plans for the future. Also, thermal conditions, which are neglected in the current models, might be playing some role influencing the deviations between the two results.
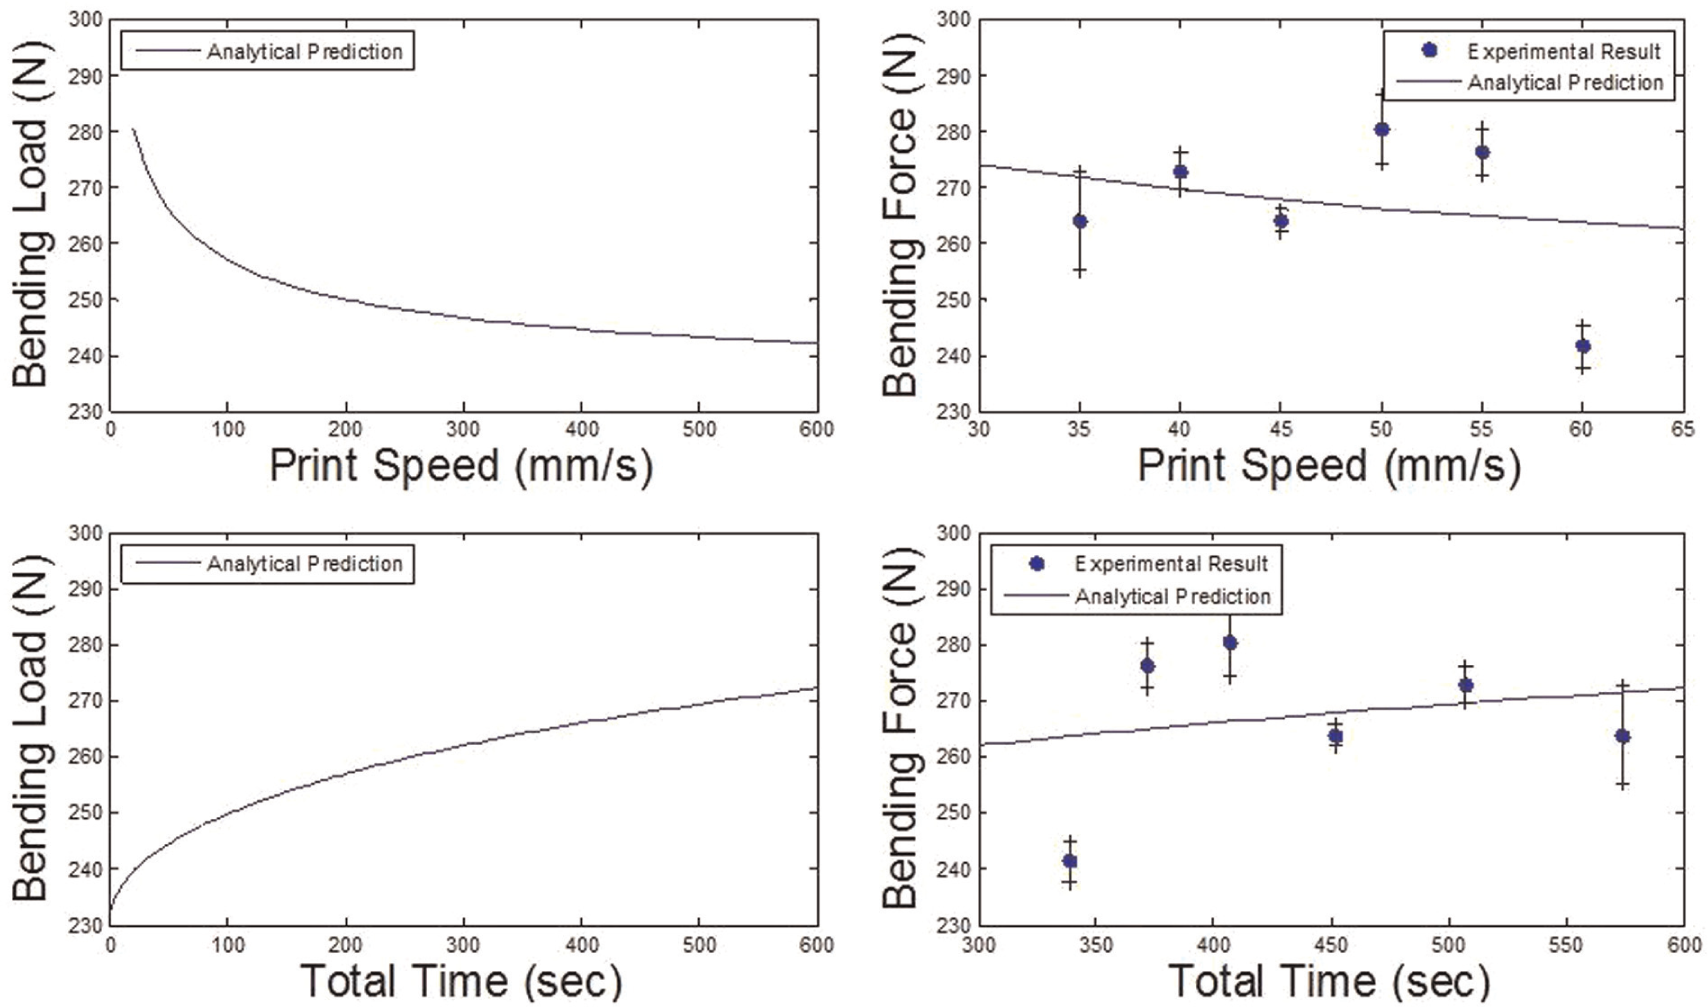
Comparison between analytical predictions and the experimental results using thinner layer printing (layer thickness of 0.5 mm).
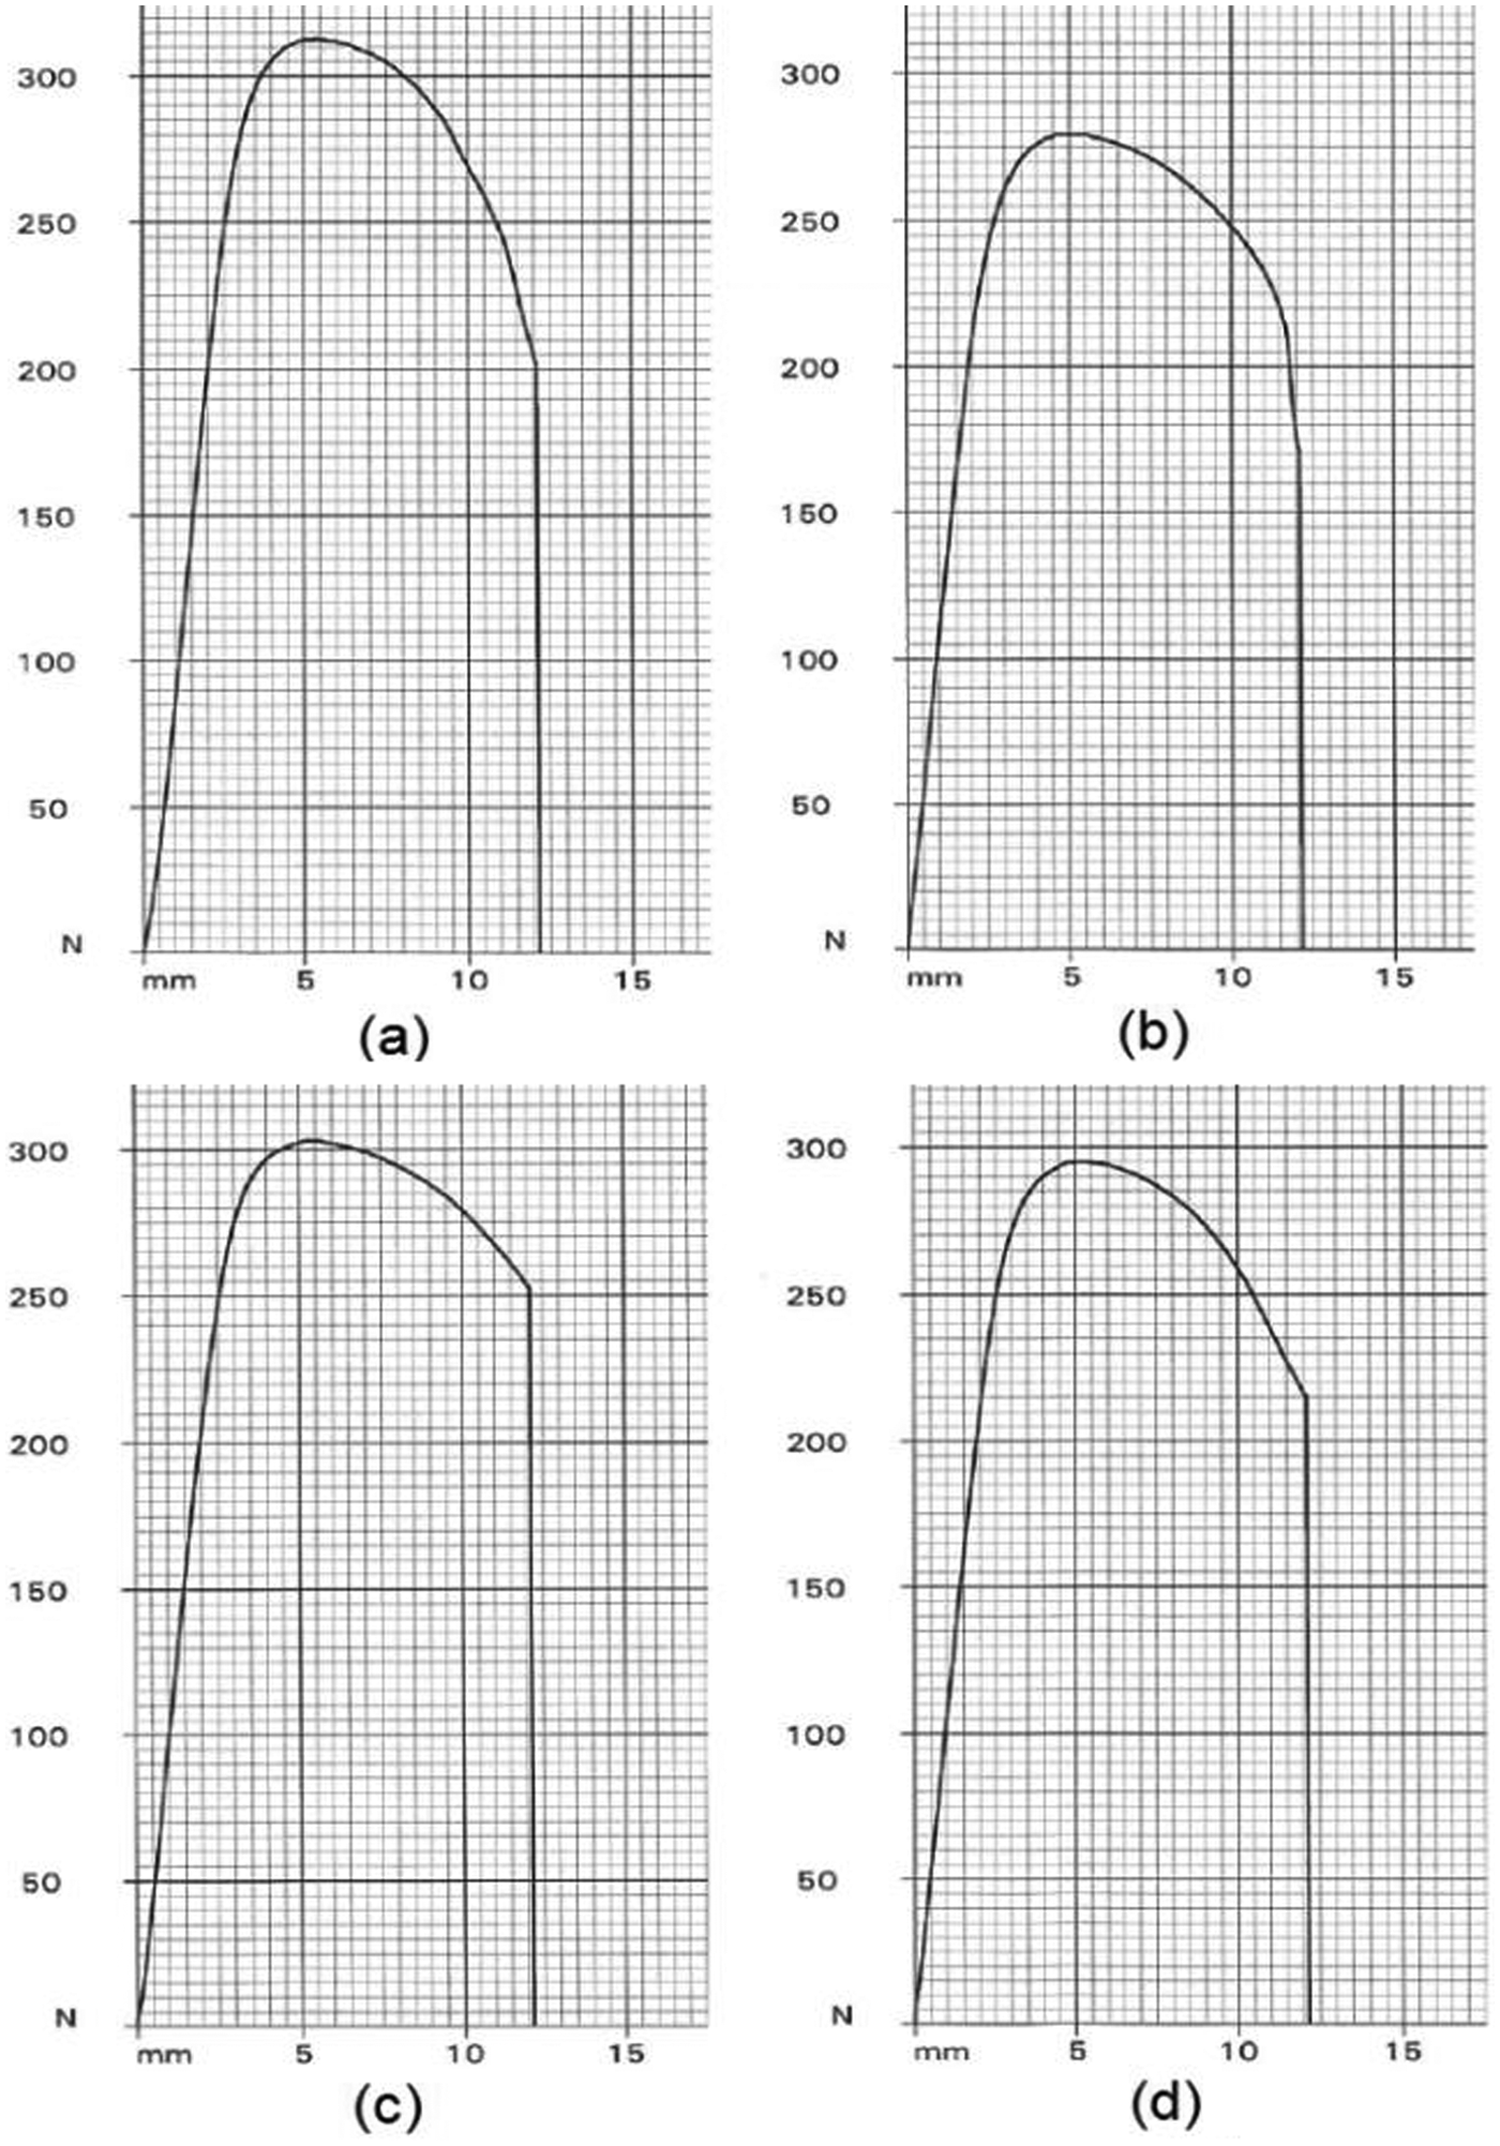
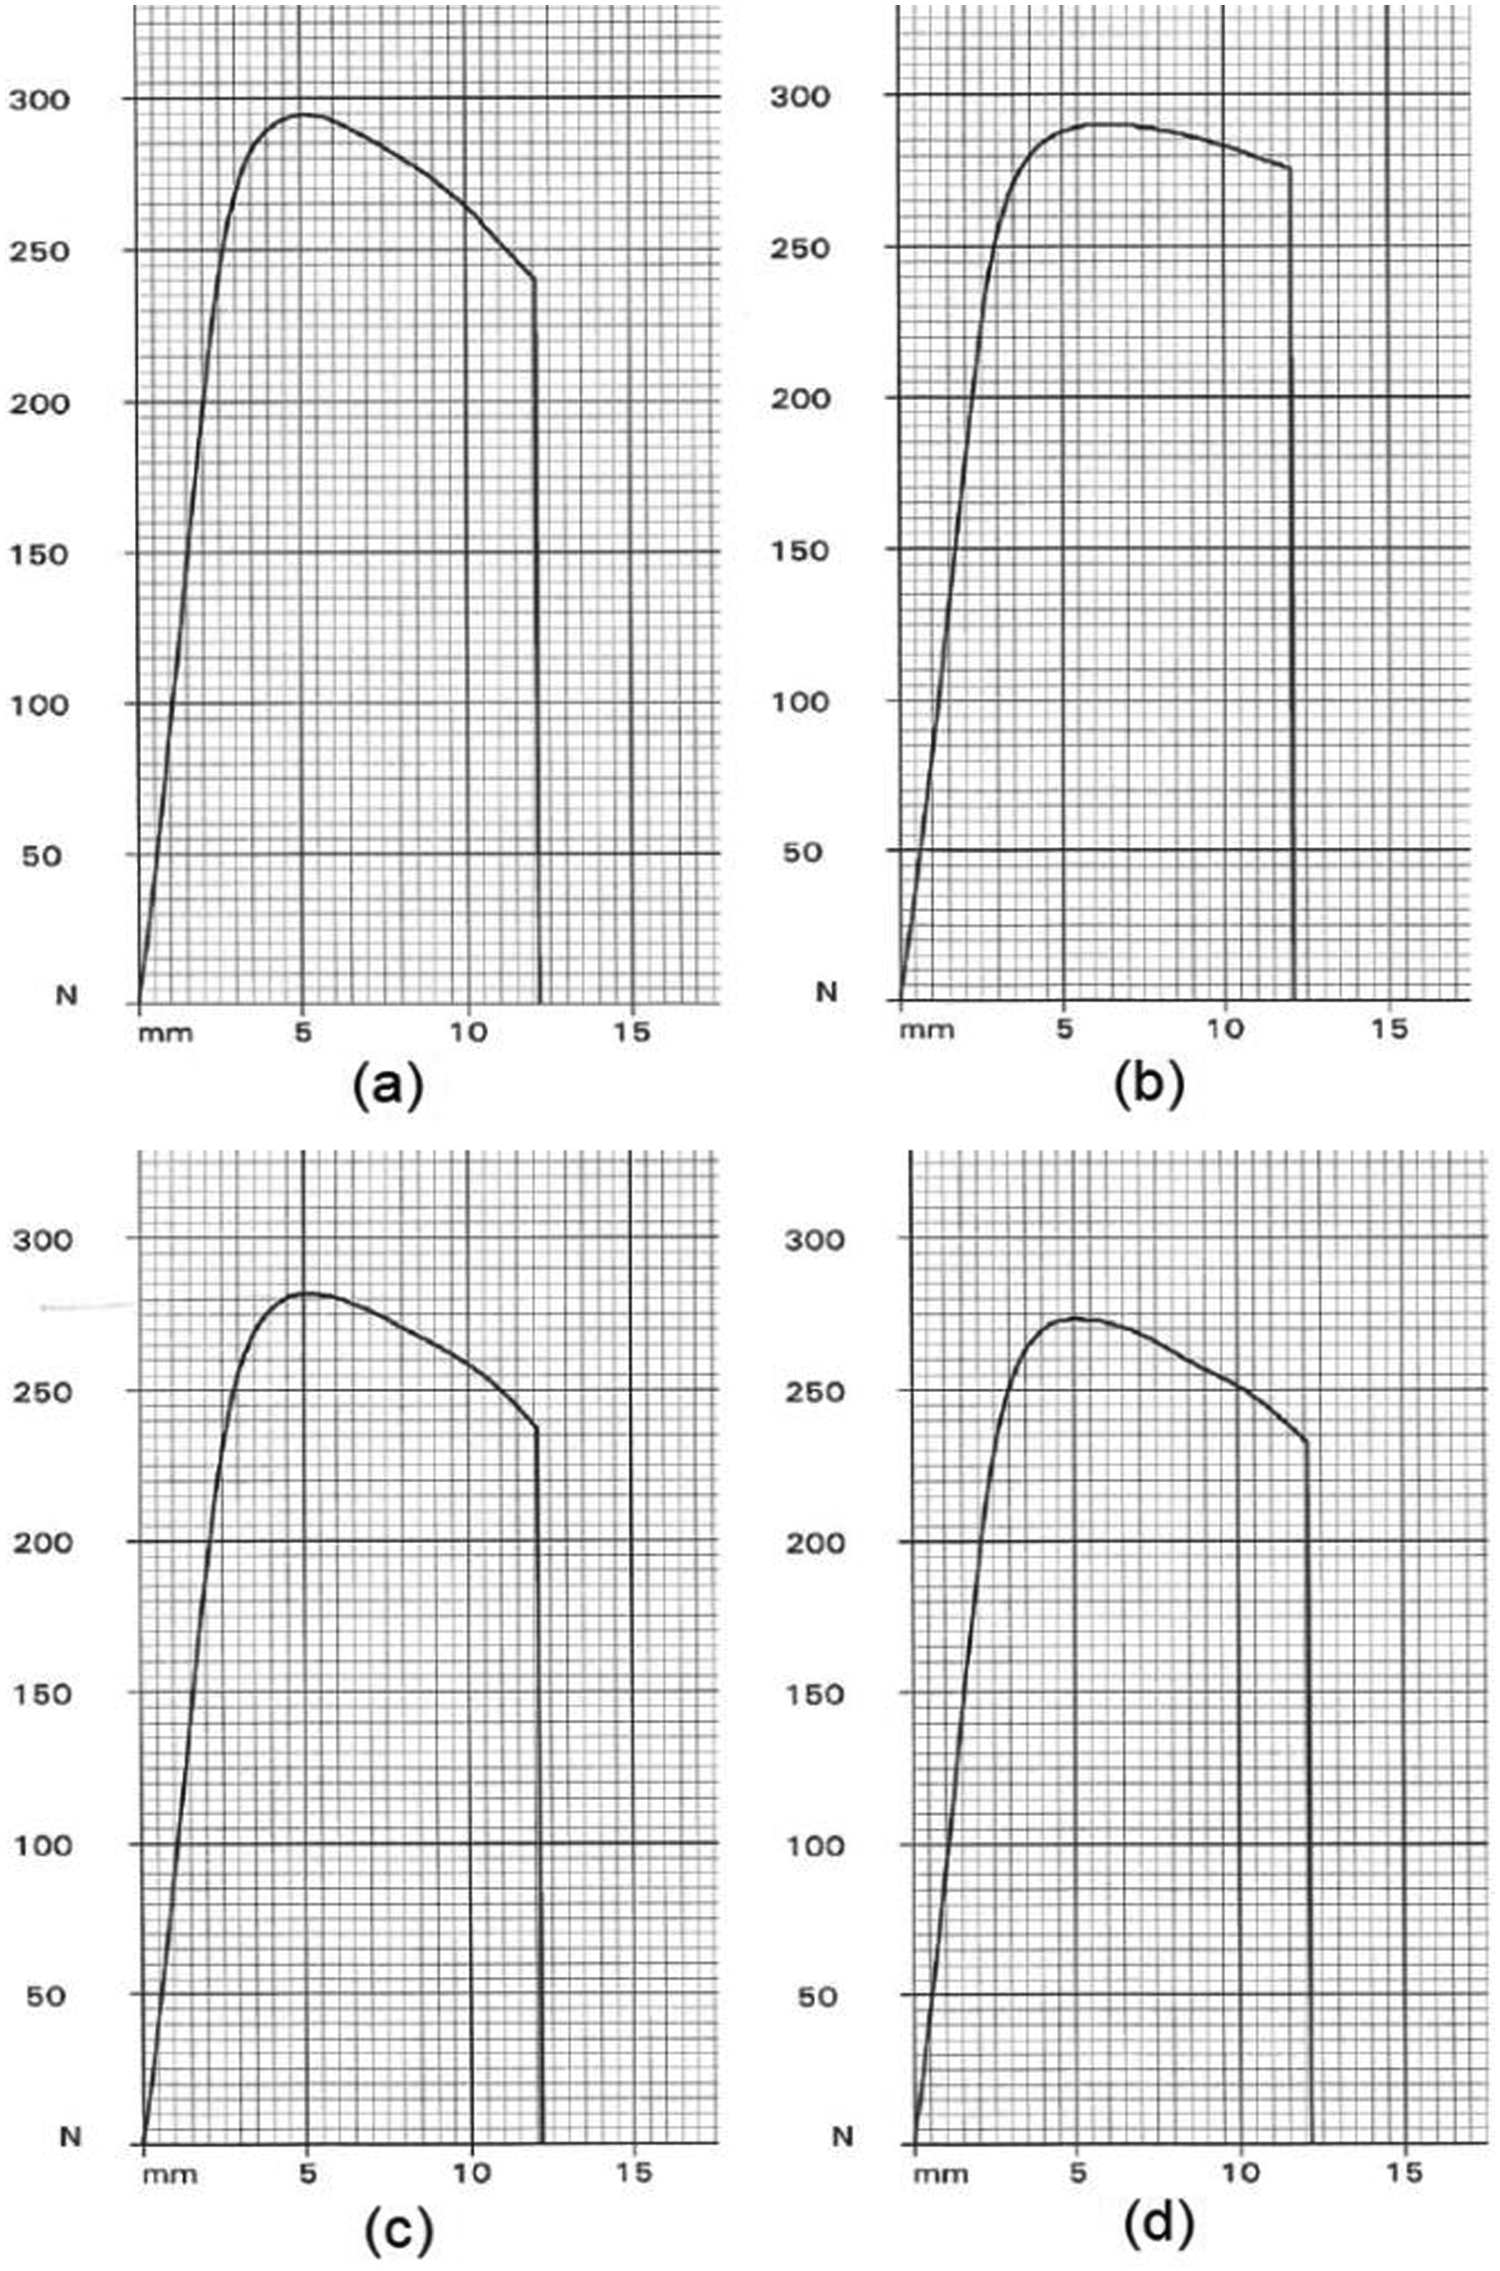
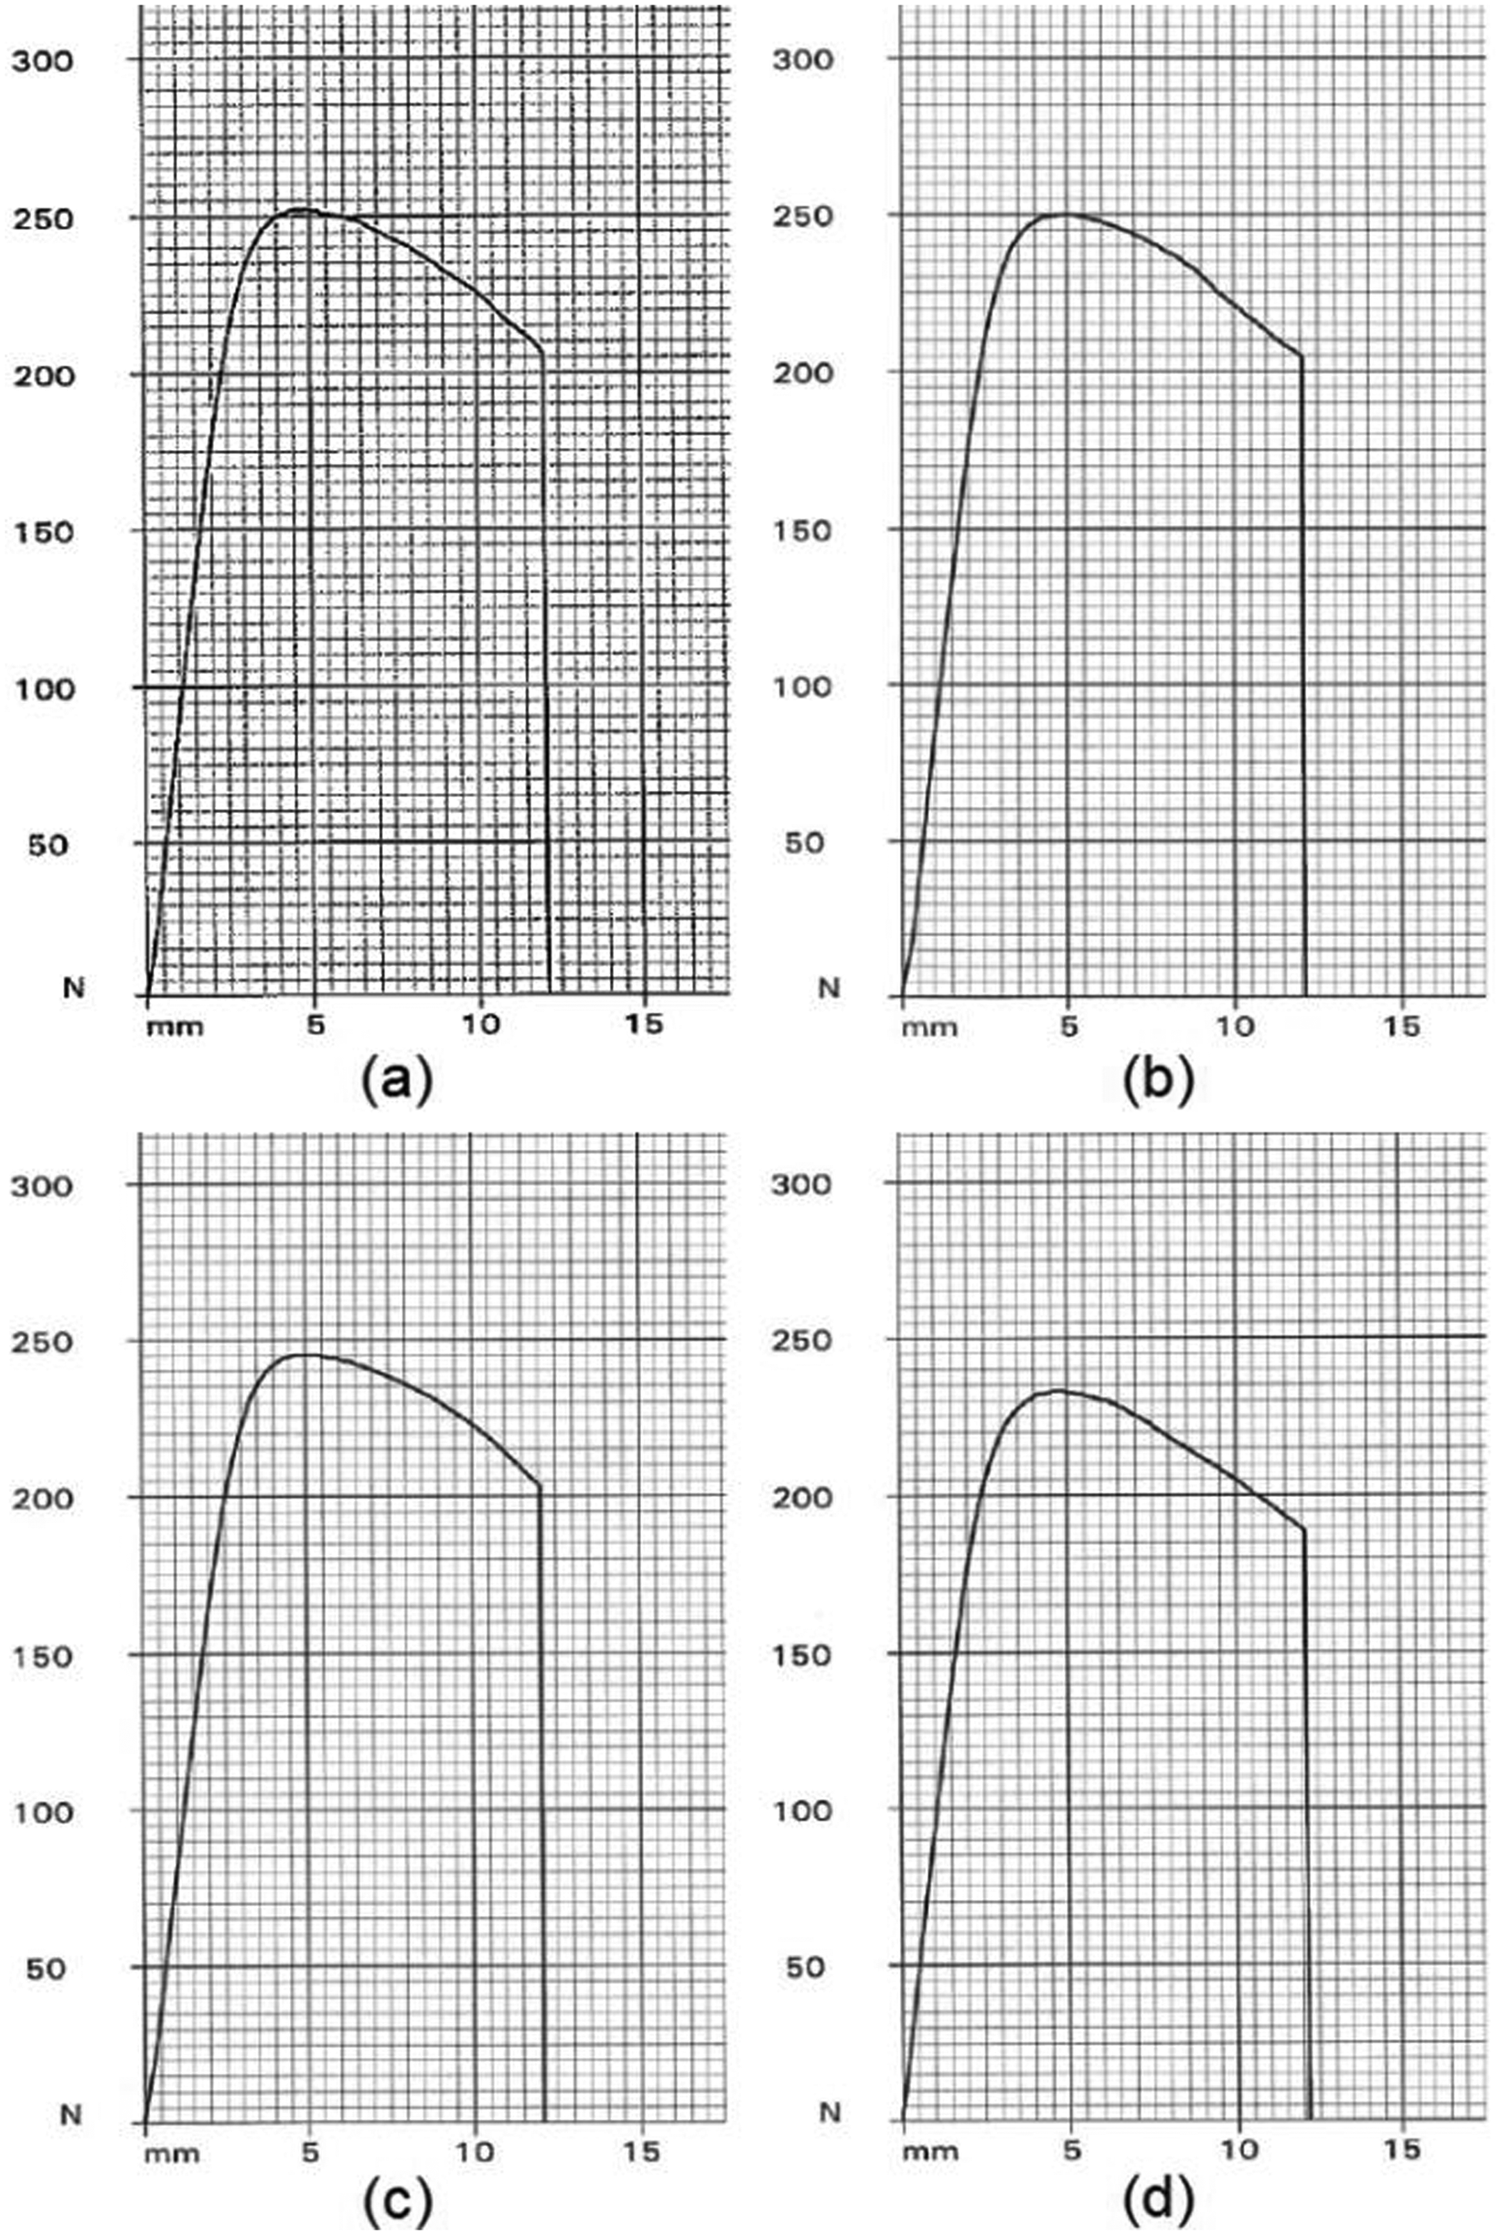
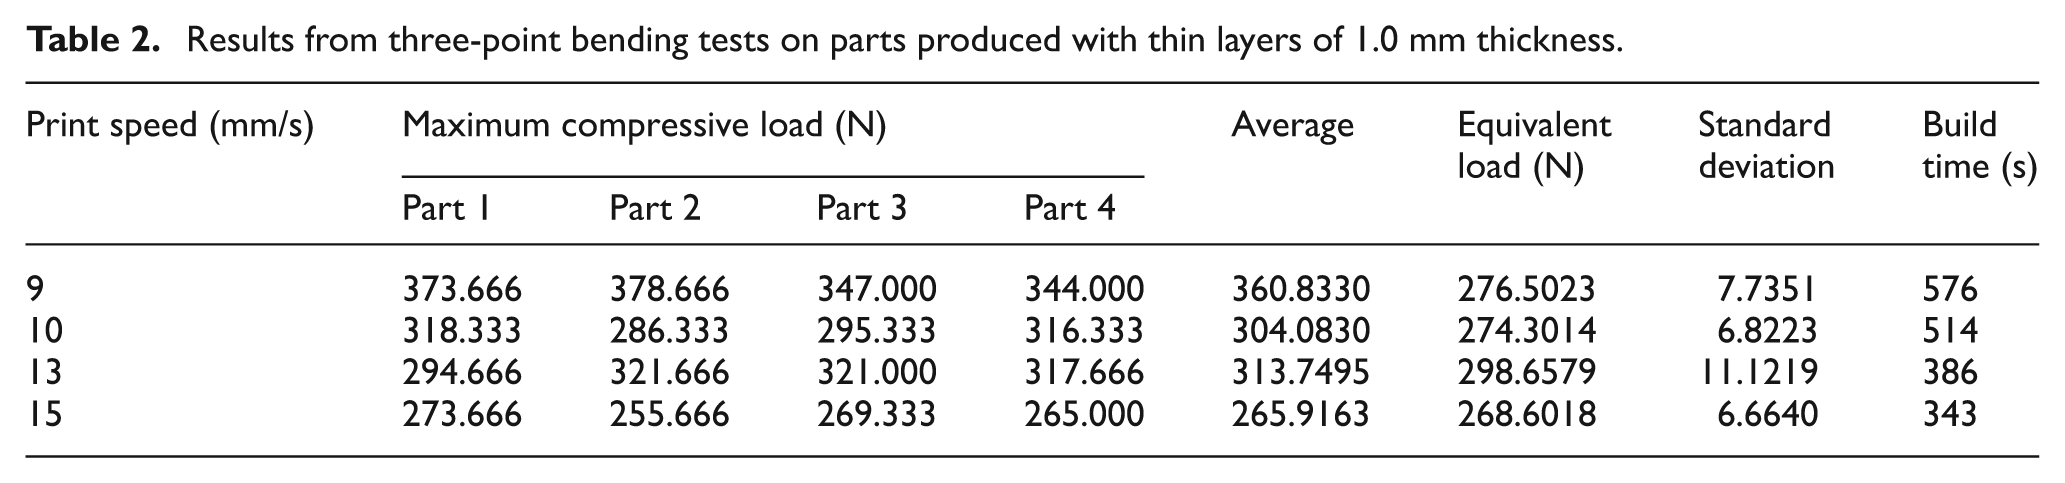
Further experimental proof of the influence of speed is obtained by printing test pieces with a larger filament size of 1.0 mm. Considering the material continuity, the best print speed range is found to be 13–15 mm/s for a filament size of 1 mm. Three-point bending test results based on thick layer specimens are obtained in similar lines as depicted above, and the results are consolidated in Table 2. As in the case of the thin layer samples, it is evident that the higher the speed of printing, the lesser is the average compressive load. Furthermore, the analytical predictions and the experimental results with thick layer samples also closely correlate, as shown in Figure 18.
Results from three-point bending tests on parts produced with thin layers of 1.0 mm thickness.
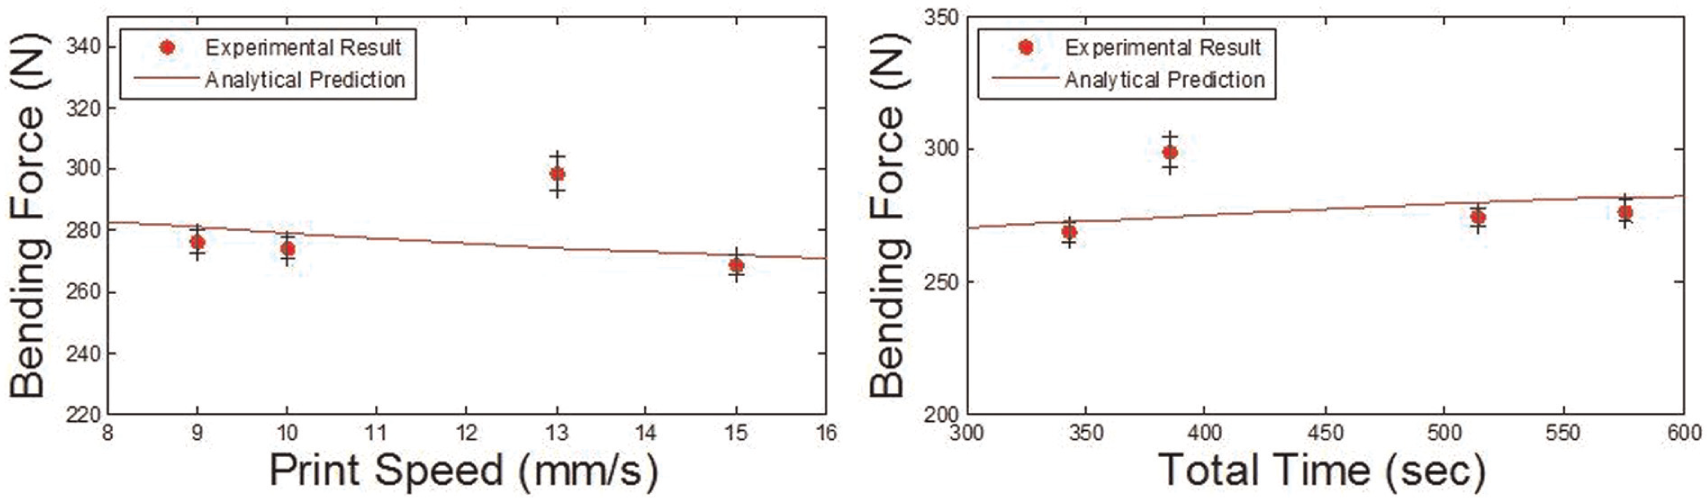
Comparison between analytical predictions and the experimental results using thicker layer printing (layer thickness of 1.0 mm).
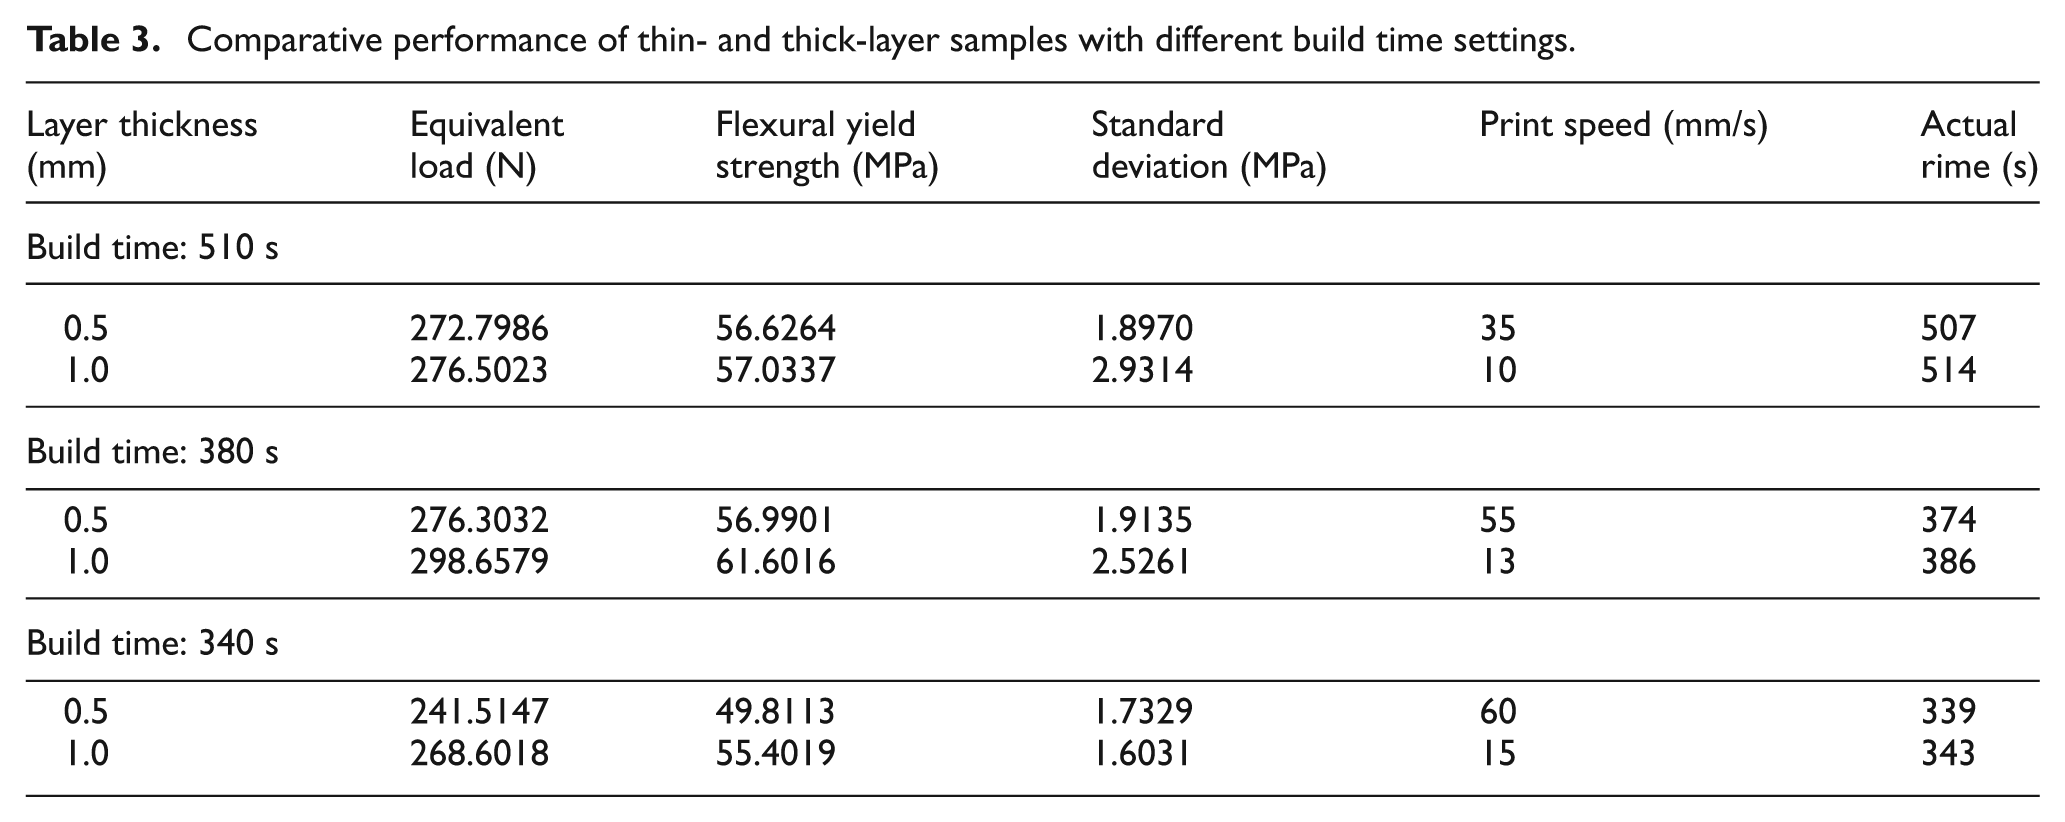
While validating the predictions based on analytical models, the experimental results also allowed an interesting observation on the effect of varying thickness with varying other parameters. For this, average compressive load data for specific print conditions from the above tests is collated and presented in Table 3. It may readily be observed that the average performance of thick layer samples is slightly higher than the thin layer samples for all the cases, which is against the popular belief in adaptive slicing literature that thin layers give the best results. This proves the hypothesis that print speed- and time-dependent coalescence must be taken into account while ascertaining the roles of alternative printing and slicing strategies in FDM.
Comparative performance of thin- and thick-layer samples with different build time settings.
Considering the experimental validation of both models proposed, the general trend in the variation of bending stress with both speed of printing and total time of printing is depicted in Figure 19. For a given speed of printing, thin layers lead to higher time and better coalescence, and in a similar fashion, for a given total time, thicker layers mean slower printing and better coalescence. While both models have their merits, it is necessary to use the most appropriate one, to provide meaningful explanations in a given situation. For example, Sabourin et al., 7 while analytically modeling adaptive slicing, suggested thicker layers for the internal details and thinner layers for external details of a given part with the best surface quality and total time of printing as the parameters for optimization. Considering the analytical and experimental observations made in the current article, it is clear that the strength will be lowered even in the case of thicker layer printing if the speed of printing is high. If a part is divided into external and internal regions, and if the surface quality is of importance and for a given overall strength of the part, the speed of printing for the external layers can be deduced using the speed model while the best time for printing internal details needs to be obtained from the time model.
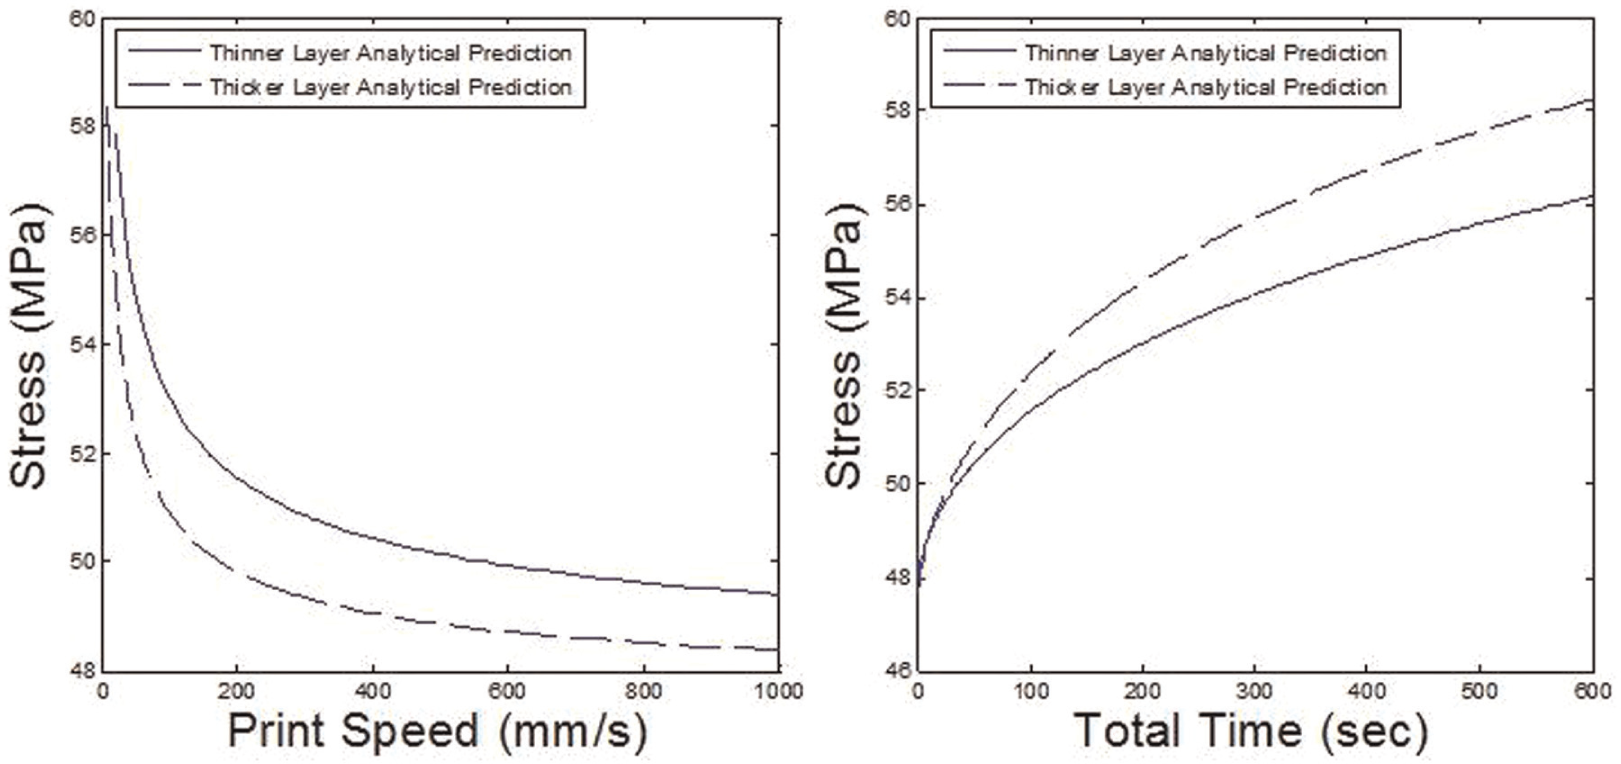
Stress versus print speed and print time on prediction produced with layers of thickness of 0.5 and 1.0 mm (part size of 50 mm × 20 mm × 4 mm).
Conclusion
Numerous adaptive slicing schemes targeting better parts appear in the literature on FDM, but most are mere mathematical models, with very little or no theoretical or experimental substantiation. Mathematical models based on moments of inertia of cross sections of specimens used in three-point bending tests are developed giving due consideration to the meso-structure. Effects of adaptive slicing are evaluated together with the speed- and time-dependent variation of the inter-road coalescence. Analytical models predict the moment of inertia and consequently the bending strength of parts to decrease with increasing print speed and the same to increase with increasing total print time, for a given filament size. Experimental results also confirmed the analytical predictions. With the time dependency of coalescence considered, it is evident that thicker layers actually give better mechanical properties, for a given total print time. Overall, adaptive slicing has a definite role in influencing the final part characteristics, but the true significance can only be realized by giving due consideration to the speed of printing, the time dependency of inter-road coalescence and the overall meso-structure.
Footnotes
Declaration of conflicting interests
The authors declare that there is no conflict of interest.
Funding
This research received no specific grant from any funding agency in the public, commercial or not-for-profit sectors.