
Abstract
The surface roughness assessment of 3D printed parts with Fused Deposition Modelling (FDM) has been performed on Acrylonitrile Butadiene Styrene, Poly Lactic Acid, Polycarbonate, Nylon, Polypropylene, Co-polyester. Three different geometries were selected i.e., Cube, Cone and Strip to evaluate the effect of build geometry and material on the surface roughness of 3D printed parts of FDM technology. It has been revealed from the roughness measurements of cube and cone samples, that roughness values are higher as compared to strip sample and in almost the same range in the build direction irrespective of the shape. The variation of surface roughness as a function of nozzle temperature has also shown that it is also dependent on the nozzle temperature while keeping other parameters constant. The experiments on the improvement in the surface quality of FDM parts was also performed using chemical and physical methods. Tetrahydrofuran, Dichloromethane and Acetone were found compatible with polycarbonate to improve surface without compromising the geometrical shape. Similarly Acrylonitrile Butadiene Styrene had excellent response to Acetone vapour smoothing both in terms of surface roughness and part symmetry. The surface roughness of PLA was also improved after treatment with Tetrahydrofuran. Co-Polyester, although had good surface after treatment with Tetrahydrofuran and Dichloromethane, but the part symmetry was disturbed.
Introduction
All 3D printing or additive manufacturing processes are based on layer-by-layer deposition of materials that may be plastics, ceramics and metals. In spite of all benefits of 3D printing technologies over traditional methods, it has one critical limitation of surface quality that depends on the materials, build parameters, part geometry etc.1–3 It is highly desirable that the build parameters should be selected in a manner that may help to minimize the surface roughness of the as-build parts,4,5 however, the surface roughness cannot be eliminated altogether. On the other hand the surface roughness may be different for different geometrical shapes such as rectangles, spheres, cones, discs etc. In order to further improve the surface quality of 3D printed parts various post processing methods are employed. 6 The fused deposition modeling is an extrusion based technology that uses thermoplastic materials, which are deposited in semi molten form following a CAD model. The resulting part has prominent layer lines that may be removed either by abrasive or chemical methods. The chemical method is however, more useful for parts with complex features. Since, the advent of FDM technology Acrylonitrile Butadiene Styrene (ABS) is the most extensively used material for prototyping purpose. The method of chemical surface smoothing of ABS is well established that is accomplished by using dipping or vapor exposure of 3D printed parts to acetone. However, with the progress in FDM technology, 3D printing of other engineering polymers such as polycarbonate (PC), nylon, copolyester (CPE), polypropylene, PEEK etc. has become possible. In this scenario, the need for the development of post processing methods to improve the surface of new polymers has been also arisen. Acetone is not suitable for all type of polymers, it is therefore, required that combination of processes may be devised that may help to eliminate the layer lines of the 3D printed parts without compromising their geometrical tolerances. This paper has been divided in two parts; in the first part the effect of the part geometry on the surface roughness has been evaluated, whereas in the second part results of the treatments applied to 3D printed samples ABS, PC, Nylon, CPE, and PLA polymers for mitigation of their surface roughness are presented.
Materials and methods
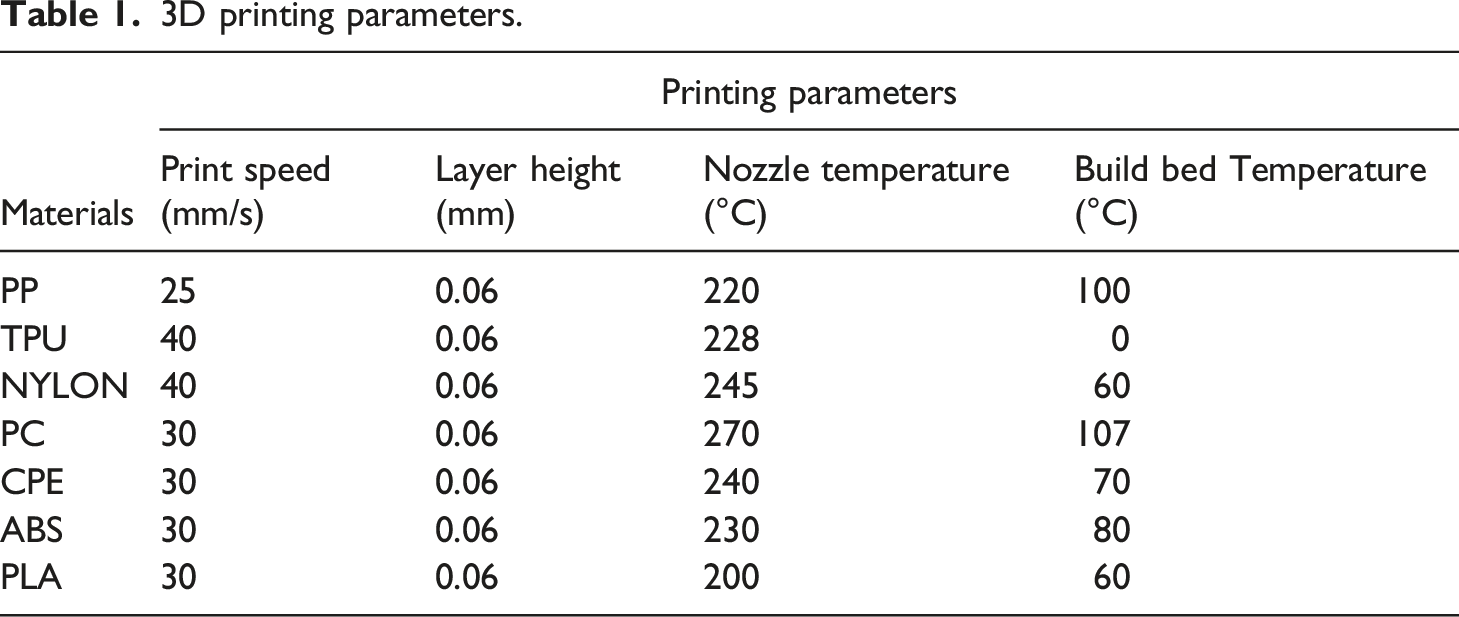
3D printing parameters.
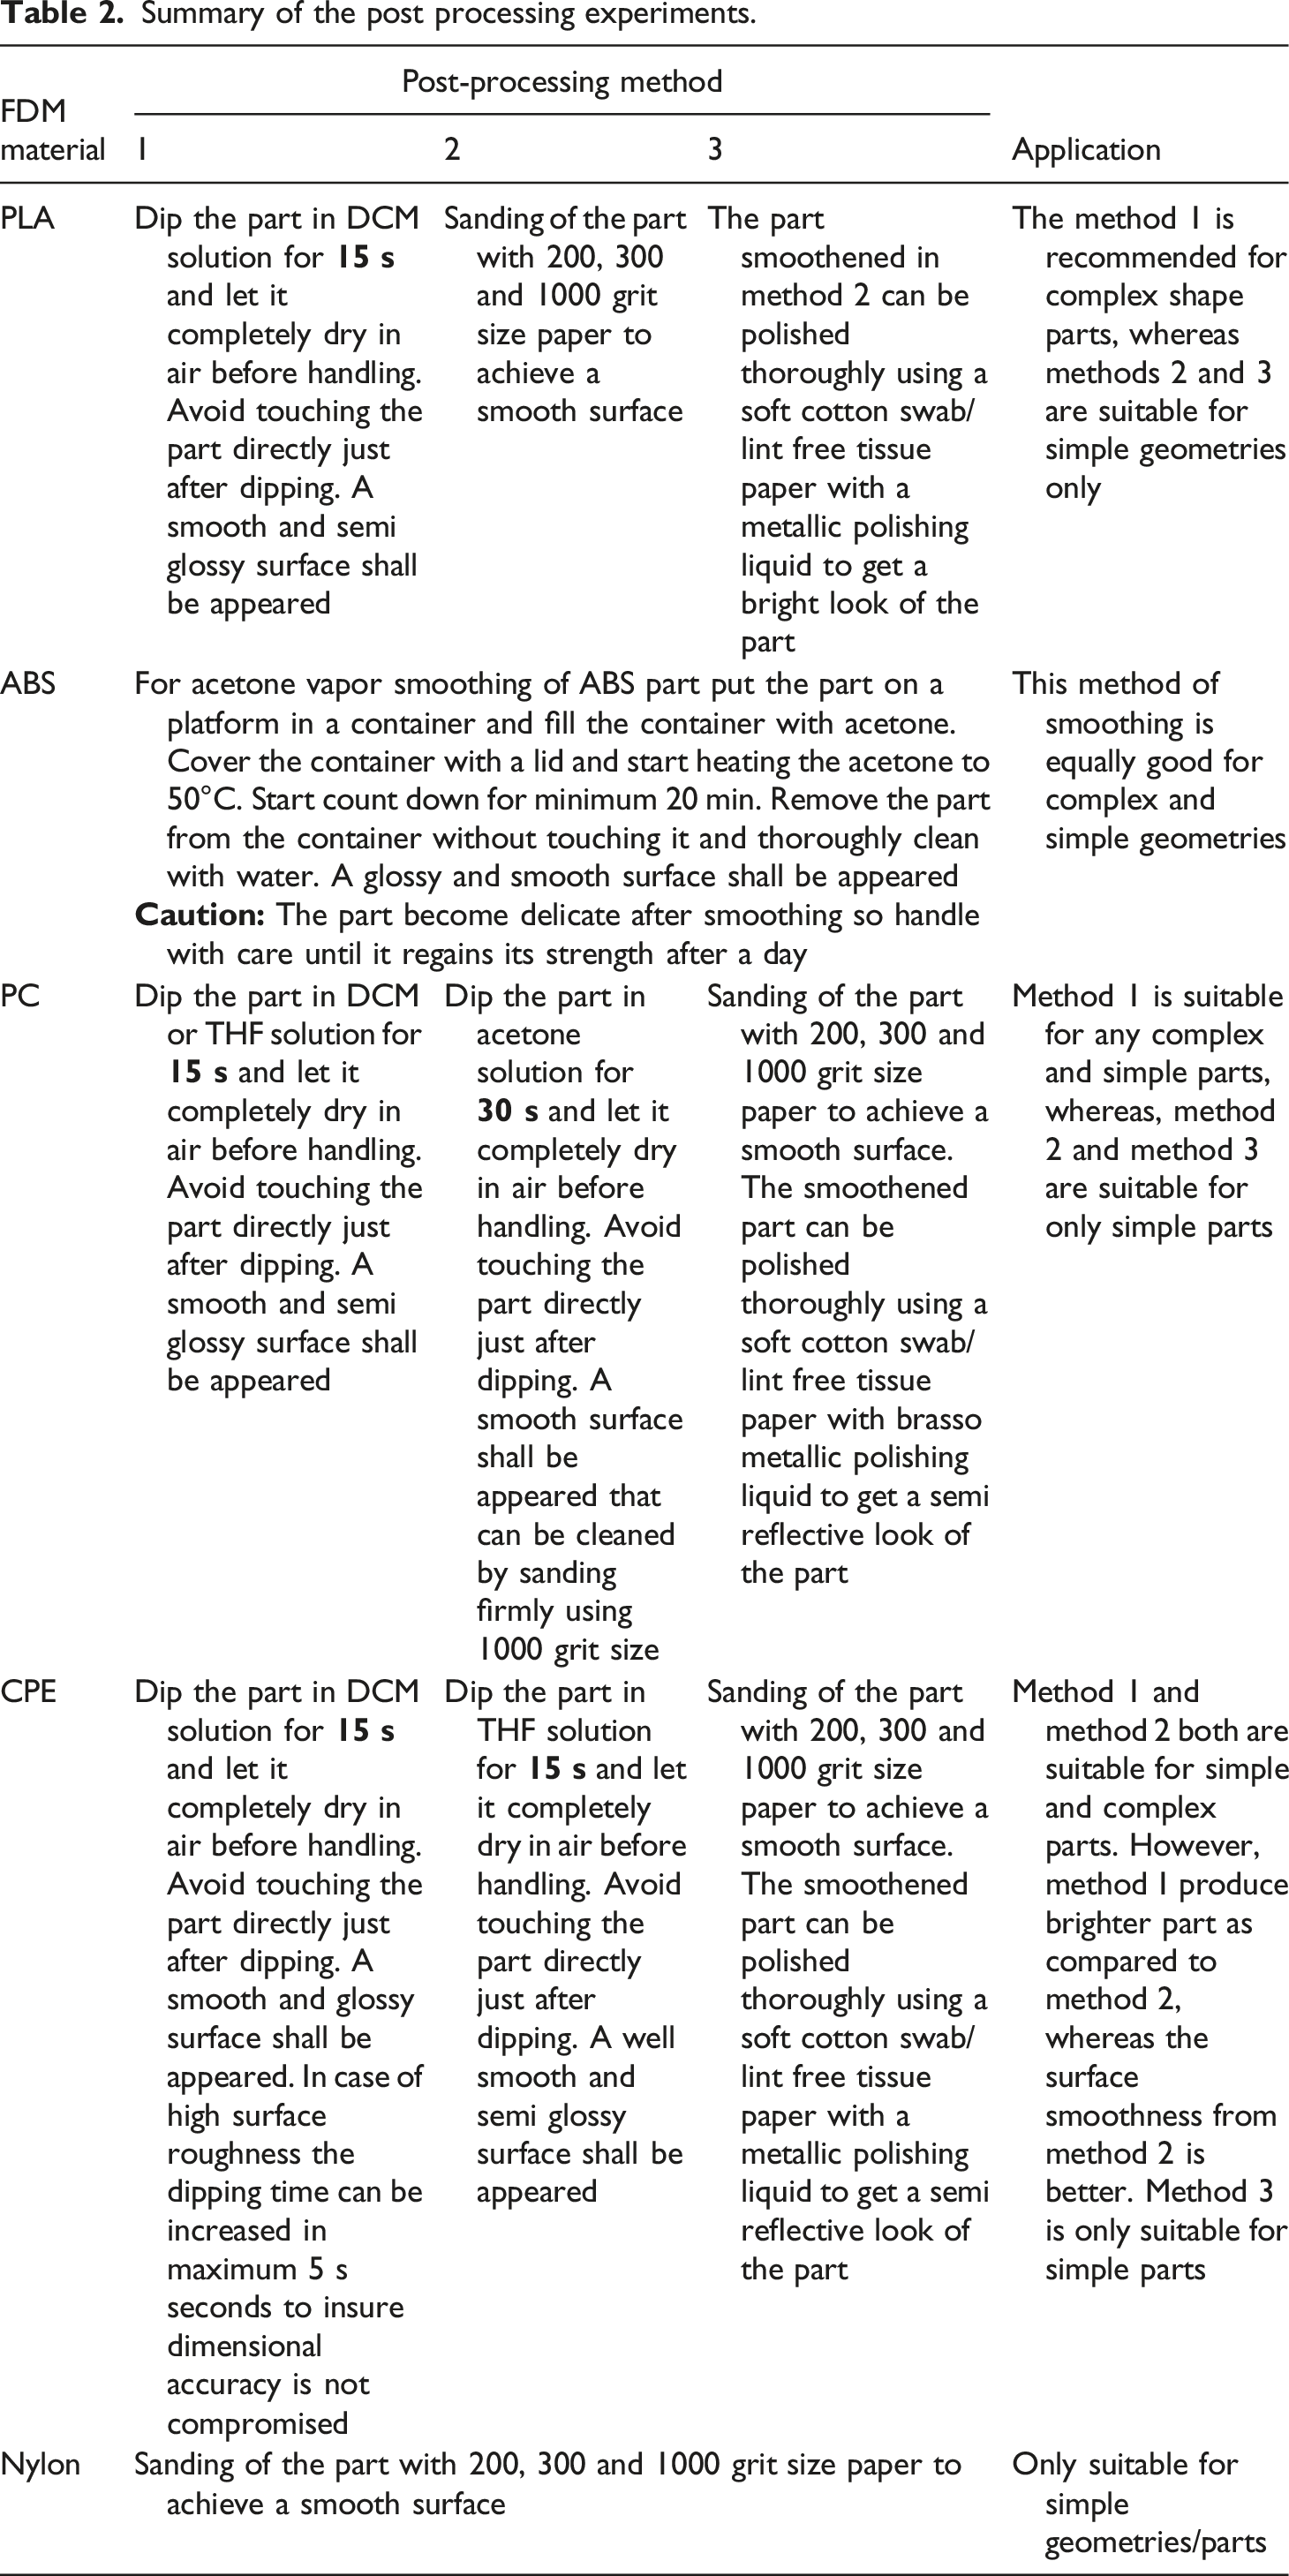
Summary of the post processing experiments.
Results and discussion
Roughness evaluation of different geometries
Three different geometries were selected for the study of geometrical effect and printing parameters on the surface roughness of FDM parts. The FDM parts printed in ABS are shown in Figure 1. Three shapes selected for the experiments.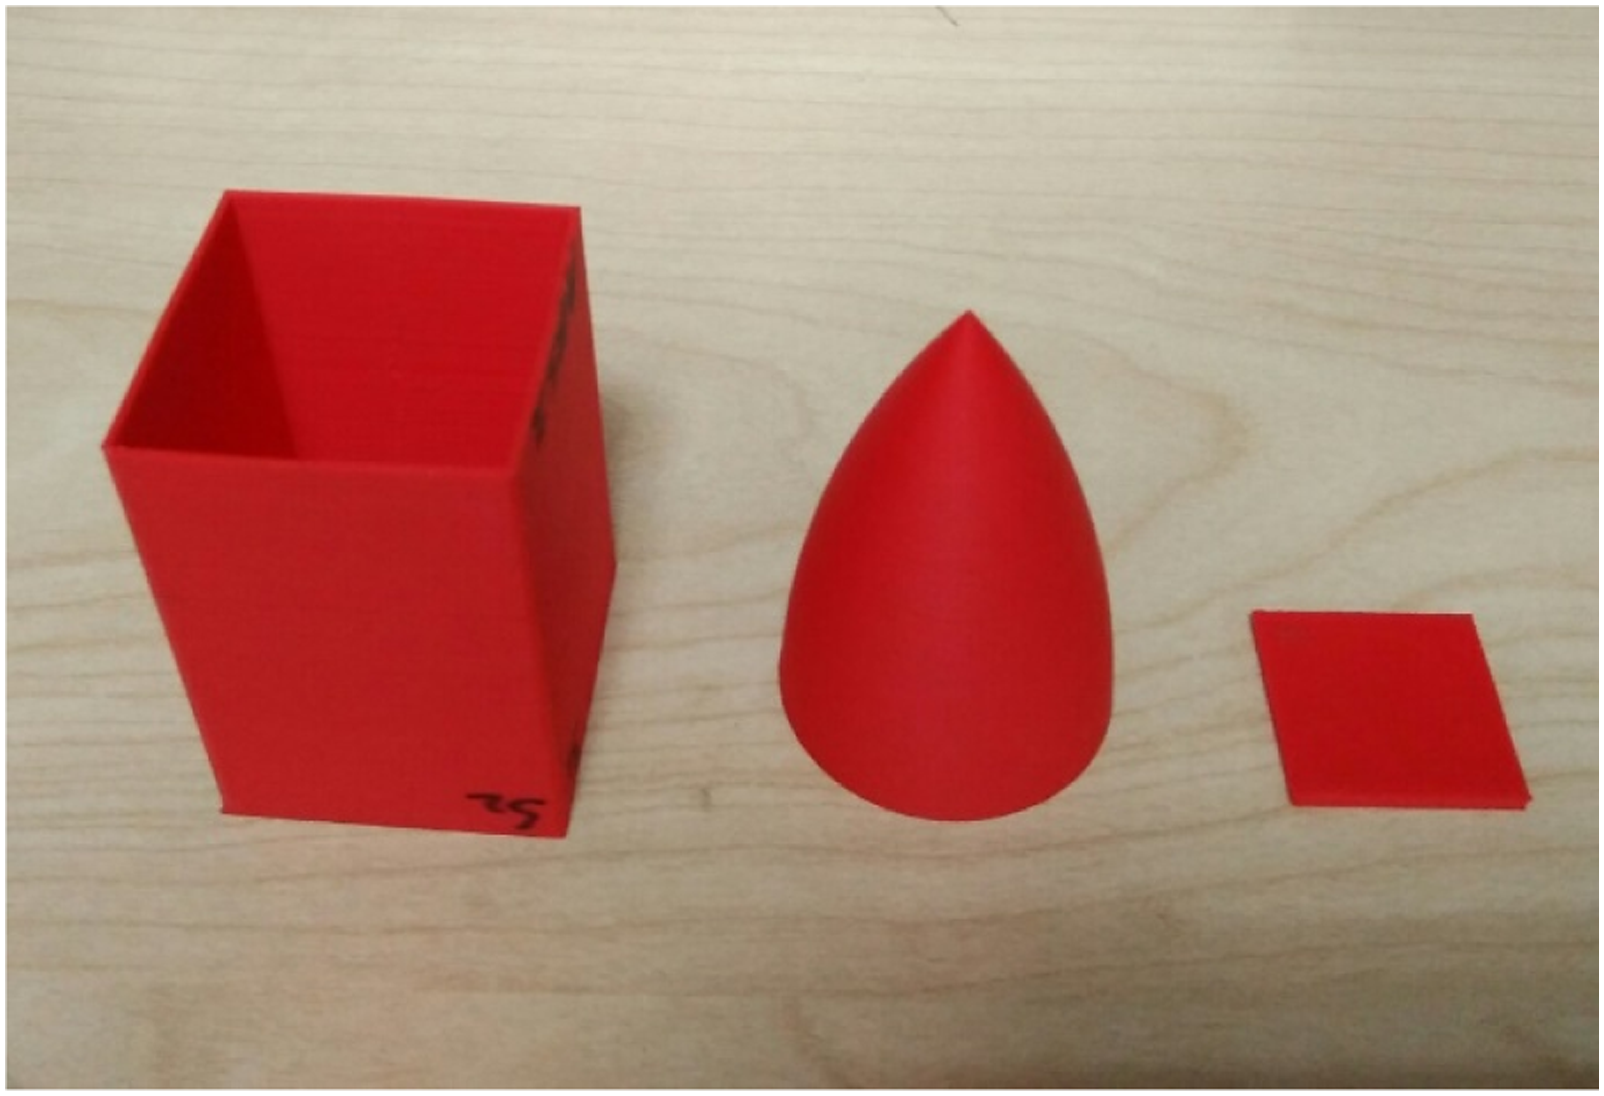
The roughness is a consequence of peaks and valleys that is dependent on the materials processing route adopted. In 3D printing (Additive Manufacturing) the origin of surface roughness lies in the layer by layer manufacturing process.
7
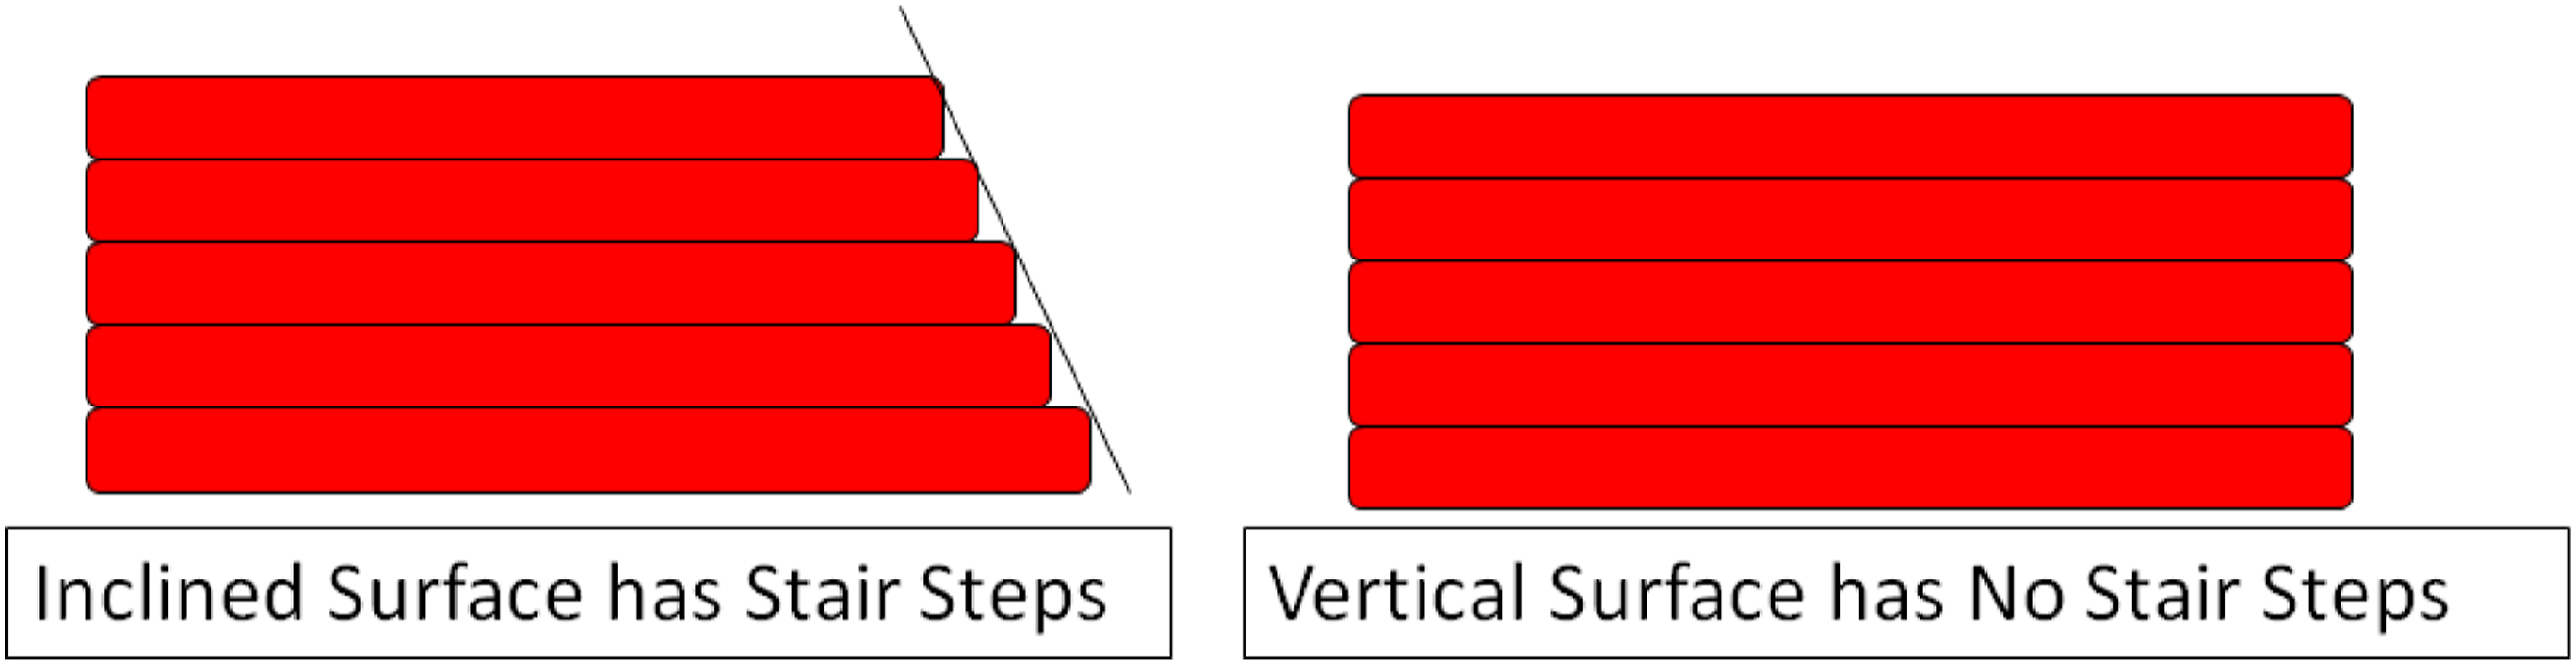
In extrusion based process (i.e., Fused Deposition Modeling) the surface roughness depends on the diameter of the thermoplastic polymer filament that is used to make a 3D printed part. Higher the diameter of the filament higher will be the size of peaks and valleys as depicted in Figure 2. The size of the peaks and valleys depends on the secondary 3D printing parameters such as layer thickness, surface angle, orientation, nozzle temperature etc.8–10 The surface roughness in FDM becomes worse in inclined surface because of a stair stepping effect as shown in Figure 3. Due to the “stair steeping effect”, surface roughness is very high on inclined surface.
11
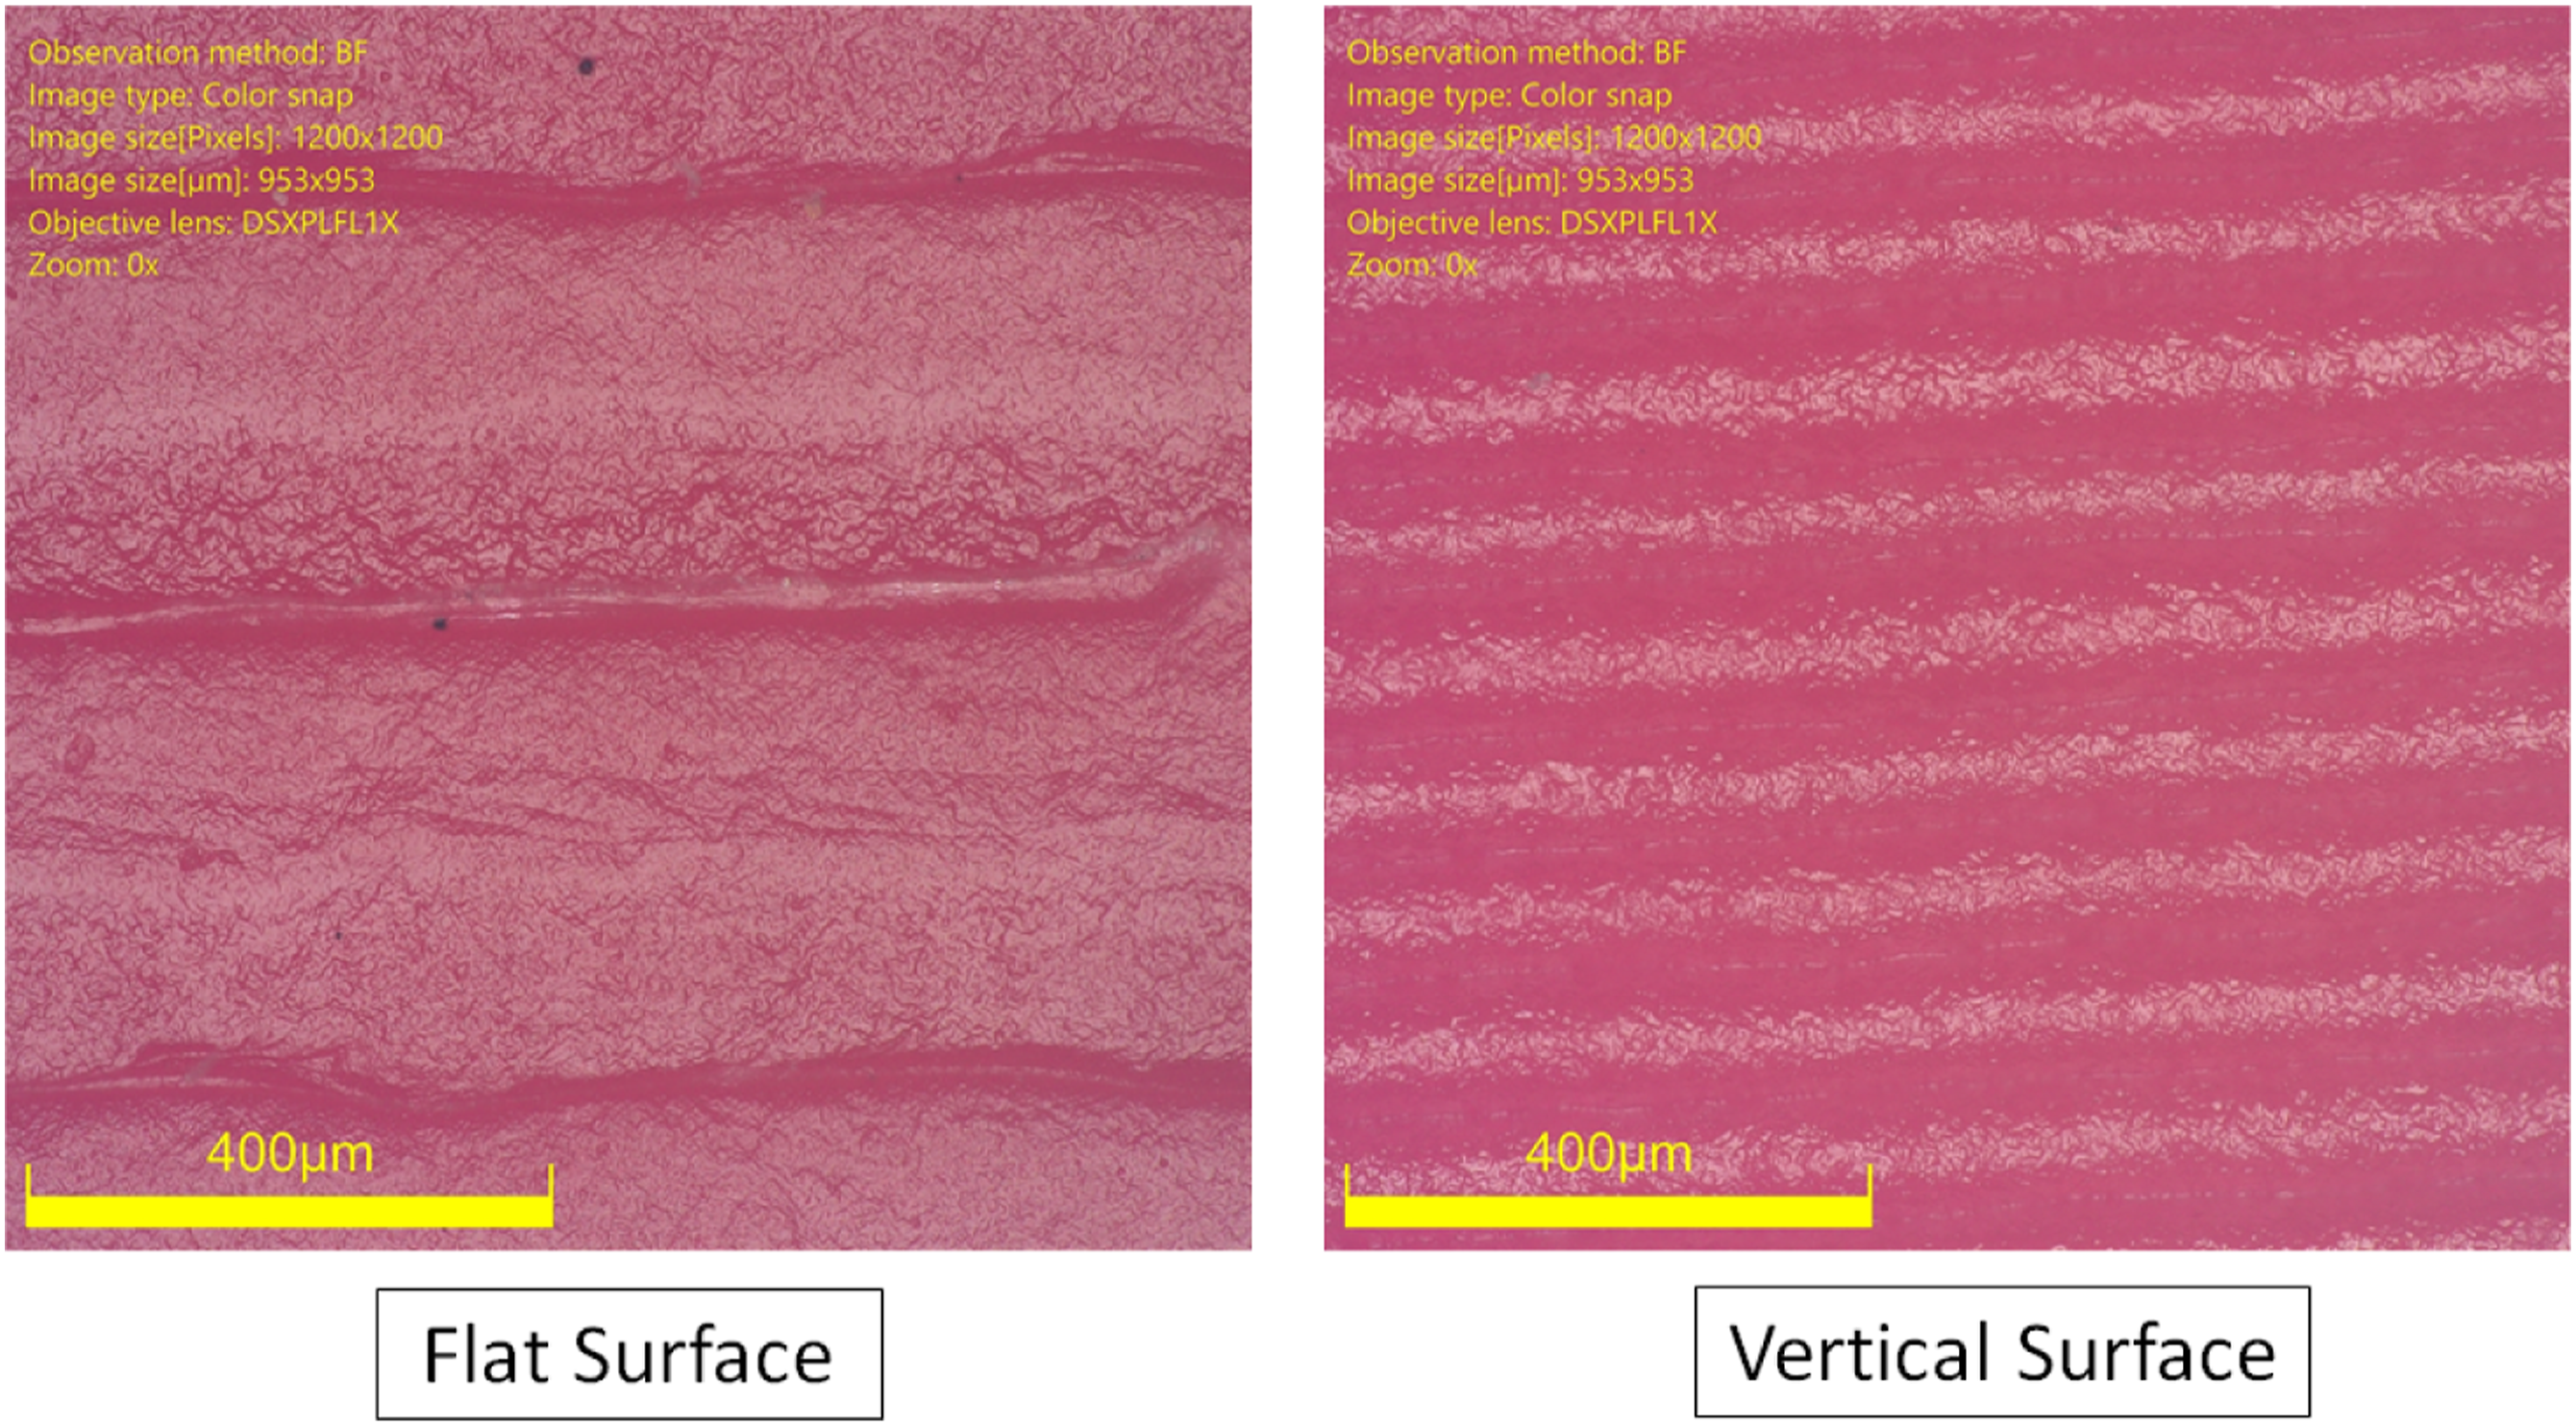
Whereas the horizontal surface has better surface roughness as compare to vertical surface for every layer thickness.
12
In the horizontal plane the deposited polymer layers have elliptical cross section that reduces the in-plane surface roughness by bridging the gap between layers; this effect is more pronounced when the layer thickness is further decreased.12,13 The difference between the microstructure of the horizontal and vertical planes of an FDM specimen is shown in Figure 4. Schematic showing the effect of filament diameter on the peaks and valleys in a 3D printed part. Schematic showing the staircase effect in the 3D printed inclined surfaces. Comparison of flat and vertical surfaces of a 3D printed ABS part.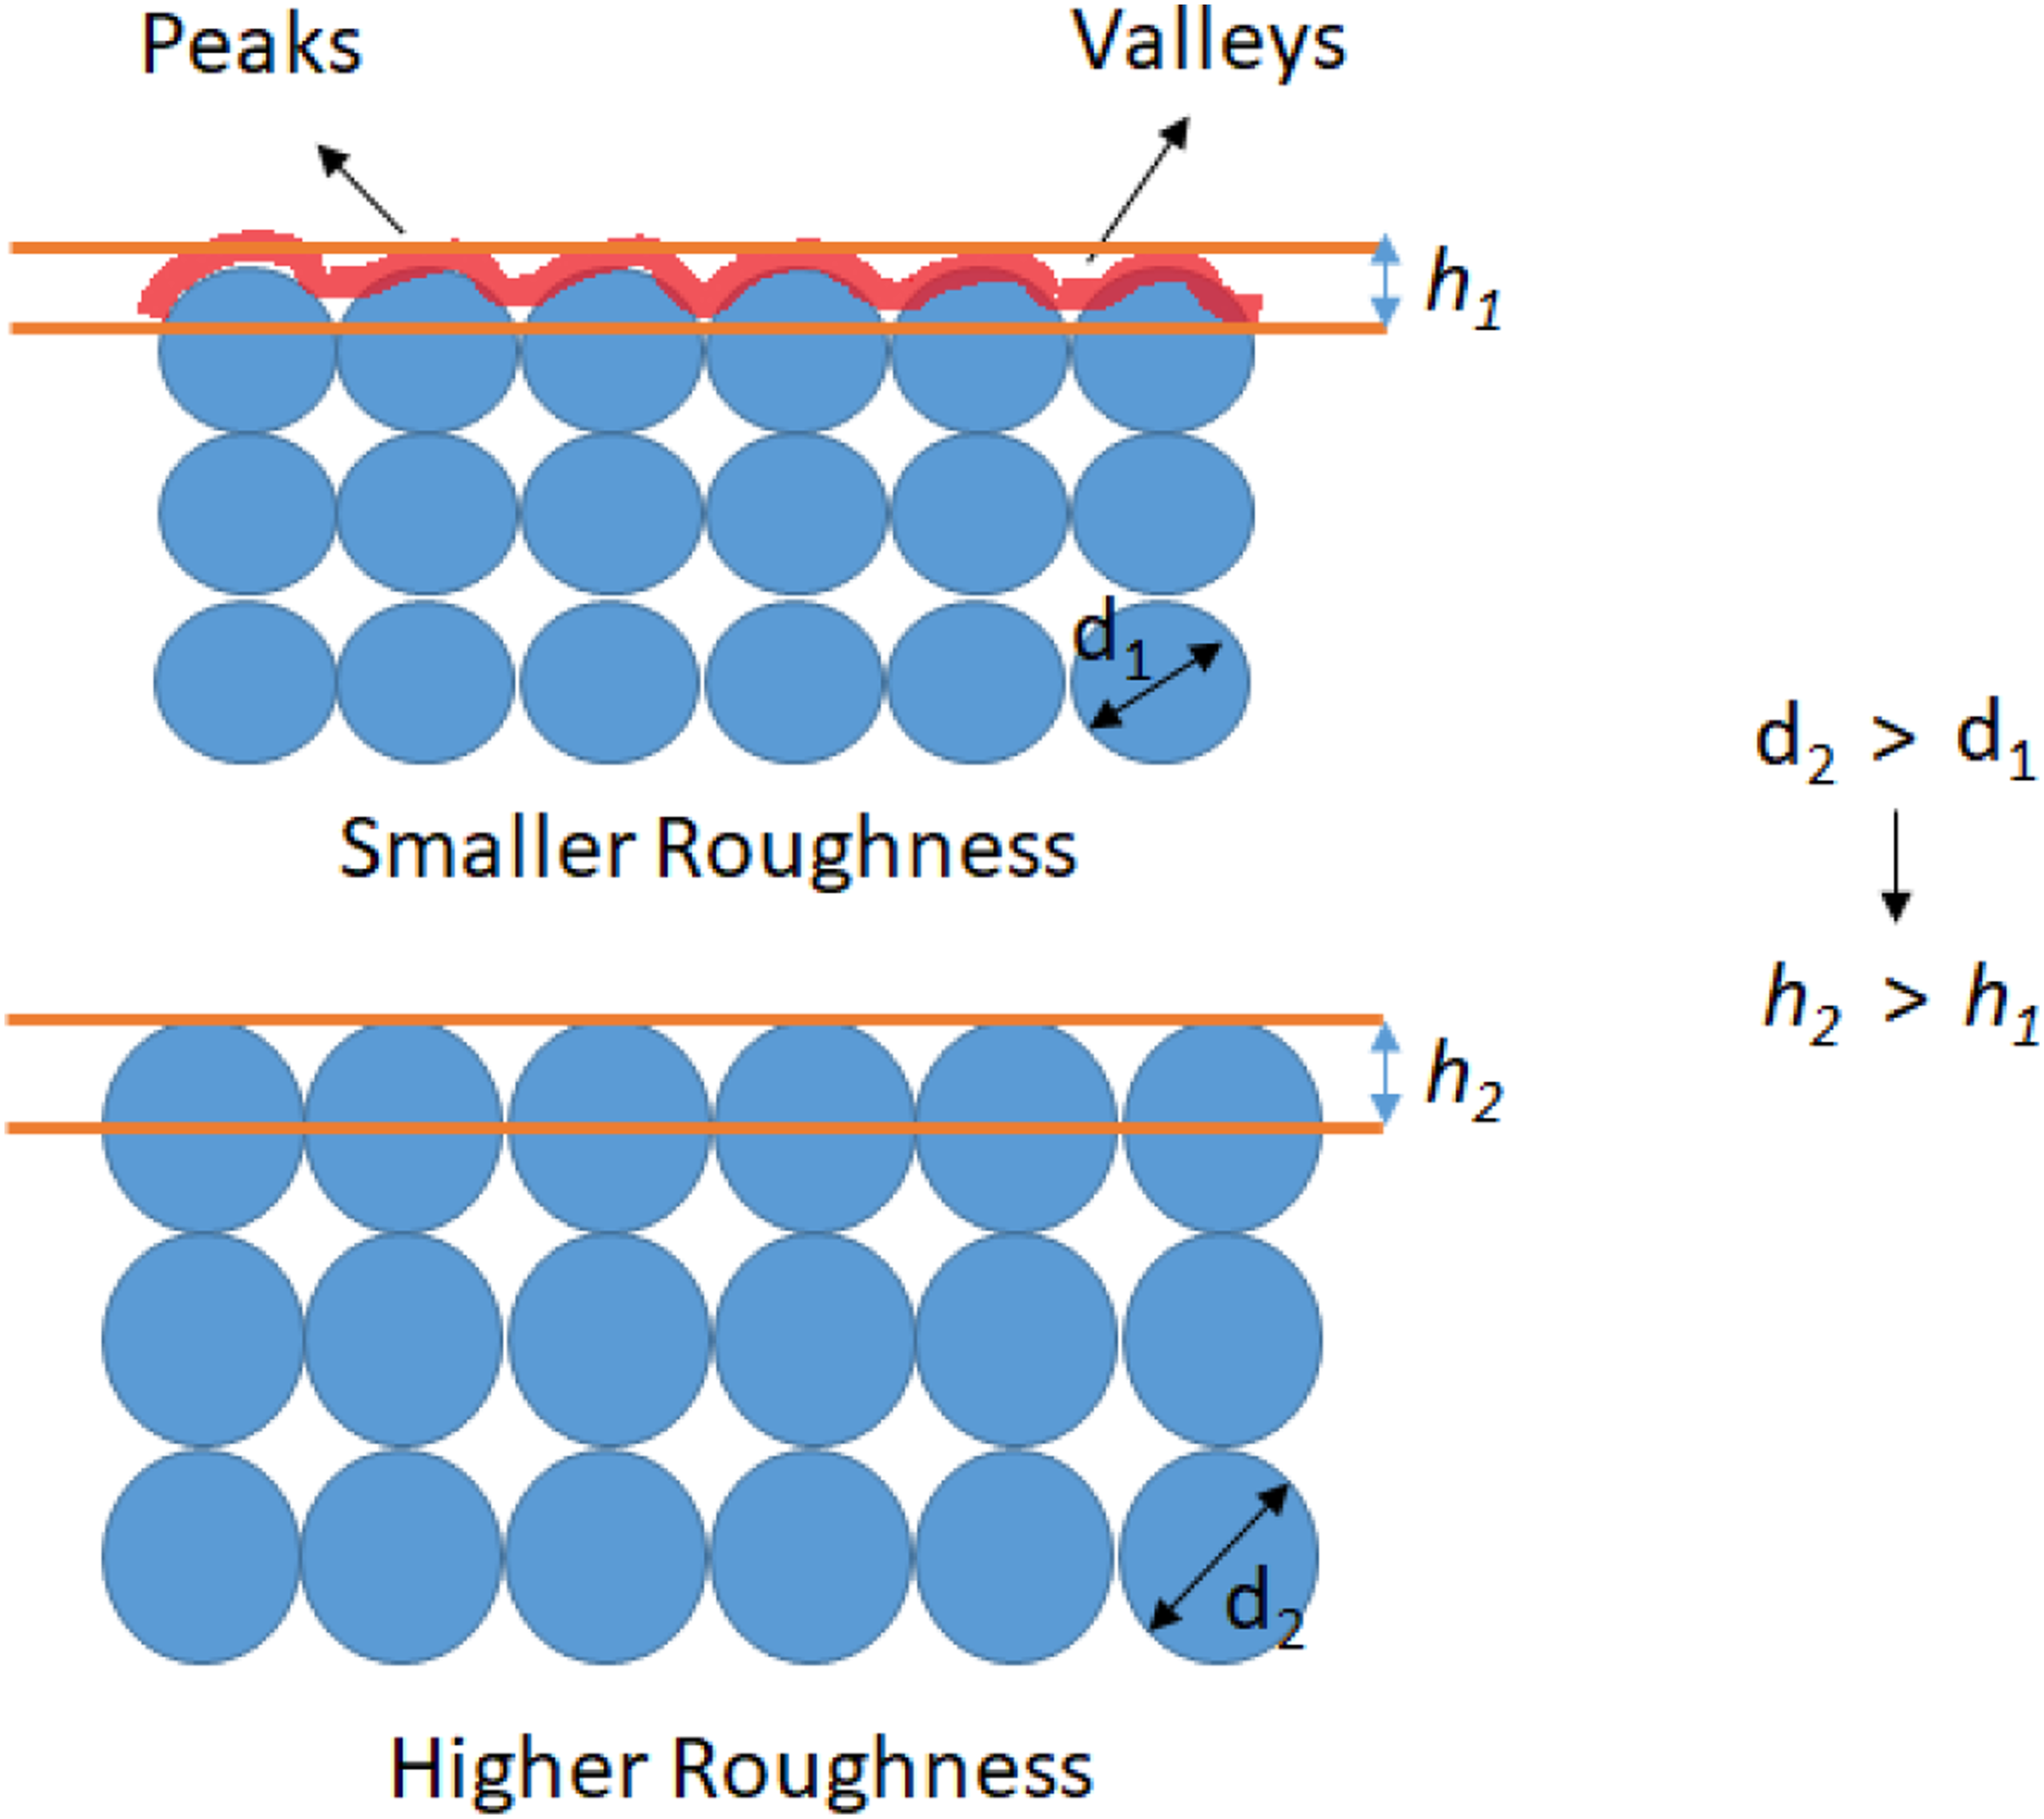
The results of the measurements of roughness (Ra) values of strip, cube and cone samples are shown in Figure 5(a)–(c) as a function of material type. It can be seen that the surface roughness is increased as the materials were changes from PLA to Nylon (Nylon has the highest average roughness) in the case of strip samples that were printed flat on the build bed. Whereas, the roughness values of the cube samples have been decreased when shifting from PLA to Nylon. The cone specimen have shown the similar trend like that of the cubes. The Ra values were also plotted as a function of 3D printed shape for comparison purpose in Figure 6. (a,b,c): Roughness average versus material. Roughness average versus geometrical shape.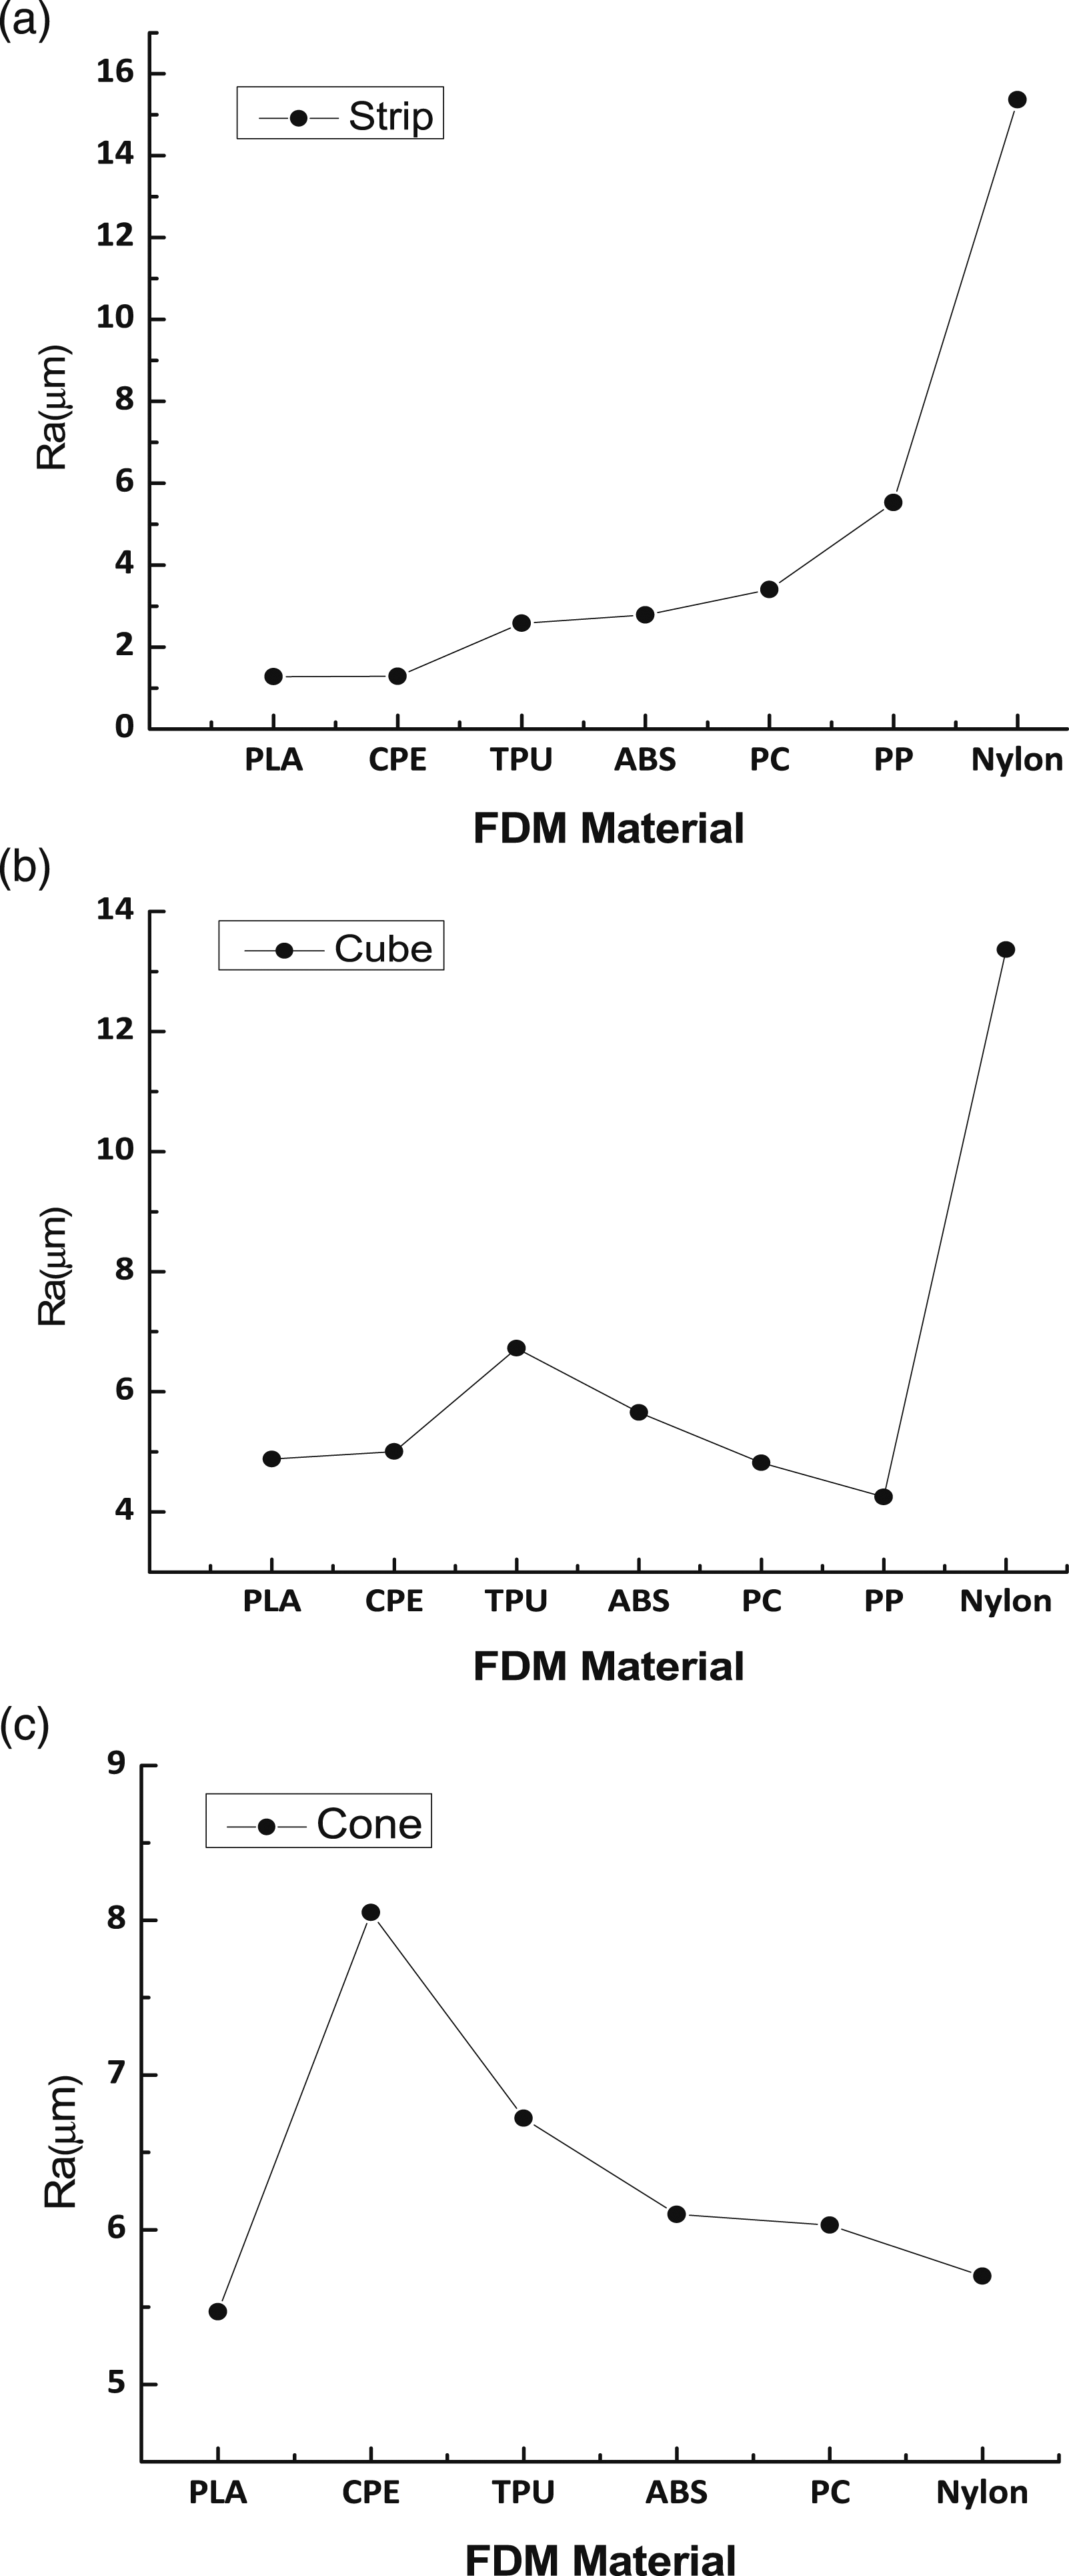
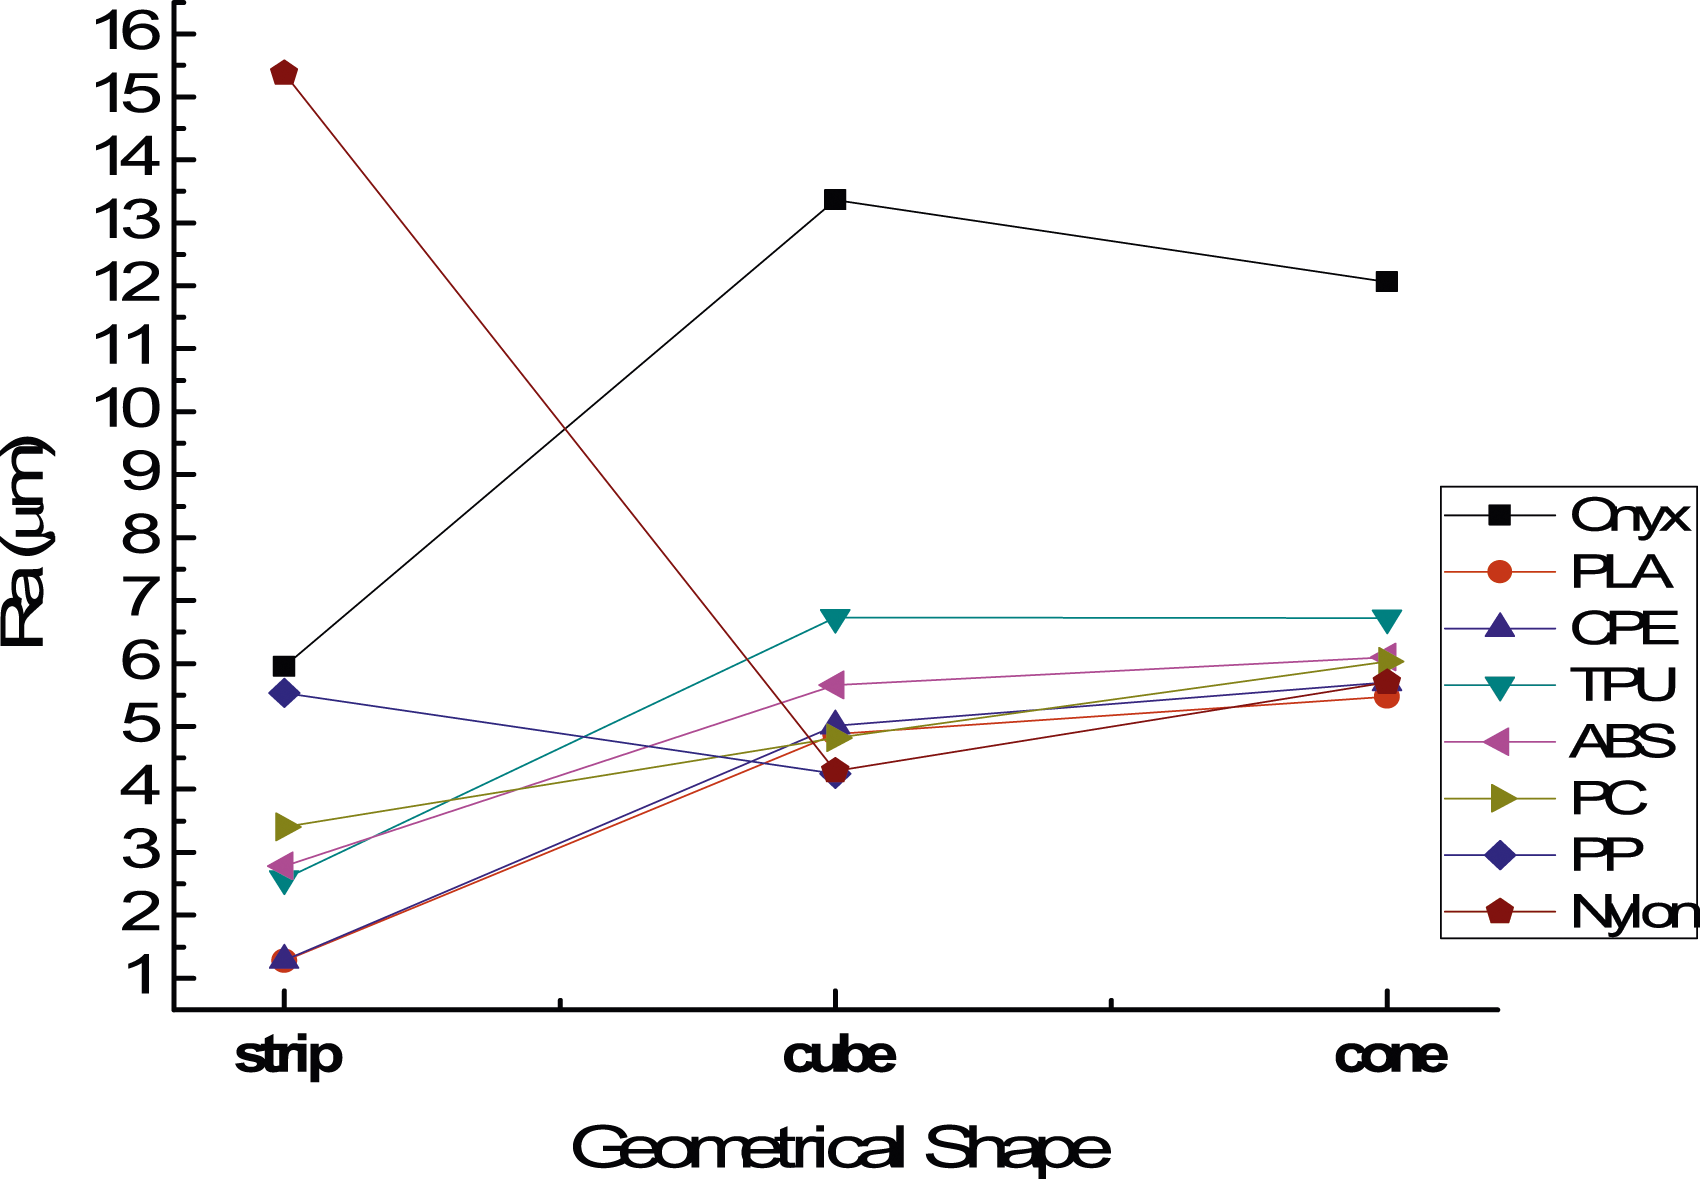
The comparison shows that strip shape has the least surface roughness as compared to cube and cone shape. The strip geometry has surface roughness in the range of 1≤ Ra (µm) ≤6 except the nylon specimen, whereas in cube and cone samples its values are 4≤ Ra (µm) ≤13 and 5≤ Ra (µm) ≤12, respectively. It has been revealed from the roughness measurements of cube and cone samples, that roughness values are higher as compared to strip sample and in almost the same range in the build direction irrespective of the shape.
The surface roughness was also plotted as a function of nozzle temperature in Figure 7. It can be seen from Figure 7 that the strip, cube and cone samples have similar trend in the variation of Ra values with temperature. In all samples there is a decrease in Ra value when the nozzle temperature has been increased from 220°C for CPE to 240°C for Nylon. However, the geometries 3D printed in onyx at nozzle temperature of 245°C has shown higher roughness value in all samples, the probable reason is the available layer height (100 um) in composite 3D printer. At the lower nozzle temperature 200°C for PLA, the roughness values were significantly increased for CPE at 220°C. These results show that nozzle temperature is possibly the main parameter that is responsible for the surface roughness values at constant layer height. An appropriate selection of nozzle temperature may result in lower surface roughness values for all materials with constant layer height. Roughness average versus nozzle temperature.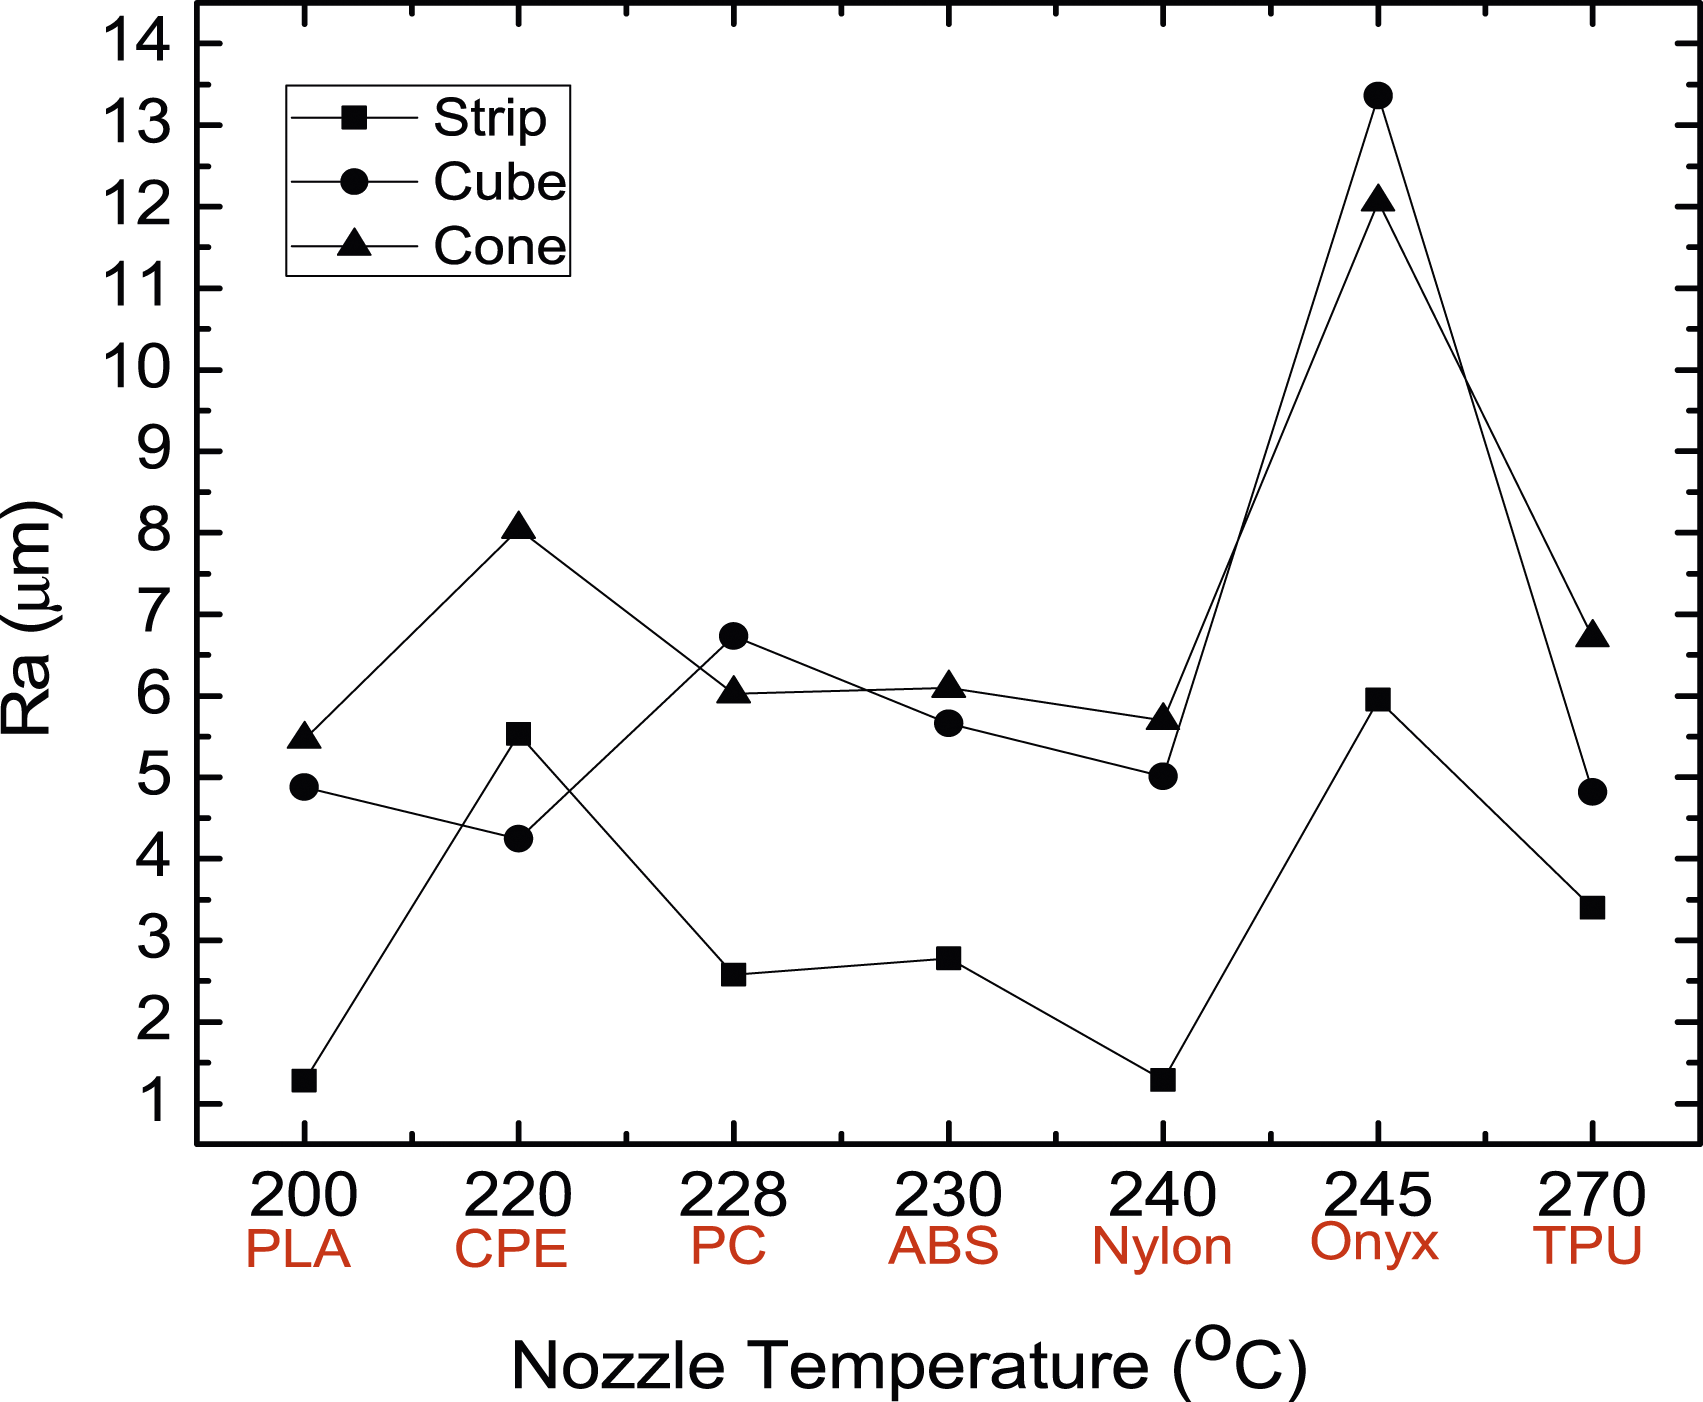
The surface roughness of thermoplastics in FDM 3D printing is aroused due to the layer-by-layer nature of the material deposition process. The surfaces with curvatures have higher surface roughness values. The shape of the finally deposited individual filament that is contributing to the surface roughness in a layer may depend on the nozzle temperature and the material flow rate (Flow rate is the inverse of the viscosity). The surface roughness of two parts i.e. strip and cube have been plotted along with flow rates of the materials used in the present study in Figure 8. It can be seen from this figure that no direct correlation is observed between the flow rate and the surface roughness of the components. Similarly, no direct correlation has been reported between the surface roughness and the shrinkage of the deposited material. However, the shrinkage of the deposited polymer has been resulted in the dimensional inaccuracy that is compensated by setting the printing parameters as well as the geometrical tolerances.14–16 The shrinkage of the thermoplastic filaments used in the present studies ranges from 0.2% for CPE to 0.7% for Nylon. The shrinkage is not much significant that could have detrimental effect on the surface roughness. The mass flow rate (MFR) taken from OEM data sheets and Ra values plotted against thermoplastic polymers.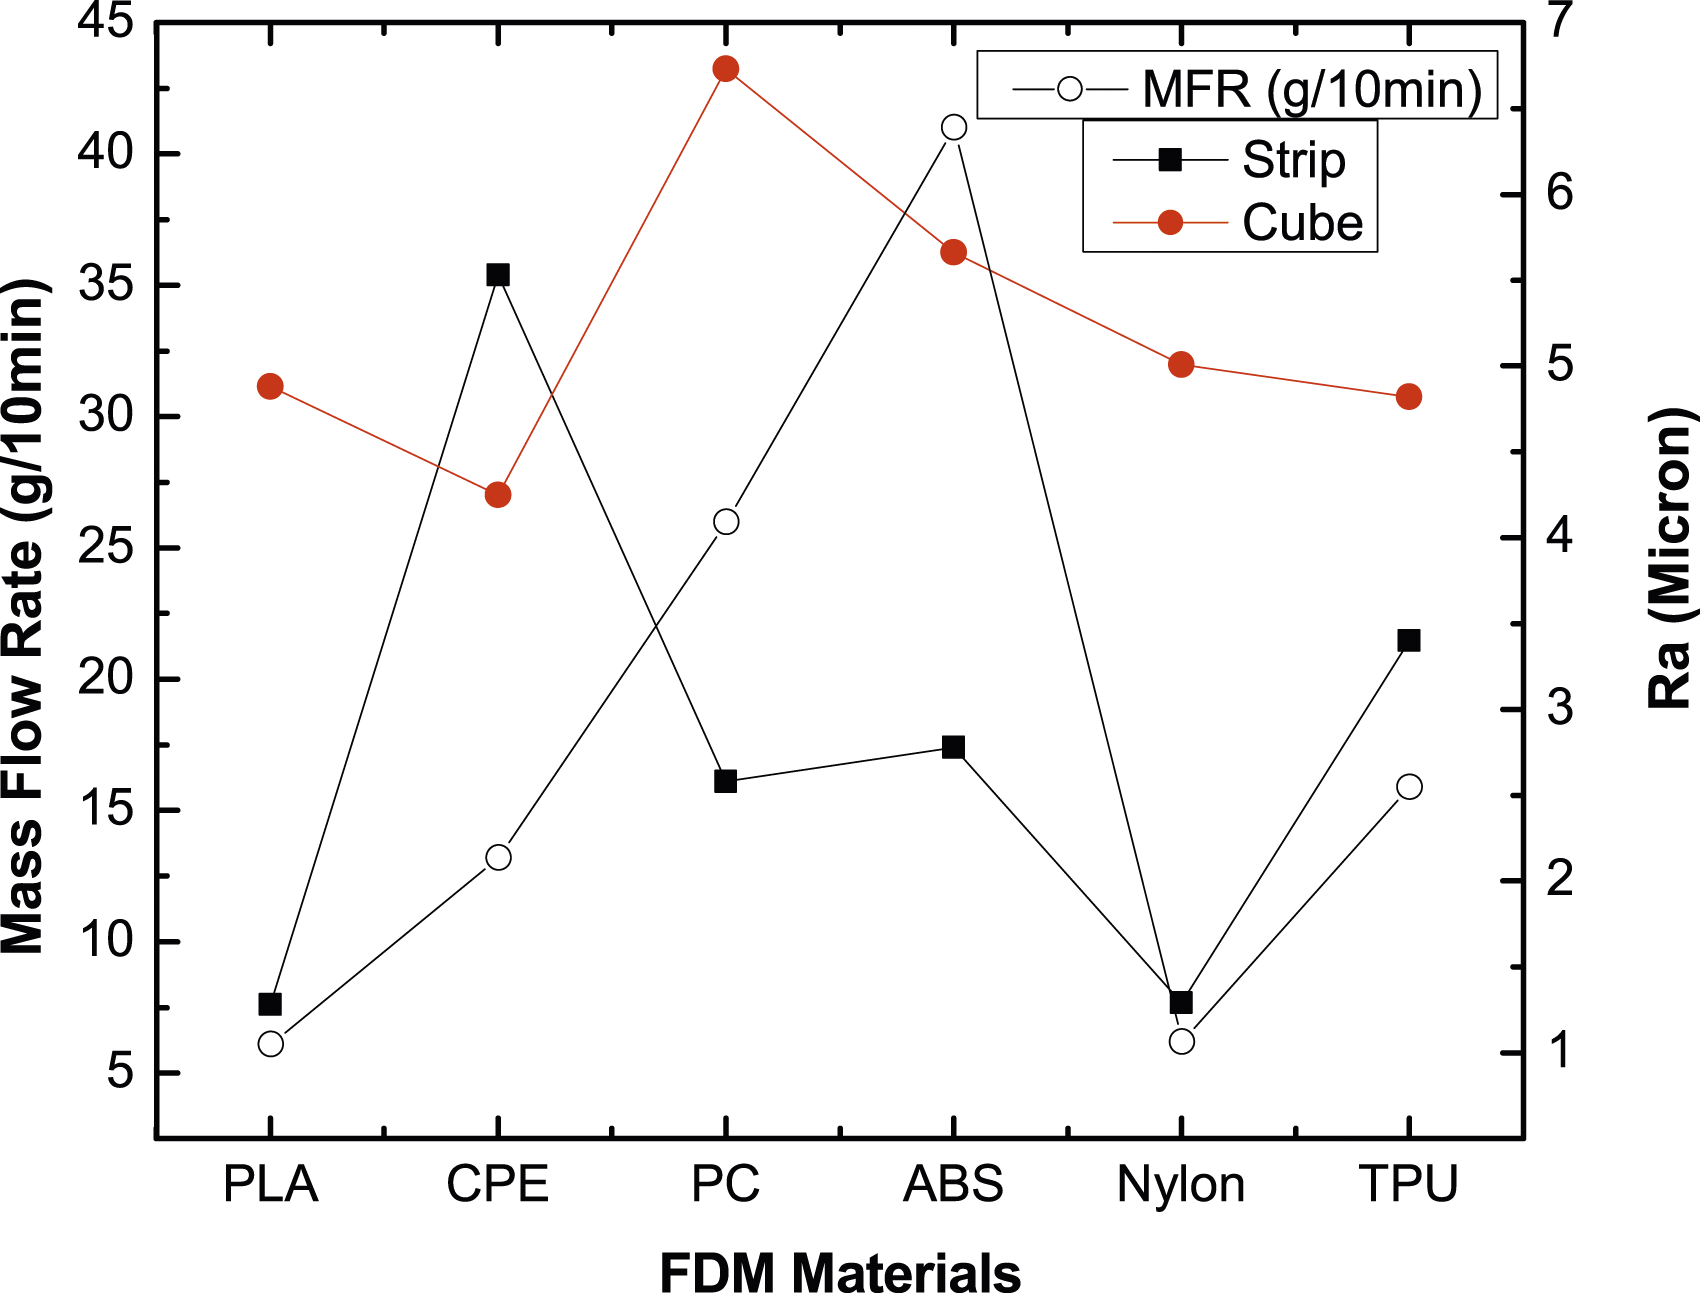
Surface treatment
Results of the surface roughness of FDM plastics after chemical treatments.
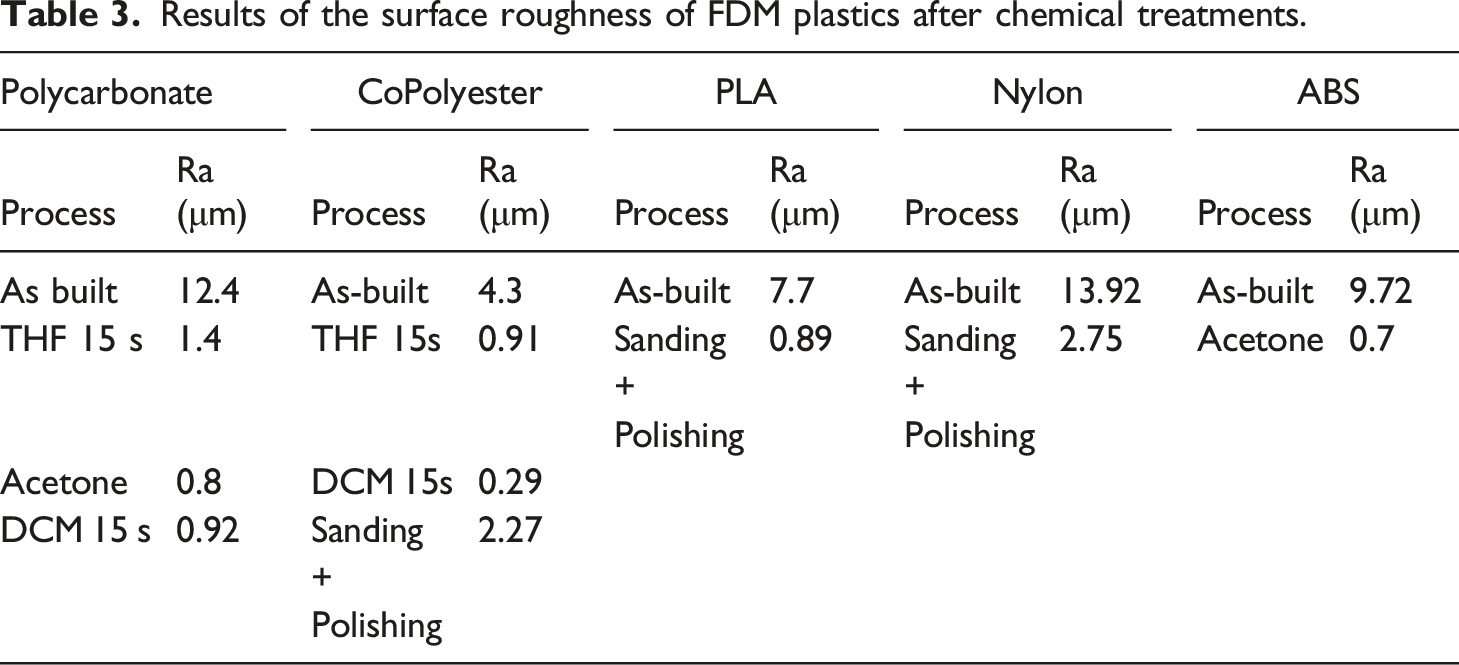
The surface roughness has been reduced to 796 nm after acetone dipping. We have selected only 30 s because a longer dipping time may result in softening or smearing of polycarbonate sample.
17
Co-polyesters exhibited good solubility in common organic solvents such as chloroform, dichloromethane, and tetrahydrofuran, in our experiments dichloromethane and tetrahydrofuran both produced good surface finish.
18
However, the Co polyester cone samples dipped in DCM solution for 15 s had a lower surface roughness of 294 nm as compared to that of THF that has a Ra value of 914 nm. It was also observed that increasing the dipping time beyond 20 s can compromise the dimensional integrity of the Co-Polyester samples. On the other hand the as-built samples after smoothing with sand paper could improve the surface quality to 2.27 um. The PLA samples were also treated with DCM by dipping for 15 s. The treatment with dichloromethane resulted in improved surface of the PLA cone samples too from 7.7 um of as build to 894 nm. The ABS cones were also tested with famous acetone vapor smoothing process. The vapor smoothing of the cone samples was performed at 50°C for different time intervals, however, the samples treated for 20 min has a reduction in surface roughness from 9.72 um to 695 nm. The higher treatment time for the same sample can affect the dimensions of the parts that would be undesirable for application point of view. In the process of chemical treatment the polymer when reacts with the chemical used, it is dissolved and flows down the surface due to gravity. The solvent/polymer mix during its flow, fills the voids created due to stair stepping effect and improve the surface quality, Figure 9. The time of the reaction is adjusted in a way so as to prevent excessive removal of the material and to avoid geometrical changes to the cone samples. The schematic is showing the stair stepping effect in the cone samples and the direction of flow of the polymer/solvent mix.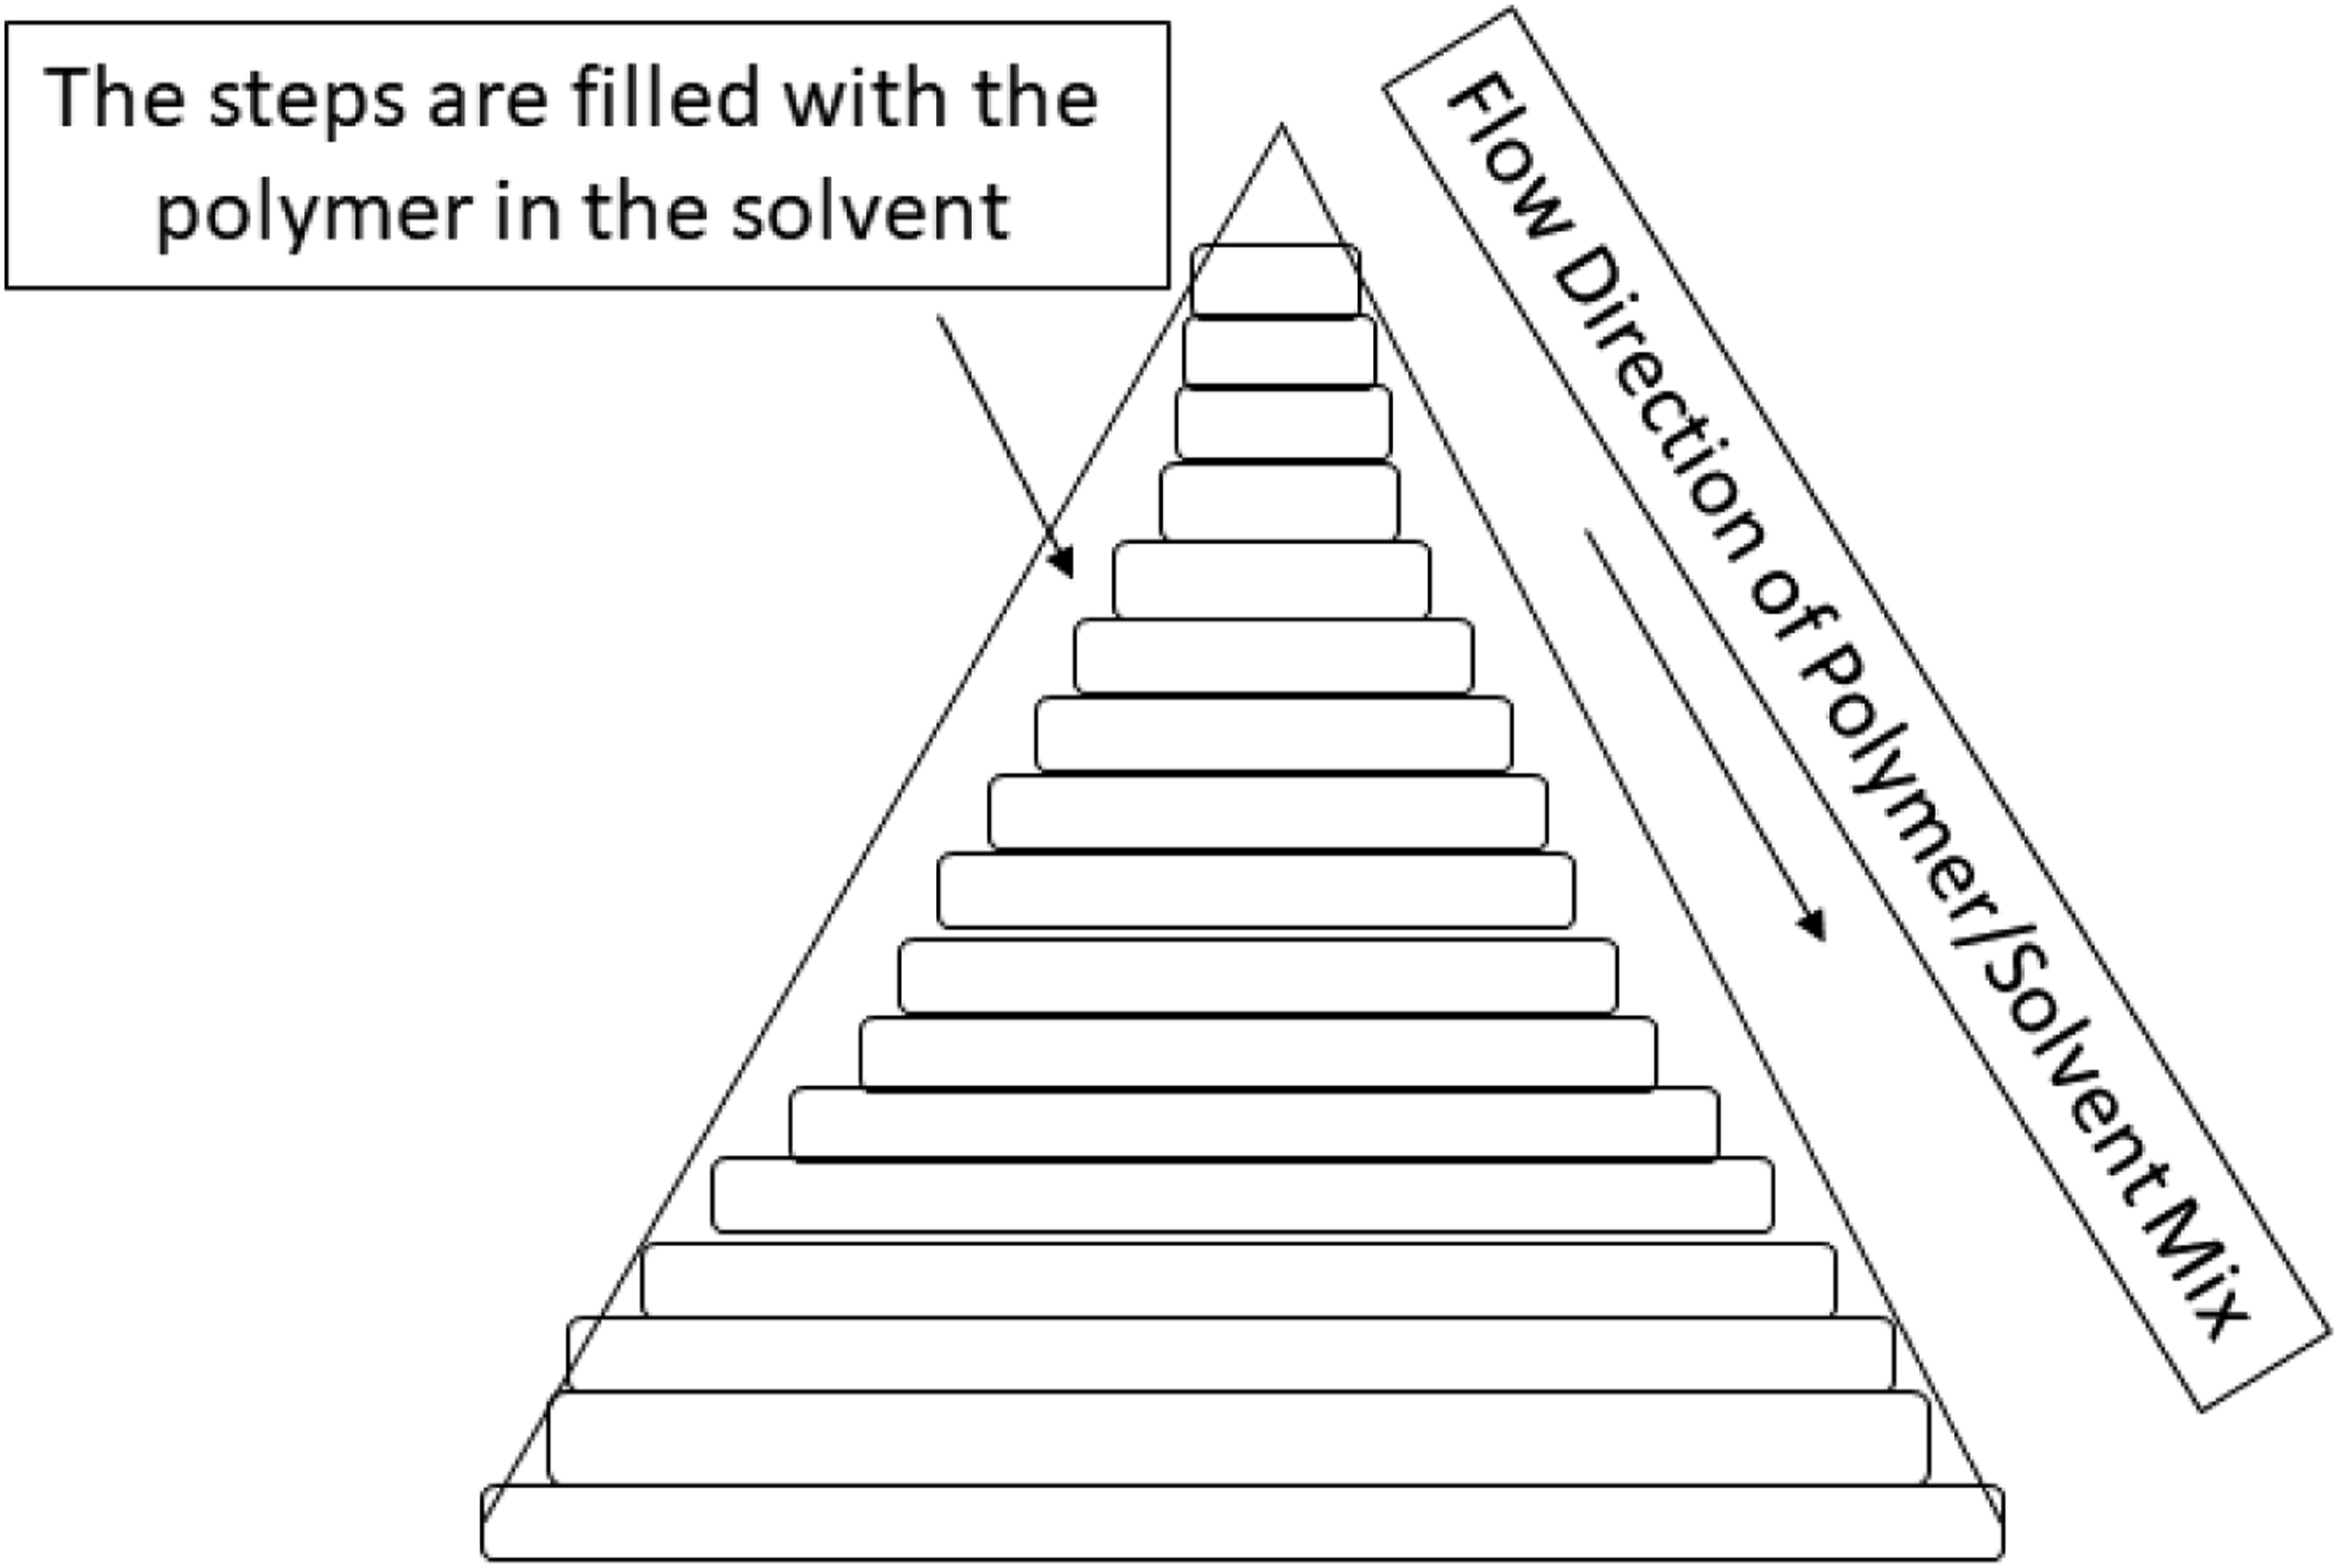
None of the chemicals available in the lab. were suitable for chemical smoothing of nylon samples. We applied physical abrasion to remove out the layer lines on nylon samples. After physical smoothing with 200, 300 and 1000 grit paper the surface roughness was reduced to 5.6 um from 10.08 um of the as build nylon cone samples. We also applied epoxy coats but the results were not promising as far as surface quality is concerned.
Surface treatment and dimensional accuracy
In order to investigate the effect of surface treatments on the dimensional accuracy of 3D printed parts, 3D scanning was performed. 3D scanning is a strong tool to measure the deviation of the components from actual design. The results of 3D scanning are shown in Figure 10. Since the either chemical or physical surface finishing procedures involve the removal of materials, therefore, the process of smoothing the FDM parts should involve minimum possible removal of the material to maintain the dimensional integrity. The color map of 3D scanned images is also given in Figure 5. The green color indicates negligible deviation from the original geometry whereas blue and yellow colors are representing removal and addition of material to the surface, respectively. It can be seen from Figure 5 that the polycarbonate samples have shown very minor geometrical deviations after performing the post processing operations. However, the dimensional integrity of Co-polyester samples was significantly affected by the chemical treatment. The CPE sample dipped in DCM have shown excessive removal of material in a very short time, whereas dipping in THF did not affect the surface very much only some material segregation on the tip of the cone. The ABS sample on the other hand is highly smooth without compromising the dimensional features of the cone. Similarly, the shape of the PLA cone was not much affected by physical abrasion and dipping in DCM solution. The 3D scanning results show that only polycarbonate, ABS and PLA are able to maintain their geometrical shape after surface smoothing with chemicals. Comparison of the actual CAD model with the 3D scanning of cone samples after post processing.
Conclusions
It has been concluded from the analysis of surface roughness of three selected geometries i.e. strip, cube and cone that cube and cone geometries have similar surface roughness in the build direction. The nozzle temperature plays an important role in the surface finish of the as build parts, 3D printed with constant layer height. The appropriate selection of nozzle temperature for different materials may produce parts with lower surface roughness. On the other hand the surface the chemical methods have been resulted in reducing the surface roughness of the FDM parts. Polycarbonate had a good response to all available chemicals i.e. THF, DCM and Acetone with respect to surface smoothing as well the integrity of the part geometry. Similarly ABS have shown a very good behavior under acetone vapor smoothing by maintaining. PLA was responsive only to THF with minor change geometrical shape. However, Copolyester (CPE) could not maintain its dimensional integrity even with reduced surface roughness after treatment with THF solution. Finally it is concluded that THF, DCM, and Acetone can be applied for the improving surface quality of 3D printed parts in polycarbonate, ABS and PLA without compromising their geometrical shape. Such chemicals can also help to improve surface quality of 3D printed parts with complex shapes.
Footnotes
Declaration of conflicting interests
The author(s) declared no potential conflicts of interest with respect to the research, authorship, and/or publication of this article.
Funding
The author(s) received no financial support for the research, authorship, and/or publication of this article.