
Abstract
This study presents a comparative analysis of the mechanical and structural properties of materials fabricated using two prominent 3D printing techniques: fused deposition modelling (FDM) and stereolithography (SLA). Five materials were investigated: acrylonitrile butadiene styrene (ABS) and acrylonitrile styrene acrylate (ASA) for FDM, and Tough 2000, Rigid 10K and Elastic 50A resins for SLA. Standardised test specimens were produced and evaluated through tensile, flexural (three-point bend), impact and Vickers hardness testing, with surface morphology assessed via optical microscopy. The results showed significant variation in mechanical performance across materials and printing methods. SLA-printed Rigid 10K resin demonstrated the highest tensile and flexural stiffness, whereas FDM-printed ABS exhibited superior impact resistance. Elastic 50A resin showed exceptional elongation at break but was unsuitable for flexural testing under standard conditions. Microscope imaging revealed that SLA parts had superior surface finish and layer uniformity, while FDM prints exhibited visible layer lines and occasional voids that influenced mechanical behaviour. The findings underscore the crucial role of material selection and printing technology in attaining the desired mechanical performance, offering valuable insights for engineers and designers in additive manufacturing applications.
Introduction
3D printing, or additive manufacturing, is a transformative technology that enables the fabrication of complex three-dimensional objects directly from digital models. 1 By constructing parts layer by layer, 3D printing facilitates intricate geometries and mass customisation with minimal material waste.2, 3 Among the most widely adopted 3D printing methods are fused deposition modelling (FDM) and stereolithography (SLA), each offering distinct advantages based on material, cost, resolution and mechanical performance. 1 FDM is characterised by its use of thermoplastic filaments such as acrylonitrile butadiene styrene (ABS) and acrylonitrile styrene acrylate (ASA), making it a cost-effective solution for rapid prototyping and functional parts. 4 In contrast, SLA uses photopolymer resins cured by a laser or light source to create high-resolution, smooth-surfaced components suitable for applications requiring fine detail and dimensional precision. 5 Beyond printing, many applications need additional post-processing, such as machining or laser cutting, to achieve tighter tolerances or integration with other systems. For instance, Uçak et al., 6 investigated the effects of laser cutting parameters on FDM-printed polylactic acid (PLA) and demonstrated that variables like power, cutting speed and focal distance significantly affect edge quality, kerf width and thermal damage during post-processing. These findings suggest that print quality alone does not dictate final part usability; machinability also plays a critical role. Similarly, in the context of metallic additive manufacturing, Der and Başar 7 investigated the machinability of metal parts produced via selective laser melting (SLM) and electron beam melting (EBM), emphasising that the surface integrity, tool wear and cutting forces are heavily influenced by the microstructural differences inherent to each technique. While this study focuses on polymer-based 3D printing, these broader machining considerations underscore the importance of understanding post-processing compatibility in conjunction with mechanical performance.
Despite the broad adoption of both FDM and SLA, there is a notable lack of comprehensive studies directly comparing the mechanical performance of parts made with these two techniques under equivalent conditions. 8 Where comparisons do exist, they often examine a narrow set of properties and may overlook critical aspects such as failure mode or surface integrity. As a result, important questions remain unanswered regarding how FDM and SLA parts truly stack up against each other in terms of overall mechanical robustness. For instance, some reports suggest that SLA-printed specimens can achieve higher ultimate tensile strength than their FDM-printed counterparts. 9 For instance, some reports suggest that SLA-printed specimens can achieve higher ultimate tensile strength than their FDM-printed counterparts. Yet, SLA resins are also known to be more brittle, exhibiting much lower elongation at break and energy absorption before failure. 10
Conversely, FDM thermoplastic parts often demonstrate greater toughness and impact resistance; one recent study found that ABS parts printed via FDM showed significantly superior overall mechanical properties compared to a similar ABS-like resin printed via SLA. 11 These disparities in the literature underscore the need for a more detailed comparison.
This research aims to fill that gap by providing a data-driven comparative analysis of five widely used 3D printing materials, two FDM thermoplastics (ABS and ASA) and three SLA resins (Formlabs Tough 2000, Rigid 10K and Elastic 50A). By examining multiple material types side by side, our study provides a novel perspective that extends beyond the one-material comparisons that have dominated past research.
Methodology
Materials and manufacturing
To ensure the robustness of the results and enhance the comparability of the material and process performance, a systematic design of experiments (DOE) approach was implemented in this study. The DOE methodology was employed to optimise and control the variables influencing the 3D printing processes and to identify the key factors that significantly affect the mechanical and structural properties of the printed materials.12, 13
A full factorial design was utilised, considering both the additive manufacturing techniques (FDM and SLA). The factorial design enabled the exploration of main effects and interactions among material types, printing methods and processing parameters. The aim was to evaluate how each factor influences the mechanical performance and failure characteristics across the different materials and printing techniques. 14 Each experimental condition was replicated five times to ensure statistical reliability and account for variability in the manufacturing process.
Materials
This study utilised five different materials fabricated using two additive manufacturing techniques: FDM and SLA. The FDM process was used to print ABS and ASA. ABS is a thermoplastic polymer recognised for its toughness, impact resistance and widespread application in engineering contexts. ASA, an ultraviolet (UV)-resistant alternative to ABS, offers comparable mechanical properties with enhanced weatherability and colour stability, making it more suitable for outdoor or light-exposed environments.
The SLA process was employed to produce components using Tough 2000 resin, Rigid 10K resin and Elastic 50A resin. Tough 2000 resin is a photopolymer designed to replicate the mechanical performance of ABS, providing high strength and stiffness for functional prototyping. Rigid 10K resin, reinforced with glass, is formulated for maximum stiffness and thermal resistance, making it suitable for high-precision and load-bearing applications. Elastic 50A resin is a soft, flexible material with a Shore hardness of 50A, intended to simulate rubber-like behaviour in components requiring elasticity and deformation tolerance.
These five materials were selected to represent a diverse range of mechanical behaviours and application contexts across both FDM and SLA technologies. ABS and ASA provide a basis for evaluating the influence of environmental resistance within a common thermoplastic platform. The SLA resins were selected to span a wide range of material properties, from rigid, glass-reinforced composites to flexible elastomers, allowing for a comprehensive evaluation of print performance across various functional categories. This selection enables a broad yet structured comparison of material-process combinations, providing insights that extend beyond the typical one-to-one studies commonly found in the current literature.
Manufacturing
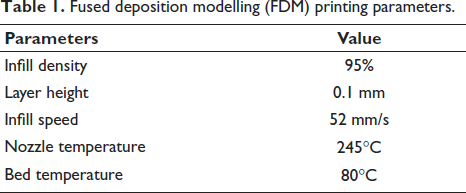
The FDM samples were printed using a Stratasys F370 printer, while the SLA samples were fabricated on a Formlabs Form 3/3+ printer. The printing parameters used in this study are presented in Table 1 (FDM) and Table 2 (SLA).
Fused deposition modelling (FDM) printing parameters.
Stereolithography (SLA) printing parameters.
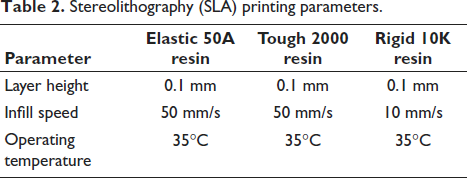
All printing parameters were selected based on the default or recommended settings provided by the respective material and equipment manufacturers. These settings are intended to ensure optimal print quality, mechanical performance and material consistency.
Structural analysis
Optical microscope
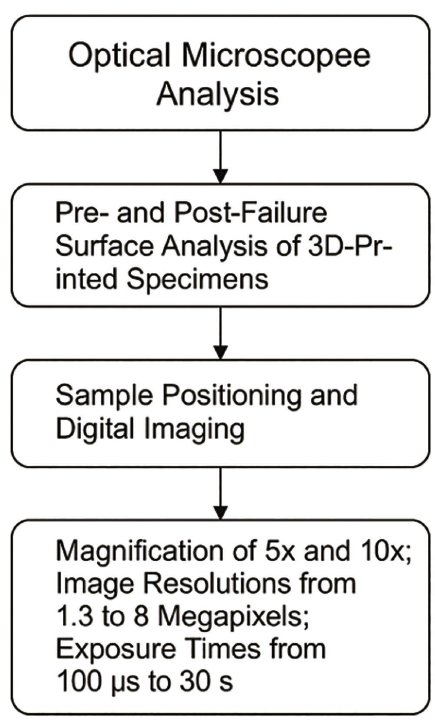
Pre- and post-failure surface analysis of 3D-printed specimens was conducted using a Leica DM2700M optical microscope equipped with a white-light light-emitting diode (LED) source. Samples were precisely positioned under the lens, and digital imaging was performed at magnifications of 5× and 10×, with image resolutions ranging from 1.3 to 8 megapixels. Exposure times were adjusted between 100 µs and 30 s to optimise contrast and clarity for detailed visual inspection of fracture surfaces and microstructural features. A flow chart, as shown in Figure 1, details the steps taken.
Flow chart of the steps taken in conducting the structural analysis.
Mechanical analysis
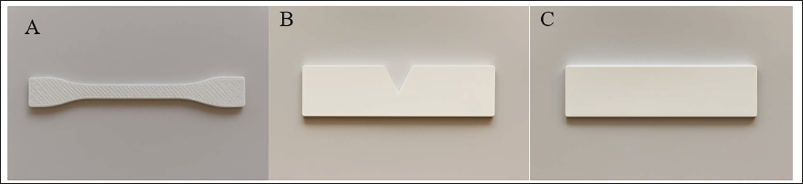
Mechanical characterisation was conducted on 15 optimally 3D-printed specimens per material type. The sample sets included five tensile test specimens, five notched-bar specimens for impact testing and five flexural test bars, which are shown in Figure 2. These tests were chosen to represent a balanced profile of critical mechanical properties relevant to the functional use of printed components, particularly in structural or load-bearing applications. Compressive testing was not included in this study, as the primary focus was on comparing failure characteristics, surface integrity and stress responses under tension and flexure—common failure modes for polymer-based printed parts. Compression tests are less sensitive to interlayer bonding and anisotropic weaknesses typical of additively manufactured parts, and therefore less suitable for highlighting differences between FDM and SLA processes in this context.
Examples of the specimens used for testing. (A) Tensile specimen (B) notched-bar specimens (C) flexural test bar.
Tensile testing
Tensile tests were performed on Dogbone Type 1BB specimens in accordance with ASTM E8-03 and ASTM D638, using a Tinius Olsen 25 ST Universal Testing Machine. Each test was conducted at a displacement speed of 500 mm/min.
Flexural testing
Flexural testing was conducted following ASTM E8-03 and ASTM D638, using International Organization for Standardization (ISO) 178 standard flexural bars. Testing was carried out using both the Tinius Olsen 25 ST and 50 ST Universal Testing Machines. Tests were performed at a crosshead speed of 1 mm/min, with an anvil span of 64 mm.
Impact testing
The impact resistance of the 3D-printed materials was assessed via the Charpy IZOD Impact Test, as per ASTM E23 and ISO 179. Testing was conducted using a TECQUIPMENT TE15 Impact Testing Machine, capable of delivering a maximum impact energy of 2.75 J. Specimens were edgewise tested as Type-A single-notched bars.
Vickers hardness testing
Hardness characterisation was conducted using a modified Rockwell Hardness Tester configured for Vickers testing. Prior to testing, each specimen surface was mechanically polished to ensure planar alignment and minimise surface defects. A diamond pyramid indenter was used to apply a controlled load for a fixed dwell time.
The Vickers hardness test was selected over other hardness methods (e.g., Rockwell, Shore) due to its high precision on small, localised features and its suitability for polymers with varying surface textures—especially SLA prints, which often exhibit smoother finishes. Vickers also offers a consistent approach across soft and hard materials, providing reliable comparisons of surface resistance, regardless of the printing process or polymer type. Its ability to produce fine, measurable indentations with minimal influence from macrostructural geometry makes it particularly valuable for analysing small-scale surface performance in additive-manufactured specimens.
Results and discussion
Optical microscope
FDM samples
The FDM printed materials, specifically ABS and ASA, exhibited visible layer lines and minor surface imperfections, including microvoids and inconsistent filament deposition, as can be seen in Figure 3. As noted by Lopes et al., 15 FDM relies on thermoplastic extrusion, a process which, as further elaborated by Ćwikła et al., 16 due to the layer-by-layer deposition, it inherently results in pronounced layer lines. Microscopic analysis of ABS samples shown in Figure 3A reveals a generally uniform layer distribution, although striations along the build direction were evident. ASA samples similarly demonstrate a consistent overall structure; however, irregularities were observed at the outer boundaries of the prints.
Optical micrographs of (A) acrylonitrile butadiene styrene (ABS) and (B) acrylonitrile styrene acrylate (ASA).
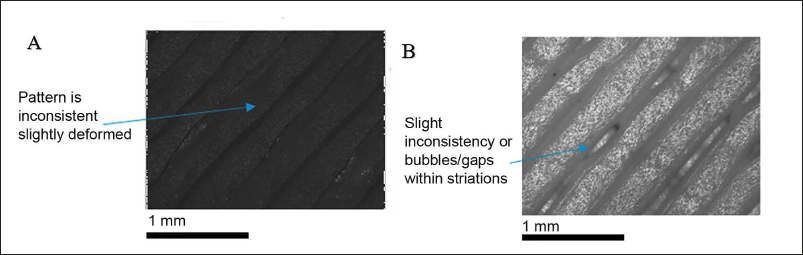
According to Mwema et al., 17 dimensional inaccuracies under microscopy were primarily attributed to insufficient fusion between adjacent filament layers during the printing process. This incomplete bonding introduces micro-gaps, thereby reducing the mechanical integrity of the printed parts, a phenomenon observed in both ABS and ASA specimens. Optical inspections corroborated these findings, showing filament width variations and inconsistent overlaps that contributed to surface roughness.
Furthermore, the effect of print speed was notable. At elevated print speeds, ABS layers exhibited reduced uniformity, with observable gaps and ripples, particularly apparent in the top layers, as shown in Figure 3B. Dhakal et al., 18 reported that increasing the print speed from 20 to 50 mm/s in ABS and ASA led to more discontinuous extrusion lines and irregular filament overlaps, resulting in a rougher surface finish. Given that the prints in this study were produced at speeds exceeding those examined by Dhakal et al. 18 It is plausible that excessive print speed contributed significantly to the observed defects.
SLA samples
In contrast to their FDM-printed counterparts, components fabricated using SLA with Rigid 10K, Tough 2000 and Elastic 50A resins demonstrated significantly superior print resolution and surface finish, which can be seen in Figure 4. This performance advantage is primarily due to the inherent precision of the SLA process, which utilises a laser to selectively cure photopolymer resin layer by layer, achieving resolutions as fine as 50 µm, particularly for rigid engineering-grade resins. Prior studies by numerous authors19–21 have consistently shown that SLA technology produces minimal layer lines and exhibits low surface roughness, thereby outperforming typical FDM prints in terms of surface quality and detail fidelity.
Optical micrographs of (A) Rigid 10K resin (B) Tough 2000 resin (C) Elastic 50A resin.
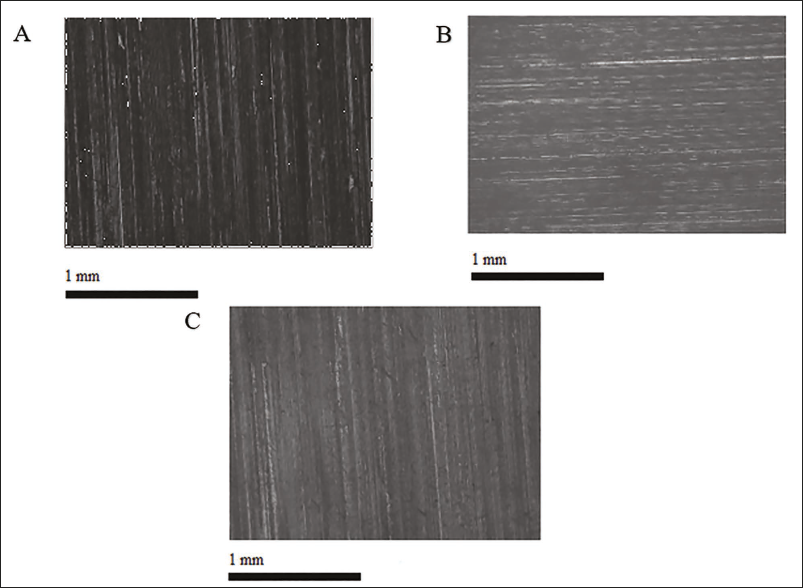
Microscopic observations presented in Figure 4A–4C further support these findings. In agreement with observations by Toledo et al., 22 prints produced using Rigid 10K resin exhibit a smooth matte surface with sharply defined edges and high geometric accuracy. This can be attributed to the resin’s low viscosity, which facilitates precise laser curing and reduces the risk of distortion. Similarly, Tough 2000 resin, known for its high impact resistance and dimensional stability, yields semi-gloss surfaces with minimal printing imperfections, making it well-suited for producing functional parts that require fine detail resolution. Even Elastic 50A, despite its inherent softness and flexibility, presents a generally uniform surface texture with few observable voids or discontinuities. However, consistent with findings by Grab et al., 23 some edge deformation and minor support imperfections were noted, likely due to the intrinsic challenges associated with printing low Shore hardness materials.
Tensile properties
FDM samples
The mechanical properties of the FDM-printed materials shown in Table 3 revealed that ABS exhibited a Young’s modulus of 721 MPa, yield strength of 50 MPa and elongation at break of 4.9%. ASA, on the other hand, recorded a similar modulus (729 MPa), but a slightly lower yield strength (45 MPa), and a reduced elongation at break of 4.0%. These differences in performance highlight the impact of the FDM printing process on material properties.
Tensile properties of fused deposition modelling (FDM) printed samples.
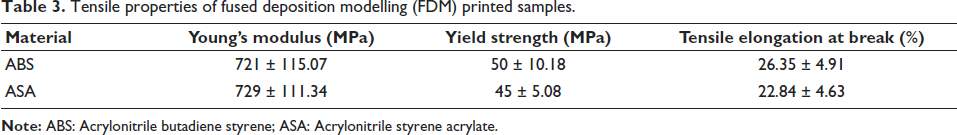
Results from this study indicate a significant reduction in stiffness for both ABS and ASA when printed via FDM compared to their injection-moulded counterparts. In bulk form, the Young’s modulus of injection-moulded ABS typically falls within the range of 2.5–2.7 GPa, while FDM-printed ABS, as reported by previous studies by Galeja et al., 24 typically shows a reduced modulus in the range of 2.0–2.4 GPa, depending on print settings and material formulation. Similarly, ASA, which has a bulk modulus of approximately 2.0–2.4 GPa, exhibited a more substantial decrease in stiffness when printed via FDM, with reported values ranging from 1.6 to 1.8 GPa in the literature by Cressall et al. 25
These reductions in stiffness can be attributed primarily to the FDM’s layer-by-layer deposition process, which results in the formation of internal voids and imperfect bonding between layers. 26 Optical microscope images, in Figure 3, of ABS prints revealed smoother and more consistent layering compared to ASA, which may explain the higher Young’s modulus observed for ABS. The smoother surfaces of ABS prints likely facilitate better interlayer bonding, resulting in enhanced stiffness. 27 Conversely, ASA’s prints exhibited rougher surfaces, which likely led to weaker interlayer cohesion and a greater reduction in modulus. Notably, Guessasma et al., 28 reported an even lower modulus for ASA (ranging from 457 to 483 MPa), emphasising the severe reduction in stiffness that can occur when FDM processing is suboptimal. Poor interlayer bonding, as observed in microscopic images of ASA prints, was a key factor contributing to this drop in stiffness.
Elongation at break is a critical measure of a material’s ductility, and both ABS and ASA showed significant reductions in ductility when printed via FDM. In their bulk forms, ABS typically exhibits an elongation at break of 5%–30%, with typical values around 9%–10% for injection-moulded ABS. 24 However, the FDM-printed ABS showed a reduced elongation at break of 4.9%. This reduction in ductility can be attributed to the FDM prints’ layer-wise structure, which creates weak interfaces between layers that act as stress concentrators, which can be seen in Figure 5A, as described by Hetrick et al. 29 and Fayazbakhsh et al. 30
Optical micrographs of the tensile fracture surface of the fused deposition modelling (FDM) printed. (A) Acrylonitrile butadiene styrene (ABS) and (B) acrylonitrile styrene acrylate (ASA).
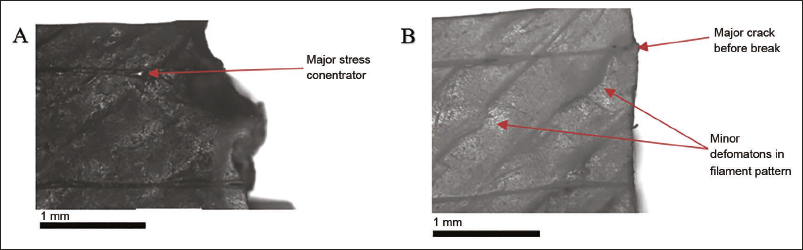
ASA, in its bulk form, is significantly more ductile than ABS, with elongation at break values ranging from 25% to 40%. However, FDM-printed ASA exhibited a much lower elongation at break, typically around 3% or lower, with some prints showing values as low as 0.6% when printed in the vertical direction,25, 31 which correlates with our data. The increased brittleness of ASA in the printed form was evident in the fracture surfaces shown in Figure 5B, which exhibited clean breaks along layer interfaces without significant plastic deformation. This behaviour suggests that ASA’s internal layer adhesion is weaker than that of ABS.
The weaker internal adhesion in ASA can be attributed to the presence of the acrylate rubber phase in the material. This component imparts a more flexible and rubbery nature to ASA, which can hinder the smooth flow of filament during extrusion. 31 As a result, ASA may exhibit less uniform bonding between layers, resulting in weaker interlayer adhesion and reduced overall strength and ductility. Additionally, ASA exhibits a faster cooling rate compared to ABS due to its higher extrusion temperature and material properties. The rapid cooling results in the quick solidification of the material, which leaves less time for the layers to fuse properly. This insufficient bonding during cooling further contributes to the reduced ductility and strength of ASA prints. 25
SLA samples
Rigid 10K is reported by Moritz et al., 32 to have a Young’s modulus on the order of 10–11 GPa with a very low elongation at break (~1%–2%). In our tests shown in Table 4, Rigid 10K’s modulus was only ~3.58 GPa, far below literature values, even though the measured strength (~87 MPa yield) was in the range of its reported tensile strength (65–88 MPa). This large modulus discrepancy suggests the printed Rigid 10K samples were not as fully crosslinked. Prior studies by Riccio et al., 33 show that post-curing can raise SLA resin moduli by 30%–50%; therefore, it is likely that the resin was not fully cured.
Tensile properties of stereolithography (SLA) printed samples.
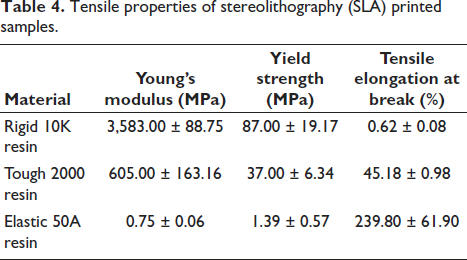
Tough 2000 resin exhibited a similar pattern: our sample’s Young’s modulus (~605 MPa) was much lower than the ~2.2 GPa reported by the manufacture, though its elongation at break (~45% in our test) aligns well with the ~48% literature value. 33 A homogeneous, void-free polymer can sustain higher strains because there are no internal defects to nucleate a crack. 34 The good layer adhesion means the material behaves more like a continuous bulk polymer, allowing it to absorb energy and deform before breaking.35, 36 Our image in Figure 6 showed no interlayer delamination, which is consistent with the part achieving high elongation and fairly.
Optical micrographs of the tensile fracture surface of the fused deposition modelling (FDM) printed. (A) Rigid 10K resin (B) Tough 2000 resin (C) Elastic 50A resin.
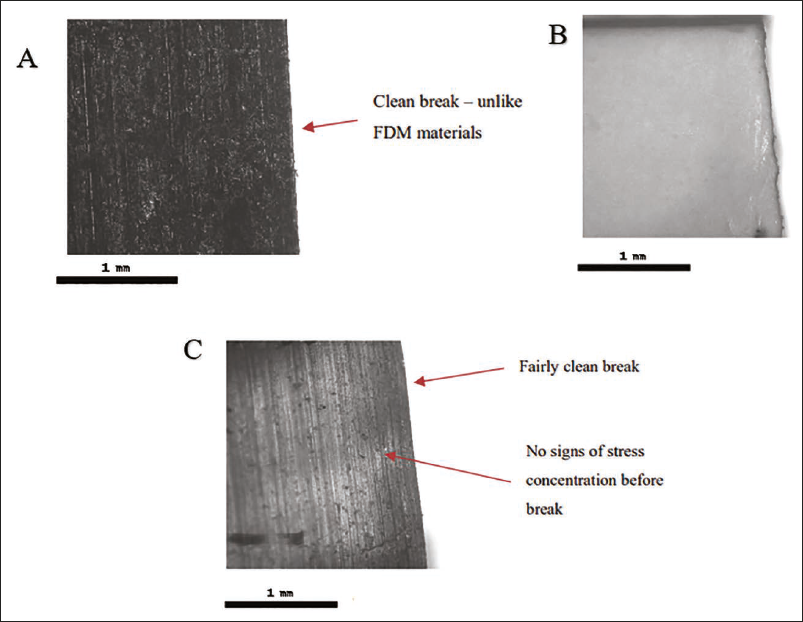
Elastic 50A elastomer showed extremely high ductility in our experiments and the literature. Our measured elongation at break (~240%) exceeds the typical published value (~160%). 33 While our Elastic 50A’s low initial Young’s modulus (~0.75 MPa) and tensile strength (~1.4 MPa) are somewhat below the roughly 1.5–2 MPa and ~3.4 MPa ultimate strength. Because Elastic 50A parts can stretch to well over their original length, any micro voids would reduce that capability by concentrating stress and causing an early tear.36, 37 No defects were seen under the microscope (Figures 4C and 6C), which is reflected in the outstanding elongation of the printed network, which can deform uniformly.
FDM versus SLA
FDM-printed materials, such as ABS and ASA, show significant reductions in stiffness and ductility compared to their bulk forms. For example, FDM-printed ABS has a Young’s modulus of 2.0–2.4 GPa, much lower than the 2.5–2.7 GPa of injection-moulded ABS, while FDM-printed ASA shows a modulus of 1.6–1.8 GPa, lower than its bulk value of 2.0–2.4 GPa. 24 These reductions are due to the weak interlayer bonding and internal voids formed during the FDM process.
As can be seen in Figure 7, in contrast, SLA-printed materials generally retain better mechanical properties. Rigid 10K, despite being underpost-cured in this study, showed a modulus of 3.58 GPa, lower than its expected 10–11 GPa, but still higher than FDM-printed materials. Tough 2000, designed to mimic ABS, exhibited good elongation at break (~45%), indicating better interlayer bonding and fewer internal defects.
Tensile properties of the samples. (A) Young’s modulus (B) yield strength (C) elongation at break.
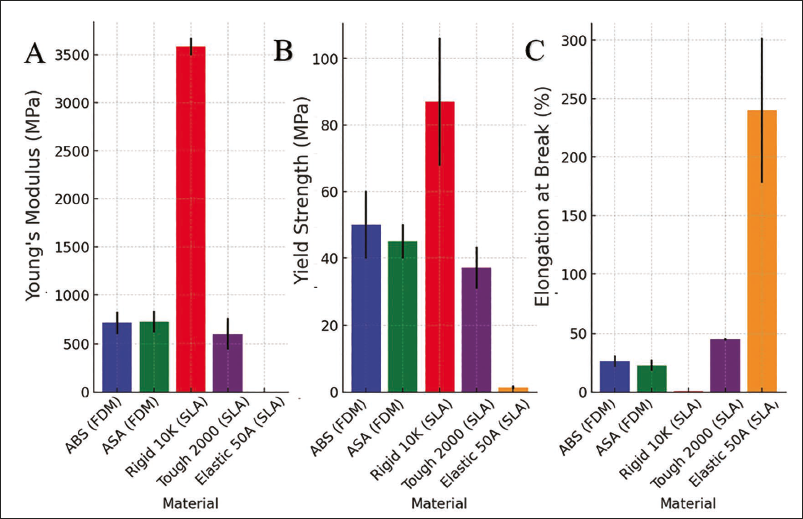
As shown in Figure 7C, both ABS and ASA showed a significant reduction in elongation at break when printed via FDM—ABS dropped to 4.9% from 9% to 10% in bulk, and ASA decreased to ~3%. SLA materials, like Tough 2000, maintained high ductility, with elongation at break around 45%, and Elastic 50A showed extreme elongation (~240%) without failure. The differences between FDM and SLA are attributed to the distinct printing processes. FDM’s layer-by-layer extrusion creates weak interfaces and internal voids, 9 while SLA’s photopolymerisation results in better adhesion between layers. Proper post-processing of SLA materials, like curing, can further improve their mechanical properties, reducing the performance gap between the two methods.
Flexural properties
FDM samples
The flexural modulus of ABS typically ranges from 1.8 to 2.6 GPa, depending on factors such as printing parameters and filament quality. 38 As can be seen in Table 5, ABS samples exhibited a modulus at the higher end of this range, indicating good print fidelity and minimised void content. Microscope analysis confirmed relatively uniform filament deposition with minimal interlayer porosity, consistent with strong mechanical performance. However, ABS parts were susceptible to interlayer delamination, particularly when loaded perpendicular to the print layers, highlighting the material’s sensitivity to anisotropy, as corroborated by the findings of Coogan and Kazmer. 39
Flexural properties of fused deposition modelling (FDM) printed samples.
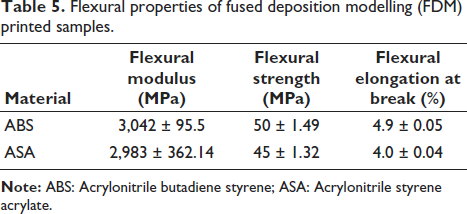
ASA samples displayed a flexural modulus slightly lower than ABS, consistent with literature values ranging from 2.0 to 2.8 GPa. Surface microscopy revealed a rougher texture and increased microvoid prevalence compared to ABS, which may have contributed to a slightly lower ultimate flexural strength despite similar stiffness. This observation aligns with previous work indicating that ASA’s improved environmental resistance may come at a minor cost to mechanical homogeneity in FDM prints. 40
SLA samples
Rigid 10K has a reported flexural modulus of 9,000 MPa. However, as shown in Table 6, the specimens achieved a significantly higher modulus of 18,715 MPa, likely attributable to optimised post-curing and favourable print orientation. Microscopically, Rigid 10K parts showed an exceptionally smooth, defect-free surface and sharp fracture edges, indicating brittle failure with negligible plastic deformation. These findings are consistent with observations by Jeršovaitė et al., 41 who reported that post-curing increases the crosslink density of SLA resins, substantially enhancing stiffness and strength at the expense of ductility.
Flexural properties of stereolithography (SLA) printed samples.
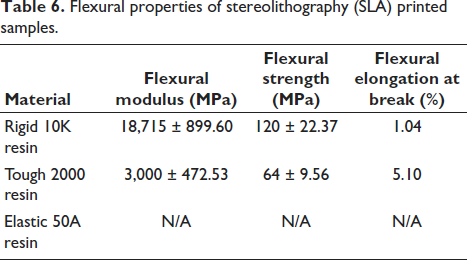
Tough 2000 resin has a cited tensile modulus of approximately 1,900 MPa. However, our tests recorded a value of approximately 3,000 MPa. This higher performance is likely due to optimal UV curing and specimen geometry, which can significantly impact mechanical properties. Microscope examination showed minor waviness in the surface but no major defects, supporting good but not flawless interlayer bonding. The material demonstrated ductile failure with visible plastic deformation, aligning with findings by Kreiger and Pearce, 42 who noted that SLA resins formulated for toughness exhibit a trade-off between stiffness and ductility.
Elastic 50A resin had an extremely low flexural modulus, which precluded traditional three-point bending analysis. Even under extended displacement, no material failure or significant deformation was observed, corroborating the material’s exceptional elasticity. Microscope imaging revealed a flawless, highly elastic surface, with no evidence of microcracking or stress concentrations. These observations are consistent with prior studies by Alarifi, 43 who described the unique challenges of mechanically characterising soft SLA elastomers, which behave more like highly resilient rubbers than rigid plastics.
FDM versus SLA
The comparison between FDM- and SLA-printed specimens highlights critical distinctions in mechanical performance, as shown in Figure 8, surface quality, and failure modes, driven by the inherent differences in each manufacturing process. SLA-printed parts, particularly those made from Rigid 10K resin, exhibited superior flexural stiffness and surface finish compared to FDM-printed ABS and ASA samples. The measured flexural moduli of SLA materials were consistently higher, aligning with previous findings that photopolymerised networks achieve higher crosslink density and material homogeneity than thermoplastic FDM structures.
Flexural properties of the samples. (A) Flexural modulus (B) flexural strength (C) flexural at break.
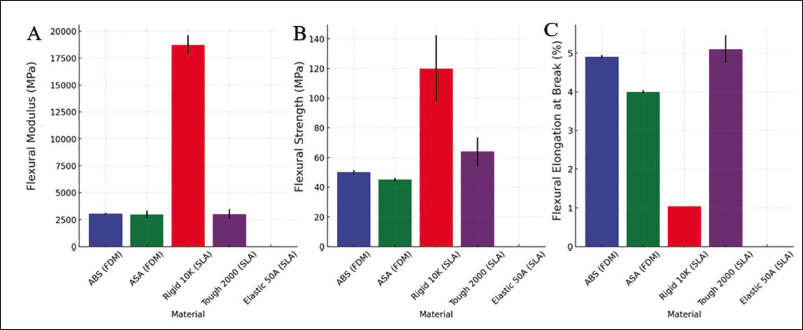
In terms of failure behaviour, SLA parts displayed a brittle fracture mode with sudden catastrophic failure, while FDM parts failed more gradually through delamination and filament pull-out, which is shown in Figure 9. Microscale analysis confirmed that SLA components had minimal void content and a smooth, continuous structure, contrasting with the layer interfaces and microvoids commonly found in FDM prints. These microstructural differences translated directly into mechanical performance: SLA samples demonstrated quasi-isotropic behaviour with minimal sensitivity to print orientation, whereas FDM parts showed significant anisotropy, with markedly reduced flexural strength when load was applied perpendicular to the print layers.
Optical micrographs of the flexural fracture surface of the (A) fused deposition modelling (FDM) printed acrylonitrile butadiene styrene (ABS) (B) FDM printed acrylonitrile styrene acrylate (ASA) (C) stereolithography (SLA) Rigid 10K resin (D) Tough 2000 resin.
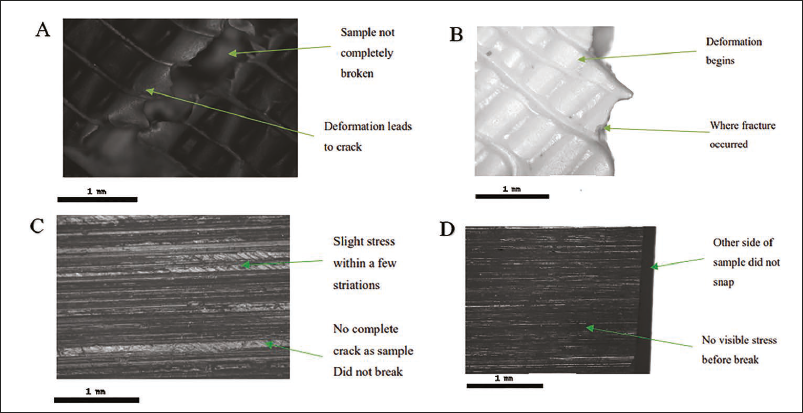
Despite SLA’s advantages in mechanical uniformity and surface quality, FDM offers practical benefits, including material ductility, simpler post-processing and greater flexibility in material choice. FDM parts displayed a more gradual failure progression, which may be advantageous in applications where warning before failure is critical. Therefore, while SLA provides higher initial mechanical performance, its brittleness and the need for meticulous post-curing must be considered when selecting a manufacturing approach for load-bearing or dynamic applications.
Harness properties
FDM samples
In Table 7, the ASA sample showed slightly higher hardness than ABS 35.6 versus 32.6. This trend aligns with expectations, as ASA is similar to ABS but typically formulated for improved weather resistance; mechanically, it can have equal or slightly higher stiffness and hardness than ABS in some cases. 28 The literature on FDM ASA hardness is limited, but a recent study on ASA-based composites measured microhardness values on the order of 15 HV, comparable to ABS. Our higher absolute values still reflect the same relationship, ASA being marginally harder than ABS. 25
Hardness results for the fused deposition modelling (FDM) printed samples.

Microscopic examination of the FDM samples, shown in Figure 2, revealed distinct layer lines, surface texture and internal voids. Small microvoids and incomplete inter-layer bonds were visible in the cross-section. These microstructural defects are well documented in FDM parts. Indentations that happen to fall on or near a porous region penetrate more easily, yielding a lower hardness reading. Gao et al. 44 observed this effect in FDM polyether ether ketone (PEEK) samples: the FDM-printed PEEK had significantly lower surface hardness than its injection-moulded counterpart due to the layered microstructure, and the internal voids were identified as the main cause of failure and surface property deterioration. In our FDM ABS/ASA, the rough surface finish and microvoids similarly contribute to a lower measured surface hardness compared to a fully dense, smooth material.
SLA samples
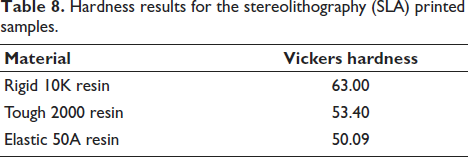
The SLA-printed resin samples showed considerably higher hardness values, as can be seen in Table 8. The Tough 2000 resin had an average hardness of 53.4, and the Elastic 50A resin measured about 50.09. Rigid 10K resin possesses an untenable Vickers hardness value of 63, which stands out higher than the rest. Tough 2000 is an engineering-grade photopolymer designed to mimic ABS-like toughness, so a high hardness is expected. In fact, a hardness in the 50+ range would be well above typical values for unfilled standard resins (usually ~15–20 HV), indicating that Tough 2000 likely has a highly crosslinked matrix or added reinforcing ingredients to increase stiffness. 45 By contrast, the Elastic 50A resin is a soft elastomeric material. Surprisingly, the Elastic 50A sample still exhibited a micro-indentation hardness on par with Tough 2000 in our tests. The nature of the hardness test can rationalise this counterintuitive result: even a very elastic polymer can resist a quick, localised indent due to the crosslinked polymer network.
Hardness results for the stereolithography (SLA) printed samples.
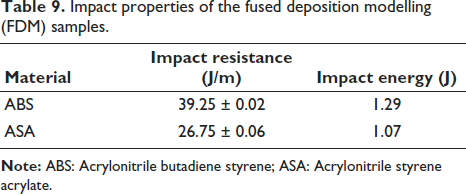
Impact properties of the fused deposition modelling (FDM) samples.
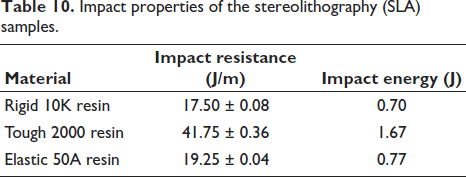
Impact properties of the stereolithography (SLA) samples.
FDM versus SLA
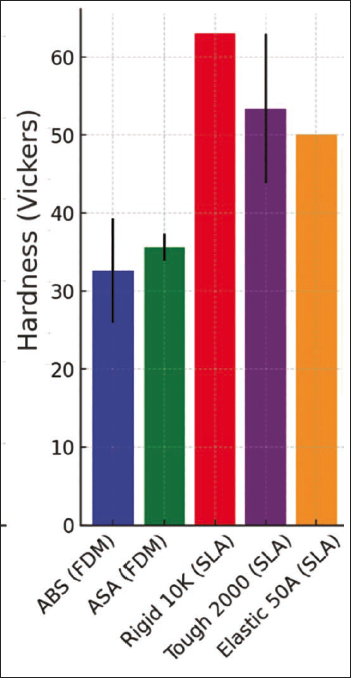
Comparing the FDM and SLA materials as shown in Figure 10, a clear trend is observed: the SLA-printed resins exhibit higher surface hardness than the FDM thermoplastics. This can be attributed to both the intrinsic material properties and the superior surface quality that can be achieved with SLA. SLA-printed materials tend to have superior surface hardness compared to FDM-printed thermoplastics, largely due to the SLA process’s ability to produce smoother, denser surfaces and the use of high-hardness resin formulations. Meanwhile, FDM parts show lower hardness values, constrained by the inherent roughness and weaker inter-layer bonding of the FDM process. 45
Hardness properties of the samples.
Impact properties
FDM samples
The ABS samples printed by FDM in this study absorbed substantial impact energy, with fracture surfaces showing little plastic deformation and bead pull-out. This behaviour is consistent with recent reports of high Charpy impact strength in 3D-printed ABS. Galeja et al., 24 found that FDM ABS parts can even exceed injection-moulded ABS in impact toughness, a counterintuitive benefit attributed to the filaments’ laminate-like layering. Microscopy of our fractured ABS faces, shown in Figure 11A, revealed crack paths following the filament boundaries and microvoids between beads, indicative of weak interlayer bonding. This matches the ‘diffuse damage’ model of Guessasma and Belhabib, 46 who showed that weak adhesion between adjacent filaments governs crack propagation in printed ABS.
Optical micrographs of the impact fracture surface of the fused deposition modelling (FDM) printed. (A) Acrylonitrile butadiene styrene (ABS) and (B) acrylonitrile styrene acrylate (ASA).
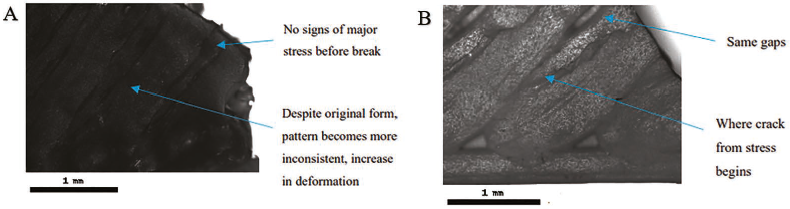
The FDM-printed ASA samples showed somewhat lower impact resistance than ABS, in line with literature’s values (~0.10–0.17 J/mm 2 in Charpy tests). 47 In our tests shown in Figure 11, ASA specimens often remained partially intact after the impact, with zig-zag crack paths rather than clean breaks. This agrees with Hameed et al. 47 observation that layer height and infill affect ASA toughness, with printed layers deflecting cracks and preventing straight fracture propagation. Table 9 summarises the measured impact resistance and energy for both FDM materials.
SLA samples
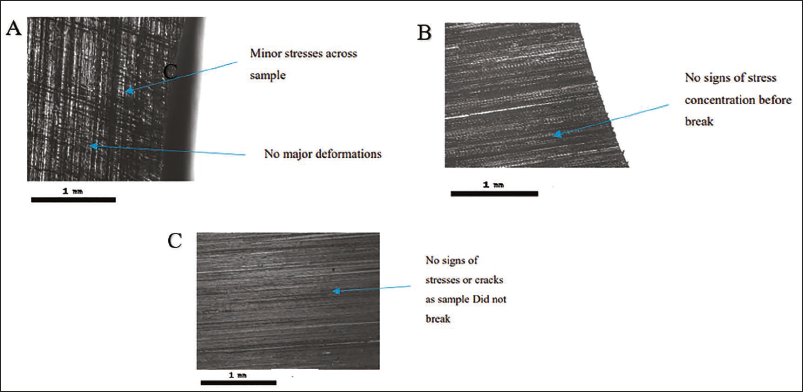
The SLA-printed resins exhibited fracture behaviours strongly tied to their chemistry. Tough 2000 resin parts failed in a more ductile manner than the other resins: the fracture surfaces showed significant plastic zones and fibrillation, and specimens sustained large deformations before rupture, which can be seen in Figure 12A. This is consistent with Tough 2000’s ABS-like formulation and reported mechanical behaviour: Riccio et al. found that Tough 2000 (like Durable resin) absorbs >90% of impact energy in plastic deformation. 33 After UV post-curing, Tough 2000’s stiffness increased (+59% tensile strength), but it retained ductility, explaining why our samples did not shatter. In contrast, the Rigid 10K resin fractured in a very brittle manner: its broken surface was nearly flat and exhibited little necking. This brittleness after curing is in line with known trends: SLA resins generally become more rigid and prone to brittle failure upon post-curing due to shrinkage and residual stress. The Elastic 50A resin behaved like a rubbery elastomer, as shown in Figure 12C. Specimens elongated markedly under impact, and the fracture faces were fibrous and highly stretched. This indicates very high energy dissipation and strain recovery, as expected for a Shore-50A elastomer. The impact results for SLA samples are summarised in Table 10.
Optical micrographs of the tensile fracture surface of the fused deposition modelling (FDM) printed. (A) Rigid 10K resin (B) Tough 2000 resin (C) Elastic 50A resin.
FDM versus SLA
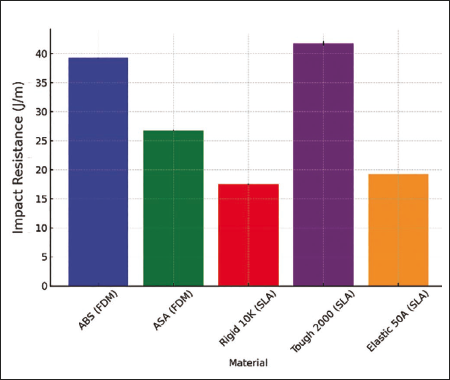
Comparing the FDM and SLA, shown in Figure 13, groups reveal marked differences in impact performance and failure mode. In general, the FDM samples (ABS, ASA) exhibited more ductile, energy-dissipative fractures than most SLA samples. For example, our FDM ABS parts deflected cracks along their filament networks, producing gradually advancing fractures and high impact toughness.24, 46 By contrast, most SLA parts (except the elastomer) tended to fail more abruptly. SLA prints have finer resolution and essentially no voids, yielding isotropic fracture planes, but their crosslinked networks are often brittle, especially after cure. 33 Hence, the Rigid 10K samples cracked cleanly, whereas the elastomer and Tough 2000 showed ductile tearing. These observations mirror the literature: 3D-printed ABS via FDM can absorb anomalously large impact energy due to its anisotropic filament arrangement. While UV-cured SLA materials generally become stiffer and less tough after a full cure.24, 46
Impact properties of the samples.
Conclusions
In conclusion, this study comprehensively compared the performance of five 3D-printed materials manufactured using FDM and SLA, highlighting the distinct differences in surface quality, mechanical behaviour and structural characteristics inherent to each printing technique.
FDM-printed materials, specifically ABS and ASA, demonstrated reasonable mechanical strength and impact resistance, particularly in the case of ABS, which closely rivalled the performance of SLA’s Tough 2000 resin in impact testing. However, the FDM process inherently produced more pronounced layer lines, microvoids, and surface irregularities, which were clearly visible under microscopic examination. These imperfections contributed to modest reductions in tensile strength, flexural modulus and surface hardness, particularly when compared to the finer resolution and uniform interlayer bonding observed in SLA-printed components. In contrast, SLA-printed materials Rigid 10K, Tough 2000 and Elastic 50A consistently exhibited superior surface finish, dimensional accuracy and microstructural integrity. These advantages translated into higher tensile and flexural strengths for rigid resins, and greater elasticity and surface resilience for flexible formulations. The SLA process’s photopolymerisation mechanism allowed for smoother surfaces and cleaner fracture profiles, leading to more predictable and controlled mechanical behaviour across all testing modes. However, this came with trade-offs, as seen in the brittle failure mode of Rigid 10K under impact loading, emphasising the importance of matching material properties to application-specific demands.
However, several limitations of this study should be acknowledged. First, all specimens were tested in their as-printed state with only minimal post-processing. No additional treatments, such as annealing or surface finishes, were applied, which might otherwise enhance material properties. Also, the scope of this comparison was confined to the selected five materials and a fundamental set of mechanical tests. As a result, the conclusions may not fully generalise to other polymer systems or performance aspects (e.g., long-term fatigue durability, creep or thermal stability) that were beyond this study’s scope.
Despite these limitations, the present findings carry clear practical implications for design and material selection, particularly for aerospace and consumer product applications. For aerospace components, where high strength-to-weight ratios, precision and reliability are paramount, the superior stiffness and accuracy of SLA-printed parts (especially those made from a rigid resin) could prove advantageous. By contrast, the greater ductility and impact absorption observed in FDM thermoplastics might benefit designs requiring energy dissipation or tolerance to vibrations. In consumer product development, the trade-offs highlighted by this study inform the balance between aesthetics and functionality. SLA’s excellent surface finish and detail resolution make it well-suited for products or prototype models where fine features and smooth appearance are critical. Conversely, FDM materials offer robust performance and cost efficiency for durable parts intended to withstand everyday use. Ultimately, by understanding the distinct behaviours of FDM and SLA materials elucidated in this study, engineers and designers can make more informed decisions when selecting 3D printing technologies for specific real-world applications in aerospace, consumer goods and beyond.
Footnotes
Declaration of Conflicting Interests
The author declared no potential conflicts of interest with respect to the research, authorship and/or publication of this article.
Funding
The author received no financial support for the research, authorship and/or publication of this article.