
Abstract
Recent studies have been conducted on the characteristics of volatile organic compound emissions; most of them are focused on wood-based building materials, scarcely mentioned about leather or leather imitates. The volatile organic compound emissions of these products may cause poor indoor (vehicle cabins included) air quality. This article takes formaldehyde as an example to study its diffusion in leather. The porous structure of leather was characterized by carrying out mercury intrusion porosimetry test. The formaldehyde diffusivities in leather was assessed by Blondeau et al.’s, Ataka et al.’s, and Xiong et al.’s models which represent parallel, equivalent, and series interconnection of pores, respectively, and validated through independent liquid inner tube diffusion film emission experiments. The results demonstrated that the fractal dimension of leather is 2.19, which indicated it is a porous medium with self-similar pore structure. Most of the pores in leather were macro pores with average diameter 16.56 μm which contributed to 95.9% of whole porosity and the meso pore with average diameter 0.60 μm which contributed to 4.1%. As far as the liquid inner tube diffusion film emission experiment shows, the Xiong model agrees much better with the experimental results than the other two. The two kinds of pores were considered to be serially connected. It is useful for predicting volatile organic compounds diffusion coefficient in a short time and can be applied to the design and development of low volatile organic compound emission leather or leather imitates within further research.
Keywords
Introduction
Leather is a material manufactured from the collagen fiber network of hides and skins, endowed with the characteristics required for the intended purpose. 1 Worldwide, shoe leathers (uppers and linings) are the dominant leather types, and upholstery leathers, especially furnishings and automotive leather, are winning an increasing market share. 2 Leather imitates (leather-like materials) are flexible sheets that have a surface structure similar to that of leather. The automobile industry uses leather imitates for seats, panels for doors, and dashboards of the car interior. 3 The volatile organic compound (VOCs) emissions of leather or leather imitates products may cause poor indoor (vehicle cabins included) air quality (IAQ).4–10 Around the globe, people spend approximately 90% of their time indoors, thus making the IAQ have a significant impact on the modern life. 11 VOCs will off-gas into the air and exposures to them have recently become a public concern. Many studies indicated that short- and long-term exposure to mixtures of VOCs may cause mucosal irritation, non-specific symptoms. 12 , 13 Therefore, VOCs emitted from a wide range of building materials and consumer products often pose a threat to the environment safety and human health. To understand and control this issue, the research on VOC emissions has become a hot interdisciplinary topic in the fields of material and environmental sciences. Although many studies have been conducted on the characteristics of VOC emissions, most of them are focused on wood-based building materials,14–20 scarcely mentioned about leather or leather imitates.
The knowledge of effective diffusivity of VOCs is of central importance when modeling surface and contaminant interactions in IAQ simulations. In addition, collagen or chemical fibers, with a wide range of diameters, ramifications, and reticular networks with the widest conceivable variation in weave angle, make the leather or leather imitates own the porous structure. 21 It is necessary and meaningful to find out the relationship between pore structure and the diffusion coefficient of VOCs. Carniglia proposed a methodology to assess the diffusion coefficients of gaseous species in very specific porous materials such as catalysts and oxidants. 22 Blondeau et al., 23 Ataka et al., 24 and Xiong et al. 25 have successfully applied the methodology to building material and contaminant systems. The purpose of our study is accordingly to assess whether these methodologies may also be successfully applied to leather or leather imitates and find which model may be most suitable.
VOCs emitted from leather or leather imitates mainly contained formaldehyde (FA), benzene, toluene, xylene, ethylbenzene, styrene, acetaldehyde, and so on. FA has a penetrating odor and it irritates the eyes and mucous membranes, and it has been found to have an allergenic potential. 26 , 27 It is classified as a probable human carcinogen by the International Agency for Research on Cancer. 28 Considering the harmfulness of FA, this article takes FA as a target VOC to study its diffusivity in leather as an example. Related methods and models used in the article are expected to be applied to other VOCs in leather or leather imitates.
Although FA was not directly used in the leather manufacturing process, most of the syntans and chemical auxiliaries available today in the market are products made by condensation polymerization reaction using FA as a condensing agent. 29 , 30 As a result, FA may occur in leather products as a result of inadvertent migration and evaporation from products during the process of tanning, finishing, and using. 31 , 32 This article investigates three models to assess the diffusion coefficients of FA in leather. It consists first in carrying out mercury intrusion porosimetry (MIP) test to characterize the porous structure of leather and then applying above-mentioned mathematical models to estimate the effective diffusivities of FA in leather. The main contents include (1) a detailed analysis of the measured porous properties of leather, (2) an analysis of the computed effective diffusivities of FA in the leather, and (3) a comparison between effective diffusivities computed from models and data from a FA LIFE (liquid inner tube diffusion film emission) experiment. 33
Fundamentals of the models
MIP test and material properties calculated
MIP consists in intruding mercury, a non-wetting liquid, into the porous structure of the material under stringently controlled pressures. The pressure versus intrusion data give its pore size distribution (PSD) using the Laplace equation 34

where γ is the surface tension, 0.485 N/m; θ is the contact angle of the meniscus of mercury in a pore, 130° is recommended in the absence of specific information; Pi is the pressure, Pa; r is intrusion pores radius, m; i is ith interval of pressure in the process of MIP. Each ri corresponds to a volume ΔVi (m3/kg), which represents the void volume of all pores having the radius ri. Some material properties which can be directly given or indirectly calculated by the MIP test are as follows. 35 , 36
The total volume porosity of the material, ε, is given by the sum of the pore group porosities, ΔVi, times the bulk density of the material, ρ (kg/m3)
where n is the pressure interval number.
The effective surface area of all pores, S (m2/g), may be derived from the MIP data or calculated by using the following relation
The tortuosity factor, τ, accounts for the geometric constraints which give a longer diffusion path and, thus, a reduced concentration gradient in the flow direction, may be derived from the MIP data by using the following relation, where E is the pore shape exponent (1 for cylinders is used usually)

and

The fractal dimension of a material, D, is a parameter that can characterize the degree of roughness of its surface. According to thermodynamic theory in the process of MIP, it may be derived by the following relation 37

where V is the total volume of the mercury crushed into porous media, m3; C is a constant. In order to calculate D easily, let

Equation (6) will be changed into the following style, where

We can compute a pair of Qn and Wn for a natural number n using MIP data. Using ln(Qn) as the abscissa and ln(Wn) as the ordinate, we can linearly simulate the series of ln(Qn) and ln(Wn), and get a slope and a correlation coefficient (R2). If R2 is approximately equal to 1, the slope is the surface fractal dimension of the sample.
Diffusion mechanisms and pore size
Porous materials have generally complicate pore structures consisting of random network of interconnection pores of varying diameter and orientation. The mean free path, λ (m), is the average distance a molecule travels before it collides with another molecule, which can be estimated from the following relation 38

where P is the pressure, Pa; T the temperature, K; R the universal gas constant, 8.314 J/mol/K, μ the dynamic viscosity of the air at temperature T, kg/m/s; and M the molecular mass of diffusing species (kg/mol).
Knudsen number is defined as the ratio of the mean free path to the pore diameter (λ / d). Different types of diffusion can occur in the pores depending on Knudsen number, 39 which is listed in Table 1.
The relationship between Knudsen number and types of diffusion.

Molecular diffusion coefficient (DM) of binary gas mixtures can be estimated using the Maxwell–Gilliland equation 40

where P is the pressure, kPa; T the temperature, K; M the molecular mass, g/mol; V the molecular volume of gas species, cm3/mol. Gas A is FA and B is air in the article.
Knudsen diffusion coefficient (DK) in gases in a straight cylindrical pore can be estimated using the following relation

where r is pore radius, m; T the temperature, K; M the molecular mass, g/mol.
Transition diffusion coefficient (DT), for equimolar counter diffusion can be calculated using the formula

The contributions of molecular and Knudsen diffusions to the mass transport within porous material can be combined in a single diffusion coefficient called effective diffusion coefficient (De), which may be calculated from the relation

where ε, τ may be obtained from MIP test. D0, the mean diffusion coefficient in the pores of the material, relates to the porous network geometry and the character of the diffusing species.
Mean diffusion coefficient and modes of pore interconnection
Pores are the main channel of FA diffusion, but the shape, size, and interconnection of pores are quite complex, and it is difficult to represent them perfectly with a model. It can be concluded that the complex pore network in leather can be considered as a combination of many simple pores, and a corresponding model is established. There are mainly three models: Ataka’s model, Blondeau’s model, and Xiong’s model, which represent equivalent, parallel, and series interconnection of pores, respectively (shown in Figure 1). The connection between pores has a direct influence on the calculation of mean diffusion coefficient (D0).
Modes of pore interconnection of leather.
Ataka et al. calculate the mean diffusion coefficient by reducing all kinds of pores into an equivalent pore and using the transition diffusion theory. First, use the average pore radius got by MIP data as the equivalent pore radius (r0) and then use equations (11)–(13) to calculate the mean diffusion coefficient, in this model, D0 = DT.
Blondeau et al. deal with the pores as parallel connections, D0 can be computed from the relation

where D(r) describes the way the diffusion coefficient varies as a function of the pore radius r. In most cases, it may be defined as

Xiong et al. deal with the pores as series connections. The pore whose diameter is greater than 100λ is called a macro pore, and has porosity ε1 with average diameter d1; the pore whose diameter is less than 100λ is called a meso pore, and has porosity ε2, with average diameter d2. Average diameter is calculated using the formula

where V is the pore volume and S is the surface area. The surface area S is determined by the cumulative pore area from the MIP. D0 can be computed from the relation
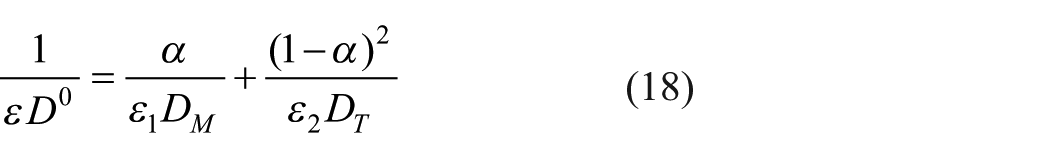
where α is defined as

Experimental section
The chrome-tanned sheep garment leather (with no fat-liquoring and coating), which was provided by local leather factory, was investigated. In order to validate the above models, the following experiments were carried out.
Preparation of sample and determination of thickness of leather
The leather sample was prepared and conditioned as ISO 2419. The thickness was determinate according to ISO 2589.
Scanning electron microscope observation
Leather was cut into a small narrow strip with 0.5–1 mm width, keeping the edges straight. The cross section of strips was coated with gold; the scanning electron microscope (SEM) (SU-1500, Japan) was used to observe its microstructure topography.
MIP test
Leather sample was dried during 24 h to 80°C. Mercury injection measurements have been carried out with Micromeritics porosimeter (AutoPore IV 9500) whose range of pressure reaches 413 MPa. This pressure allows the mercury to penetrate pores of 3 nm diameter approximately, according to Laplace’s law (see equation (1)).
A FA LIFE experiment
Figure 2 is a schematic of the FA diffusion liquid inner tube. It is composed of a 125-mL glass tube that holds 20 mL 3.7% FA solution (mass fraction, 3.7 g FA per 100 mL water) as the emission source, a hollow thread cap with 30 mm inner diameter. The opening of the tube is covered with leather sample so as to assess the FA diffusivity in leather. Figure 3 is a schematic of FA diffusion liquid inner tube placed in a 1 m3 ventilated chamber (QWH-1000B, produced by Jinan Hainate Technology Co. Ltd., China). The experiments were carried out at (30 ± 0.5)°C, (50 ± 3)% relative humidity, and Q = 1 m3/h (Q is the airflow rate). The chamber is made of stainless steel, with a fan in the top to promote the mixing of the FA in the air. The PPM-400ST FA meter whose precision is 1 ppb with a response time of about 60 s was used to monitor the FA concentration at regular intervals until it approached equilibrium (the relative deviation of the mean concentration during the last two sampling points to that during the preceding two points is less than 5.00%).
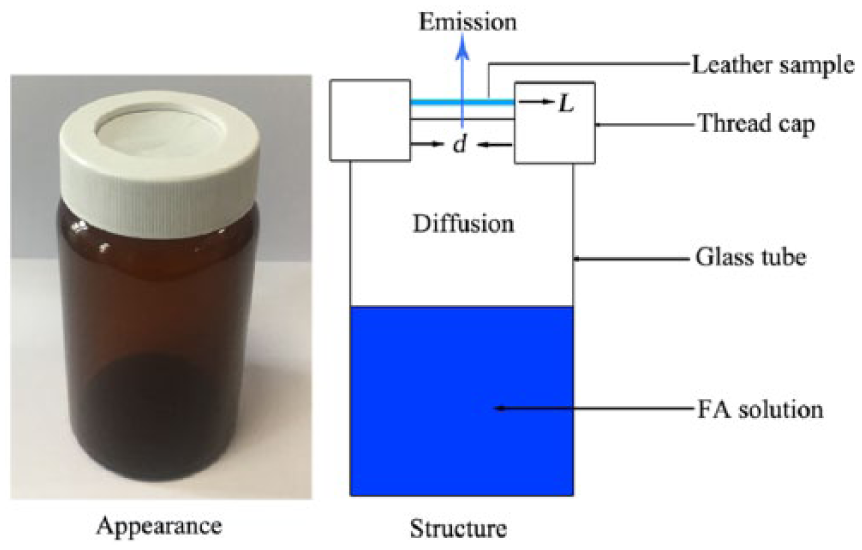
Schematic of FA liquid inner tube diffusion film (leather) emission.

Schematic of diffusion liquid inner tube in a ventilated chamber.
Results and discussion
SEM image of leather
The representative cross- and longitudinal-section images from the SEM of leather are displayed in Figure 4. For porous materials, secondary electrons cannot be generated in the pores, so they cannot be imaged and show a deeper color. This is the basis for the analysis of SEM images of porous materials. SEM can directly and realistically present the three-dimensional conformation of collagen fibers network. The image shows that the leather is composed of many pores with different sizes. According to the ruler, the pores observed by SEM are larger pores, usually microns scale.

Representative SEM cross section image of leather: (a) cross section and (b) longitudinal section.
PSD of leather
The PSD of leather is shown in Figure 5. The figure shows that the pores diameter of leather ranges from 95 nm to 182 μm, approximately 80% of total pore volume was formed by the pores with diameter at 6–30 μm. The results were in accordance with Figure 4, the pores in leather were usually microns scale.

Pore size distribution of leather.
Leather properties from MIP experiments
Properties that can be directly given or indirectly calculated by the MIP test were listed in Table 2. These properties mainly contained the total porosity (ε), bulk density (ρ), average pore diameter (d0), total pore area (S), and tortuosity factor (τ).
Leather properties from the MIP experiments.

MIP: mercury intrusion porosimetry.
The fractal dimension of leather
According to thermodynamic theory in the process of MIP, linear fits of ln(Qn) and ln(Wn) are shown in Figure 6. The figure shows that R2 = 0.9840, approximately equal to 1, so the slope is the surface fractal dimension of leather. D = 2.19 which is smaller than 3 (extremely rough surface) and greater than 2 (smooth surface) indicated that the pore distribution is irregular and complex. The results indicated that leather is a porous medium with self-similar micro pore structure, the properties and PSD obtained from MIP experiments using very small part of leather could represent the whole leather.
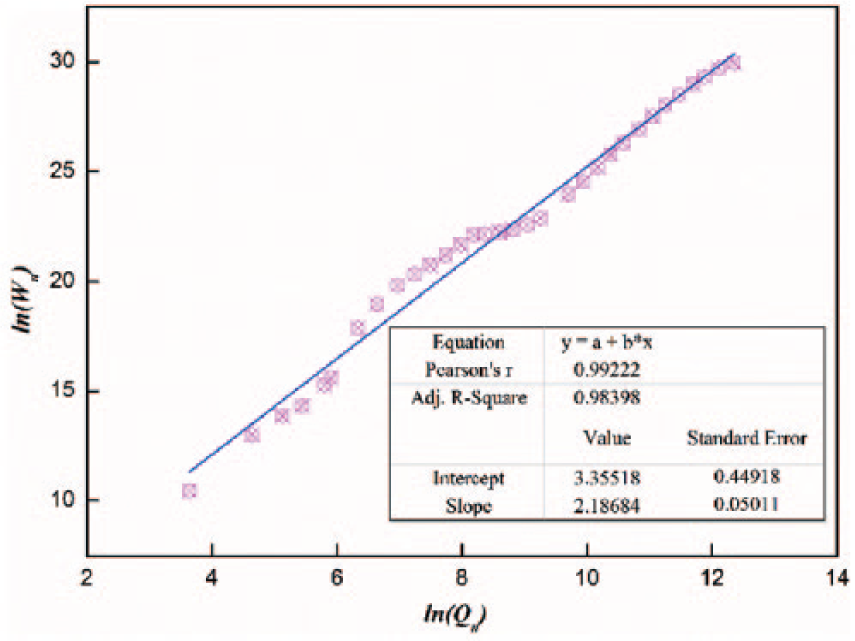
Linear fit of ln(Qn) and ln(Wn).
Diffusion mechanisms confirmed
According to equations (10) and (11), the mean free path (λ) and molecular diffusion coefficient (DM) of FA in air were calculated and shown in Table 3. Based on Knudsen number, when pore diameter ⩾ 100λ = 3.530 μm, molecular diffusion occurs; pore diameter ⩽ 0.1λ = 3.53 nm, Knudsen diffusion occurs; other pore sizes, transition diffusion occurs. According to the results of PSD of leather, the pores diameter ranges from 95 nm to 182 μm, so only molecular diffusion and transition diffusion could occur in leather.
The value of λ and DM of FA at 303 K in normal pressure.

FA: formaldehyde.
Mean and effective diffusion coefficient computed
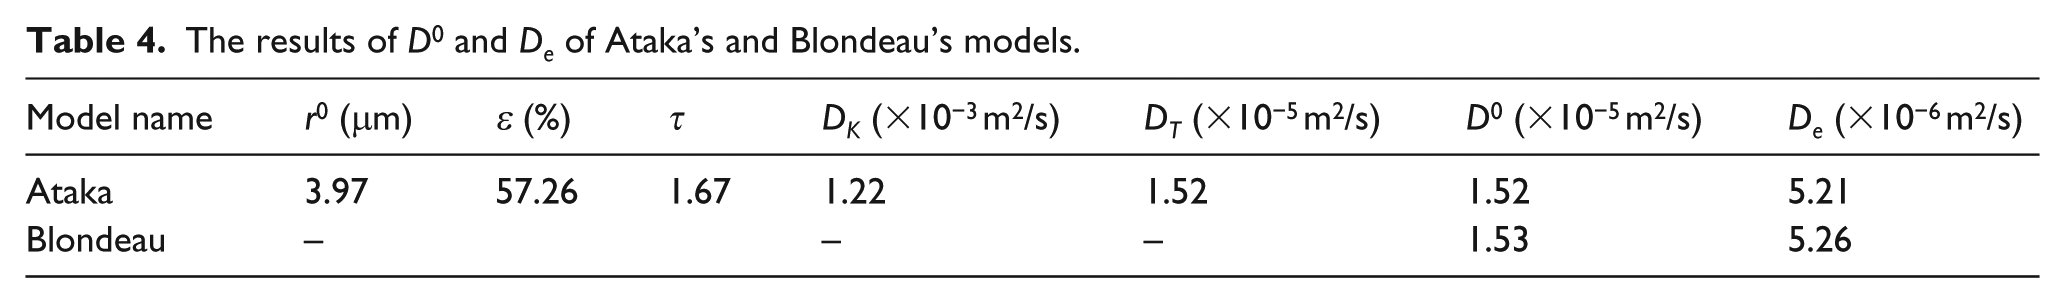
According to the mathematical principle of Ataka’s and Blondeau’s models, the mean and effective diffusion coefficient were computed as listed in Table 4. It was obvious that the results of these two models are similar. Although Ataka’s model took into account the relationship between the pore size and diffusion and used the transition diffusion theory, the equivalent pore radius (r0 = 3.97 μm) of leather was larger than 100λ = 3.530 μm, and the molecular diffusion dominated in such pores. Blondeau’s model discarded the effect of pore size on diffusion and assumed molecular diffusion directly. So the results of mean diffusion coefficients of these two models are similar and near to molecular diffusion coefficient (DM).
The results of D0 and De of Ataka’s and Blondeau’s models.
According to mathematical principle of Xiong’s models, the mean and effective diffusion coefficient were computed as listed in Table 5. The results indicated that most of the pores in leather were macro pores with average diameter 16.56 μm which contributed to 95.9% of whole porosity. Although the meso pore with average diameter 0.60 μm contributed to 4.1% of whole porosity which accounted for a small segment, its effect on mean diffusion coefficient is very important and controlled the entire diffusion process.
The results of D0 and De of Xiong’s model.

Mass transfer model in FA LIFE experiment
The FA emission process in LIFE experiment mainly includes (1) evaporation of FA solution in tubes and diffusion of FA molecules in the air layer inside tubes, (2) diffusion of FA molecules in leather, and (3) convection of FA molecules in environmental chamber air. Compared to the diffusion of FA molecules in leather, the diffusion of FA molecules in the air layer inside tubes can be neglected. The equilibrium FA concentration (Cb, g/m3) in the tube headspace can be computed by Henry’s law 41

where V is the volume of the solution, L; m is the FA mass in the solution, g; and R is the gas constant, J/mol/K

where H is the Henry’s law constant, mol/L/atm; and T is the temperature in the chamber, K.
According to the fundamentals of mass transfer, 42 the emission process (2) can be written as follows
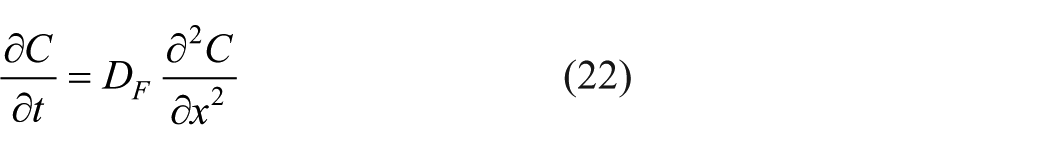
where C is the FA concentration in leather, mg/m3; x is the dimension of the leather in the direction of the emissions, m; t is time, s; and DF is the diffusion coefficient of FA in leather, m2/s.
Assuming the FA concentration in the chamber’s inlet airflow is zero, the mass conservation equation for the FA in chamber air is written as follows
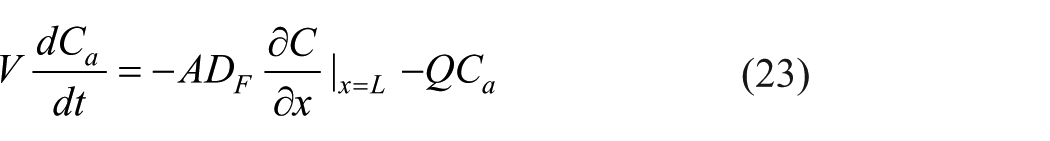
where Ca is the FA concentration in chamber, mg/m3; V is the volume of the chamber, m3; A is the emission area of the leather, m2; and L is the thickness of the leather, m.
The boundary and initial relation in the whole emission process are written as follows


where K is the partition coefficient between the leather and air, hm is the convective mass transfer coefficient, m/s.
By using the Laplace transform method to equations (22)–(27), 15 the analytic solution of air FA concentration in the chamber can be obtained

where Bim is the Biot number for heat transfer (= hmL/DF); β is the volume ratio between leather and chamber (= AL/V); α is the dimensionless ventilation rate (= QL2/VDF). An is written as follows

qn are the positive roots of

When the emission process reaches the equilibrium state, the equilibrium chamber VOC concentration, Cequ, can be represented as

For most materials in indoor environment conditions, Bim/K is in the range of 20–700, 43 so the α/(βK) ≫ α/(βBim) 1. Equation (31) can be rewritten as follows

According to the multi-phase models which describe VOC transfer in a porous material, 44 the effective VOC gas-phase diffusion coefficient within leather (the porous material) can be written as follows

Combining equations (32) and (33), we get

The FA effective diffusion coefficient within leather can be computed from the LIFE experiment. The parameters measured by experiments and results were listed in Table 6.
The results of De from LIFE experiment.

LIFE: liquid inner tube diffusion film emission.
Comparison between De computed from models and LIFE experiment
From the above discussions, the De computed from Xiong’s model and LIFE experiment is on the same order of 10−7 m2/s, which is much smaller than those obtained by Ataka’s and Blondeau’s models which are on the order of 10−6 m2/s. This may be due to an inaccurate computation of the mean diffusion coefficient in the pores of the leather. According to the results of PSD of leather, molecular diffusion and transition diffusion could occur in leather simultaneously. Assuming molecular diffusion or transition diffusion occurs alone could not accurately represent the practical phenomenon.
It must be stated that the De computed from Xiong’s model is a little bigger than LIFE experiment. This is because Xiong’s model which is based on the MIP test only depends on the physical properties and characters of leather. The De was calculated by reasonable model assumptions without consideration of the effects of the relative humidity, adsorption/desorption interactions between FA and leather. The literature 33 had demonstrated that the increase of relative humidity will lead to the decrease of diffusion coefficient.
Conclusion
The MIP test indicates that leather is a porous medium with self-similar micro pore structure and the fractal dimension of leather is 2.19. The PSD of leather shows that the pores diameters of leather range from 95 nm to 182 μm, approximately 80% of total pore volume was formed by the pores with diameter at 6–30 μm.
According to the relationship between Knudsen number and types of diffusion, the pore diameter from the MIP tests was divided into two kinds of diameter in the threshold of 100 times the mean free path (3.530 μm), that is, macro and meso pores. Most of the pores in leather were macro pores with average diameter 16.56 μm which contributed to 95.9% of whole porosity and the meso pore with average diameter 0.60 μm which contributed to 4.1%. Molecular diffusion could occur in macro pores and transition diffusion could occur in meso pores.
As far as the LIFE experiment shows, Xiong’s model agrees much better with the experimental results than the other two. The effective diffusion coefficient computed from Xiong’s model and LIFE experiment is on the same order of 10−7 m2/s, which is much smaller than those obtained by Ataka’s and Blondeau’s models which are on the order of 10−6 m2/s. So, the two kinds of pores were considered to be serially connected.
Although, the results computed from Xiong et al.’s model is a little bigger, but it is convenient and time-saving. It is useful for predicting VOCs diffusion coefficient and can be applied to the design and development of low VOC emission leather or leather imitates with further research.
Footnotes
Declaration of conflicting interests
The author(s) declared no potential conflicts of interest with respect to the research, authorship, and/or publication of this article.
Funding
The author(s) disclosed receipt of the following financial support for the research, authorship, and/or publication of this article: National Natural Science Foundation of China (21476134), Key Scientific Research Group of Shaanxi Province (2013KCT-08) and Scientific Research Group of Shaanxi University of Science and Technology (TD12-04).