
Abstract
Border surveillance is one of the high priority in the security of countries around the world. Typical and traditional border observations involve troops and checkpoints at borders, but these do not provide complete security. One effective solution is the addition of smart fencing to enhance surveillance in a Border Patrol system. More specifically, effective border security can be achieved through the introduction of autonomous surveillance and the utilization of wireless sensor networks. Collectively, these wireless sensor networks will create a virtual fencing system comprising a large number of heterogeneous sensor devices. These devices are embedded with cameras and other sensors that provide a continuous monitor. However, to achieve an efficient wireless sensor network, its own security must be assured. This article focuses on the detection of attacks by unknown trespassers (perpetrators) on border surveillance sensor networks. We use both the Dempster–Shafer theory and the time difference of arrival method to identify and locate an attacked node. Simulation results show that the proposed scheme is both plausible and effective.
Introduction
Wireless Sensor Networks (WSNs) applications have attracted researchers worldwide greatly because of their application in numerous scenarios. 1 Area monitoring is regard as one of their new and interesting application domains. WSNs have the capability to monitor and send information autonomously, even in critical and hostile environments. One such application of WSNs is border surveillance. Here, the goal is to detect and signal the presence of trespassers (perpetrators) within a specific area that has been predefined to the WSNs. However, the open nature of WSNs allows the possibility of malicious interference or compromise. This necessitates implementation of high-level security and robustness, especially in malicious environments. That is, for WSNs to function effectively in such malicious environments, security mechanisms are essential. 2 There are several characteristics of WSNs are required, namely, low-cost, energy-efficient, computational power efficiency, communication capabilities in short range, security and privacy mechanism, distributed sensing and processing capabilities, dynamic network topology, self-organization, multi-hop communication, application oriented, robust operations, and small physical size.
Typically, the sensor nodes communicate with each other via multiple hops over an open wireless channel. This presents a security challenge as, on borders, WSNs are normally deployed in an unattended area that is also hostile. Moreover, the sensor nodes do not usually have any physical protection. Consequently therefore, WSN nodes can be easily captured by trespassers, thereby providing trespassers with full access to nodes and the ability to cause a failure of the entire network.
Designing and testing a new WSN algorithm is extremely challenging and maintenance of security integrity ranks as a major concern. Common security threats include selective forwarding, sinkhole attacks, Sybil attacks, wormholes, and a HELLO flood attack. 3 The time difference of arrival (TDoA) triangulation through three beacon nodes location information, is used to detect the attacker location. TDoA technology has been widely used in positioning and navigation system recently. The position estimation of a source through determining TDoA of its signal among distributed sensors has many applications in civil as well as in the military with the detection of the abnormal behavior of the sensor (in-sider attack) and location information. The system that uses TDoA to find a source location it requires at least three sensors one of them is a master (reference) and the other two are slave (auxiliary) sensors. When the location is detected, a further approach is taken to make the network secure by reprogramming the node or obsolete the node from the network. In this article, we have focused on border protection using secure WSNs. To provide that protection, we need the ability to continuously determine whether any node has been attacked. To this end, we have employed the Dempster–Shafer theory (DST) to combine evidence from multiple neighbor nodes to determine whether a given node has been attacked. DST has the capability of modeling the uncertainty in the situation where the independent evidences are limited. WSNs are the most uncertain application scenario. Subsequently, the TDoA method is utilized to find the location of the given node as it has the simplicity. Overall, the implemented method has low latency and computation.
Related work
The researchers have recently investigated WSN-based border protection. In 2004, 4 researchers at Ohio State University deployed sensors with the ability to detect metallic objects, the major goal was to detect the tanks and the vehicles. In 2011, researchers at the University of Virginia, in collaboration with Carnegie-Mellon University, utilized energy-efficient WSNs to detect objects moving through a passage line. 5 Their sensor nodes had embedded sound, photographic, and magnetic sensors. In 2012, German researchers investigated irregularly shaped areas and deployed WSNs 6 to detect trespassers. They utilized multiple sensors to work in a distributed manner.
Unfortunately, there was not much attention has been given in the literature for protecting a network from enemy manipulation, technically termed an attack. Although some work has been performed on protecting WSNs from attacks, it has not specifically focused on border surveillance scenarios.
Staddon et al. 7 outlined a method to track unsuccessful sensor nodes in a network at a sinkhole. Detection of abnormal behavior relied on the assumption that all sensor node data will be relayed toward the sinkhole via a predefined routing tree. Moreover, the sinkhole must have an overall view of the network topology. With this overall knowledge, the method is capable of identifying failed nodes using a routing update message.
Marti et al. 8 presented a watchdog-like method. The method has a node which listens to the next-hop neighbor nodes’ broadcasting transmission behavior. It is capable of identifying a packet-dropping attack. Numerous watchdogs must work together with cooperative behavior in this method. Hence, a collaborative and reputable system is necessary to determine an attacker. Quality ratings of the collaborator nodes are therefore requisite.
Zhang and Lee 9 proposed a technique that is considered pioneer work on intrusion detection in the area of wireless ad hoc networks. The author has investigated a different architecture for cooperative discovery of statistical abnormalities, a defense against attacks on ad hoc routing.
Znaidi et al. 10 first introduced a hierarchical distributed algorithm for detecting node replication attacks using a Bloom filter mechanism and a cluster head selection. The proposed method needs to employ additional clustering algorithm and the authors presented only a theoretical discussion on the boundaries.
Garofalo et al. 11 proposed intrusion detection system architecture designed to ensure a trade-off between different requirements. It is high detection rate obtained through decision tree classification. Unfortunately, in this method the power consumption by the sensor is high, it is not resilient to node failures as it uses a tree classification, with a long delay to send the data to the base station, data overhead is high, and it is costly.
Ahmed and Mahmood 12 has proposed a clustering-based anomaly detection technique based on the pattern data and attacks characteristics. Their method works fine with the DoS attacks but it fails for the other attacks.
The most common contemporary techniques exploit cryptographic primitives. Cryptographic methods use additional information to provide security, such as authentication information. A polluted packet can be filtered out based on the validity of the code from the intermediate node. Nevertheless, these schemes carry substantial computational overhead. Furthermore, the schemes need to send verification information such as hashes and signatures separately, prior to the packet, to maintain reliable communications. Thus, considering the characteristics of WSNs, it is not possible to achieve efficient functionality with these methods.
Coverage and deployment strategy of WSN
Border surveillance requires monitoring every point on the border, regardless of the environmental constraints within a large geographical area. Effective border coverage using WSNs depends on both the connectivity and quality of service (QoS) provided by the networks. A node must be able to connect to its one-hop neighbor and, using multi-hop communication, it should be able to transfer data without any alteration. To achieve effective connectivity for data exchange and QoS, one condition is the efficient deployment of the sensor nodes. During border deployments of WSNs, a primary condition is to deploy the minimum number of sensors that will guarantee optimal coverage of every location on the border with efficiency. WSNs are normally deployed based on the application scenarios and number of sensor nodes required to provide the specific applications with effective connectivity. Deployment techniques can be categorized as sparse or dense. Sparse deployment uses fewer sensor nodes.
Conversely, dense deployment uses a relatively high number of sensor nodes in the given field of interest. Dense deployments are normally utilized where it is mandatory for every event to be observed and detected in a large area. Considering the importance and characteristics of border surveillance, the dense deployment strategy is used. Deployment of the sensors normally decided based on the application scenario. Most cases its done by scattering. Despite their quick deployments and significant advantages, WSNs face various security problems due to their nature and the possibility of the presence of one or more faulty or malicious nodes in the existing network.
Model of border attack
The information collected from WSNs is crucial in making border surveillance decisions; thus, the most critical requirement for WSN design is to maintain a high level of network security. The networks can be hacked by the enemies to eavesdrop or to modify fetches data. They may also choose to physically destroy sensor nodes. As a result, protection should be applied both against physical attackers and malicious nodes. The major goal of the network attacker is to discontinue the area monitoring and stop event detection in the border region. To these ends, attackers typically use the following methods. They discontinue or delay the data packet, the attacker tries to modify the node to so as not to forward detected events to the base station. In addition, attackers may attempt to jam the channel to delay the packet, thereby gaining sufficient time to cross the border.
In physical attacks, attackers can physically destroy the sensor node and take it out of the network. With a camera sensor, they can destroy the camera so that analysis of the suspicious area cannot be performed at the data center.
Case study and assumptions
In this research, we used the physical parameter temperature for the purpose of simulation. Our WSN system was built with one sink node and a random spatial distribution of stationary sensor nodes. We assumed that the one-hop neighbor distance was significant and the neighbor acted as an observer and observed the transmissions of the mistrusted node. The second simplifying assumption is the observed physical parameters at the nodes reasonably met the condition of independent events. The independent events observed by neighbor nodes became the individual pieces of evidence. The decision-making process algorithm about an attacker utilized the DST to combine the independent pieces of evidence. This is exemplified by the simplified case as shown in Figure 1. Here, the neighbors of node A are X, Y, and Z. They will observe suspected attacked node A for the defined physical parameters of temperature (T) and packet drop rate (PDR).

Observation of the attacker with one hop by the neighbor nodes.
Methods
The DST was used to detect the attacker. In this theory, the uncertainty interval normally represents probability; probability is replaced by the bounds of belief and plausibility. The lower bound of the interval is known as belief and is characterized by supporting evidence. The interval upper bound is plausibility and is characterized by the un-refuted evidence.
13
The theory is a system of reasoning: the total probabilities of mutually exclusive hypotheses (for independent events) of similar classes are tallied and collected in the frame of discernment, also known as the universal discloser. The basic belief assignment (BBA) or, in other words, function of mass is a function m:

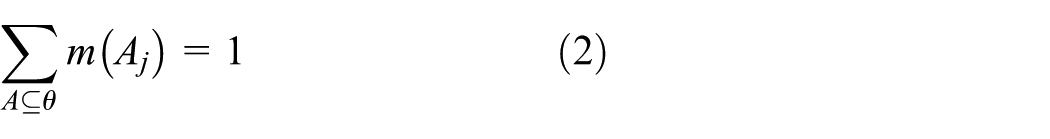
where
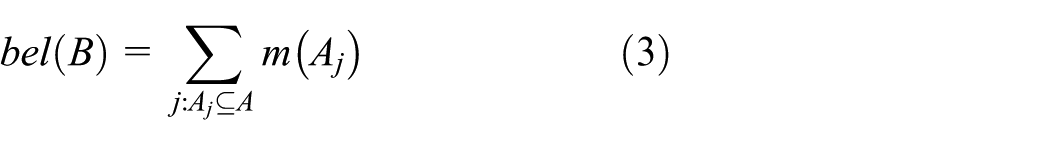
A plausibility function is considered to be the upper bound of the confidence interval. It accounts for all the observations that do not rule out the given proposal. The plausibility function maps every hypothesis, to a significant value between 0 and 1, and formalized and defined as follows 14

The weight of evidence that is non-contradictory to B is considered the plausibility function. The mathematical relationship concerning the belief and plausibility is given in equation (5)

Here,
We assume m1(A) and m2(A) are two basic probability numbers, considered to be two independent elements of evidence, meaning that two self-governing neighbor sensor nodes act as observers of the same frame. The conclusions from observations (the pieces of evidence) can be combined in accordance with the evidence theory of Dempster’s rule of combination (also known as orthogonal sum), as given by equation (6)

where ⊕ denotes Dempster’s combination operator that combines two basic probability assignments or BBA into a third. 15 To normalize the equation, a normalization constant L is introduced, as defined by equation (7). More than two belief functions can be combined pairwise

where

The rule of combination assigns belief based on the degree of conflict between pieces of evidence. It also assigns the remaining unused belief to the environment and not to a common hypothesis. This enables the combination with most belief allocated to the disjoint hypothesis and with no reaction of an unreasonable behavioral phenomenon. Belief is similar to confidence levels or evidence. 16 The disagreement between the two belief functions bel1 and bel2 is represented by Con(bel1, bel2) and is specified by the logarithm of normalization constant, 5 as given in equation (8)

If there is no disagreement between bel1 and bel2, then

The DST was applied to the proposed system by treating an independent event as temperature (T) and packet drop rate (PDR). In our application scenario, the set of local elements that are the frame of discernment or the universal discloser can be observed by neighbor nodes within one-hop distance. The neighbor nodes observe

where

Given T and PDR, the basic probability assignments for nodes


Using equation (9), the observation by


After the decision about the attacker is finalized, a method to find the location of the node is invoked. Complex numerical calculations are involved in location estimation in wireless networking. A complex calculation yields higher accuracy, but it requires a more powerful processor. Our goal is to reduce the complexity to estimate the compromised node’s location with limited processor capability.
We have utilized the TDoA method for simplicity. In this method, normally at least three neighbor nodes send signals to the target node at different times. This is considered the most traditional methodology to find the location of the node. 18 To obtain TDoA measurements, the signal sources must lie on a hyperboloid by keeping a constant range difference with the measuring nodes. Assuming the master beacon node is B1, then the distance from the transmitter to the ith beacon node is

In a two-dimensional (2D) implementation, the target location can be estimated from two TDoA measurements based on the intersections of signals with the hyperbola created. Assuming that B1, B2, and B3 are beacon nodes measuring the target, the intersection point calculated as a result is target point A. The process is shown in Figure 2.

The location of the attacker.
In Figure 2, the three sensor nodes are Bi with the locations (xi, yi), where i = 1, 2, or 3 and A = (x, y) is a point in plane. The difference in the range with the corresponding beacon nodes with respect to the beacon B1, in which the transmitted signal arrives first, is

Here, c is the speed of signal propagation, Ri,1 is the difference in the range between the first beacon B1 and the ith beacon (B1(i > 1)), R1 is the distance between the first beacon node and the transmitter, and di,1 is the estimate of TDoA corresponding to the first beacon B1 and the beacon (B1(i > 1)). A set of nonlinear hyperbolic equations is defined by this relationship. The solution of the set yields the 2D coordinates of the source.
The difficult task is to solve the nonlinear equation (11). Linearization of the set of equations is the common practice for these types of equations. One of several linearization processes is the Taylor series.18,19 In Friedlander 20 and Schau and Robinson, 21 the authors present an alternative to the Taylor series expansion, which is to first transform the set of nonlinear equations into a different set. Rearranging the form of equation (11) into

And subtracting equation (10) at i = 1 from equation (12) results in

Here, Xi;1 and Yi;1 are equal to Xi–X1 and Yi–Y1, respectively. The set of equations in equation (13) are linear in the location of the source A(x; y) and in the range of the first receiver of the source R1 as the unknowns and are more easily handled.
To solve R1, we employ Chan’s method, a non-iterative resolution of the hyperbolic intersection point estimation problem. The method is capable of optimized performance for arbitrarily placed sensors. This solution is applicable in scenario of both distinct and closed sources. The errors in TDoA estimates are considered to be small, and this method works as an approximation to a maximum-likelihood estimator.
Following Chan and Ho’s method 22 for the three beacon node system (B = 3) and generating two TDOAs, the solution of x and y can be found in terms of R1 from equations (13). The solution is presented in the following form

where


Substituting equation (14) into equation (10) with i = 1, a quadratic equation is formulated in terms of R1. Substitution of the positive root back into equation (8) yields the result. Hence, the system can detect the location point of the attacked node that basically A(x; y). The position error can be determined using equation (15)

Results
As a simulation experiment, we performed a case study with sensors deployed randomly in a b × b square field. We used temperature measurement data as a physical parameter. We chose to use a Gaussian distribution for the temperature range, with zero mean and two sigma variations, analogous to the methodology adopted by Sentz and Ferson. 13 In the latter, they utilized one sigma variation for a stricter information set. We assumed adequate data sets to have stricter conditions (with perhaps two sigma variations), which can significantly increase the average accuracy. In our case, we took the average of the results of 20 runs. Our average result is from 95% (with one sigma variation) to 99.99% (with two sigma variations). The temperature varied from 8°C to 14°C in the information set we adopted.
The simulation was designed and simulated in MATLAB. MATLAB R2015a version has been used to do the simulation. In order to set the simulation environment, we have created an area of 500 m by 500 m and we have set 500 randomly distributed nodes on that area. Additionally, we have created 25 nodes as an attacked node out of the existing nodes. DST has been implemented in order to find the attacker and TDoA for the location detection. We employed the DST of combination to do the simulation. We performed the DST simulation with individual pieces of evidence from the one-hop neighbor sensor nodes of the network. We assume that the system will not survive if 50% or more sensors are attacked or malicious node. In any active network, we can detect many attacker nodes if it is attacked. The simulation parameters are shown in Table 1. The simulation results are based on 200 different observations of the nodes.
The simulation parameters.

AODV: ad hoc on-demand distance vector.
In Figure 3, it is clearly seen that observation with three sensor nodes of X, Y, and Z are shown in blue, red, and green colors. The observation reaches almost the same conclusion about the attacker, that is, between 75% and 85% certainty that node A is an attacker.

Observation of the nodes.
Figure 4 shows the simulation results, which portrays the neighbor sensor nodes observations of the suspected sensor node A. The observations by the one-hop neighbor nodes X, Y, and Z are also shown.

Location of the node.
After the identification of attacker utilizing DST, we find the location of the node using TDoA method using equation (14). Figure 4 shows the location of the attacker node in red circle. The beacon nodes on blue star.
From the above results, it is obvious that the system was successfully working to conclude about the attacked node and find its locations. From the simulation result as shown in Figure 4, the exact location of the node is in red circle but we can see that there is slight position error of the exact location of the node.
Conclusion
Each country is trying to keep their border safe and secure to control the unwanted entry from their neighboring countries. Border monitoring systems are a distinctive domain of the smart technologies by the utilization of WSNs. WSNs itself have some constrain in terms of its security. Therefore, in order to implement WSN in the border, it is mandatory to have a secure WSN. In this article, we have investigated potential attacks in WSN systems and presented a solution for securing system against attack to be implemented in the border. In particular, we have developed a methodology to find location information of the attacker. To do this, we exploit multiple pieces of independent evidence and implemented DST to combine the multiple pieces of evidences for the attacker decision and to find the approximate location we have used TDoA methods. DST has the capability of modeling the independent uncertain event and TDoA has the simplicity which lead out system to the low latency and less computation. The simulation result shows that the algorithm works to find the attacked node and its approximate location. In future work, another detection algorithm will be incorporated to make the system more robust, resilient and to get the higher accuracy. Moreover, hardware of the complete system will be implemented and tested.
Footnotes
Acknowledgements
The authors acknowledge King Abdulaziz City for Science and Technology (KACST) in Saudi Arabia for sponsoring and supporting this work.
Handling Editor: Miguel Torres-Ruiz
Declaration of conflicting interests
The author(s) declared no potential conflicts of interest with respect to the research, authorship, and/or publication of this article.
Funding
The author(s) received no financial support for the research, authorship, and/or publication of this article.