
Abstract
Background
The prediction of post-stroke language function is essential for the development of individualized treatment plans based on the personal recovery potential of aphasic stroke patients.
Objective
To establish a framework for integrating information on connectivity disruption of the language network based on routinely collected clinical magnetic resonance (MR) images into Random Forest modeling to predict post-stroke language function.
Methods
Language function was assessed in 76 stroke patients from the Non-Invasive Repeated Therapeutic Stimulation for Aphasia Recovery trial, using the Token Test (TT), Boston Naming Test (BNT), and Semantic Verbal Fluency (sVF) Test as primary outcome measures. Individual infarct masks were superimposed onto a diffusion tensor imaging tractogram reference set to calculate Change in Connectivity scores of language-relevant gray matter regions as estimates of structural connectivity disruption. Multivariable Random Forest models were derived to predict language function.
Results
Random Forest models explained moderate to high amount of variance at baseline and follow-up for the TT (62.7% and 76.2%), BNT (47.0% and 84.3%), and sVF (52.2% and 61.1%). Initial language function and non-verbal cognitive ability were the most important variables to predict language function. Connectivity disruption explained additional variance, resulting in a prediction error increase of up to 12.8% with variable omission. Left middle temporal gyrus (12.8%) and supramarginal gyrus (9.8%) were identified as among the most important network nodes.
Conclusion
Connectivity disruption of the language network adds predictive value beyond lesion volume, initial language function, and non-verbal cognitive ability. Obtaining information on connectivity disruption based on routine clinical MR images constitutes a significant advancement toward practical clinical application.
Keywords
Introduction
Stroke is among the major leading causes of disability world-wide. 1 Approximately 15% to 50% of stroke patients suffer from aphasia, a language impairment affecting language reception and/or expression. 2 Patients suffering from aphasia exhibit reduced quality of life and inter-subject variability in the degree of language recovery after stroke is high. 3 Elucidating factors that help to predict the severity of language impairment may assist clinicians in addressing the needs of the individual patient and allocating treatment resources to expected recovery trajectories to achieve the best possible recovery outcome. 1
A variety of inter-related demographic, clinical, and neuroimaging variables may predict aphasia severity post-stroke. 4 An association between lower age at stroke,5-8 longer time since stroke onset,6,9 lower initial aphasia severity,5,9,10 higher post-stroke non-verbal cognitive ability, 6 sex, 8 and better language function after stroke has been suggested. Larger lesion size was additionally associated with poorer aphasia recovery.5,8,9,11,12 Lesion load in language-relevant fiber tracts, such as the arcuate fasciculus, combines information on lesion size and lesion location and has been negatively associated with different language aspects after stroke, such as speech fluency and naming ability.13-16 Quantifying lesion location beyond large-scale classifiers (eg, lesion load, affected cerebral lobes, and cortical and subcortical lesion location)11,17,18 has been difficult and incorporation of such information into prediction models remained challenging.
The lack of suitable quantitative metrics has limited the development of prediction models respecting the fact that language is a complex cognitive function distributed across multimodal cortical networks.19,20 Two major language networks can be distinguished. The posterior language network, essential for language comprehension, comprises the posterior superior temporal cortex, the posterior parietal cortex as well as their white matter (WM) connections (superior longitudinal fasciculus and arcuate fasciculus) to the posterior inferior frontal cortex. 19 The anterior language network, crucial for semantic processing, connects the anterior inferior frontal cortex with the anterior temporal lobe via WM fibers including the uncinate fasciculus.19,21 Focal or diffuse alterations of WM fibers defining these distributed language networks have distal consequences at terminating gray matter (GM) regions with comparable function to direct GM lesions.13,14,22
The transition of connectome-based data into clinical practice has been limited, as the standard approach to identify connectivity disruptions in the brain (diffusion tensor imaging [DTI]), 23 requires the acquisition of certain magnetic resonance (MR) sequences that are usually not part of clinical imaging protocols in stroke patients. Model-based approaches, such as the Network Modification (NeMo) tool provide an alternative metric for the quantification of structural brain connectivity changes based on routinely collected clinical MR images.24,25
The aim of this post-hoc analysis of the – so far – largest set of patients with post-stroke aphasia from the Non-Invasive Repeated Therapeutic Stimulation for Aphasia Recovery (NORTHSTAR) trial,26,27 is to establish a framework for integrating information on structural connectivity disruption of language-specific GM regions, in addition to demographic and clinical factors, into Random Forest machine-learning models to predict post-stroke language function. We hypothesize a high level of connectivity disruption in the posterior language network, especially a low WM integrity of the superior temporal gyrus (STG), to improve prediction of impaired language comprehension. We further hypothesize a low level of WM integrity of the anterior language network, specifically the middle temporal gyrus (MTG), to improve prediction of impaired semantic processing and lexical access, resulting in lower scores in the BNT and sVF.
Methods
Study Setting
Patients analyzed in this study were part of the NORTHSTAR clinical trial (ClinicalTrials.gov Identifier: NCT02020421), performed between 2014 and 2019. 28 Participants were recruited from 5 participating centers across Canada, the United States, and Germany. The study was approved by the ethics committee of each institution and written informed consent was obtained from each subject according to the Declaration of Helsinki. Participants were randomized to receive 10 days of either repetitive transcranial magnetic stimulation (rTMS), transcranial direct current stimulation (tDCS), or sham stimulation, followed by 45 minutes of individualized speech therapy.26-28
Participant Selection
Patients included in the NORTHSTAR trial had (a) an ischemic stroke in the left middle cerebral artery territory, (b) a score below-limit (defined as −2 standard deviations below age-matched norms) in at least one of the primary outcome measures, and (c) were recruited in the subacute phase (≤45 days post-stroke) or chronic phase (≥6 months post-stroke). 27 From the initial set of patients included in the NORTHSTAR trial (n = 91), a total of 76 patients were included in the baseline (BL) analysis and 67 patients in the follow-up (FU) analysis (Figure 1).
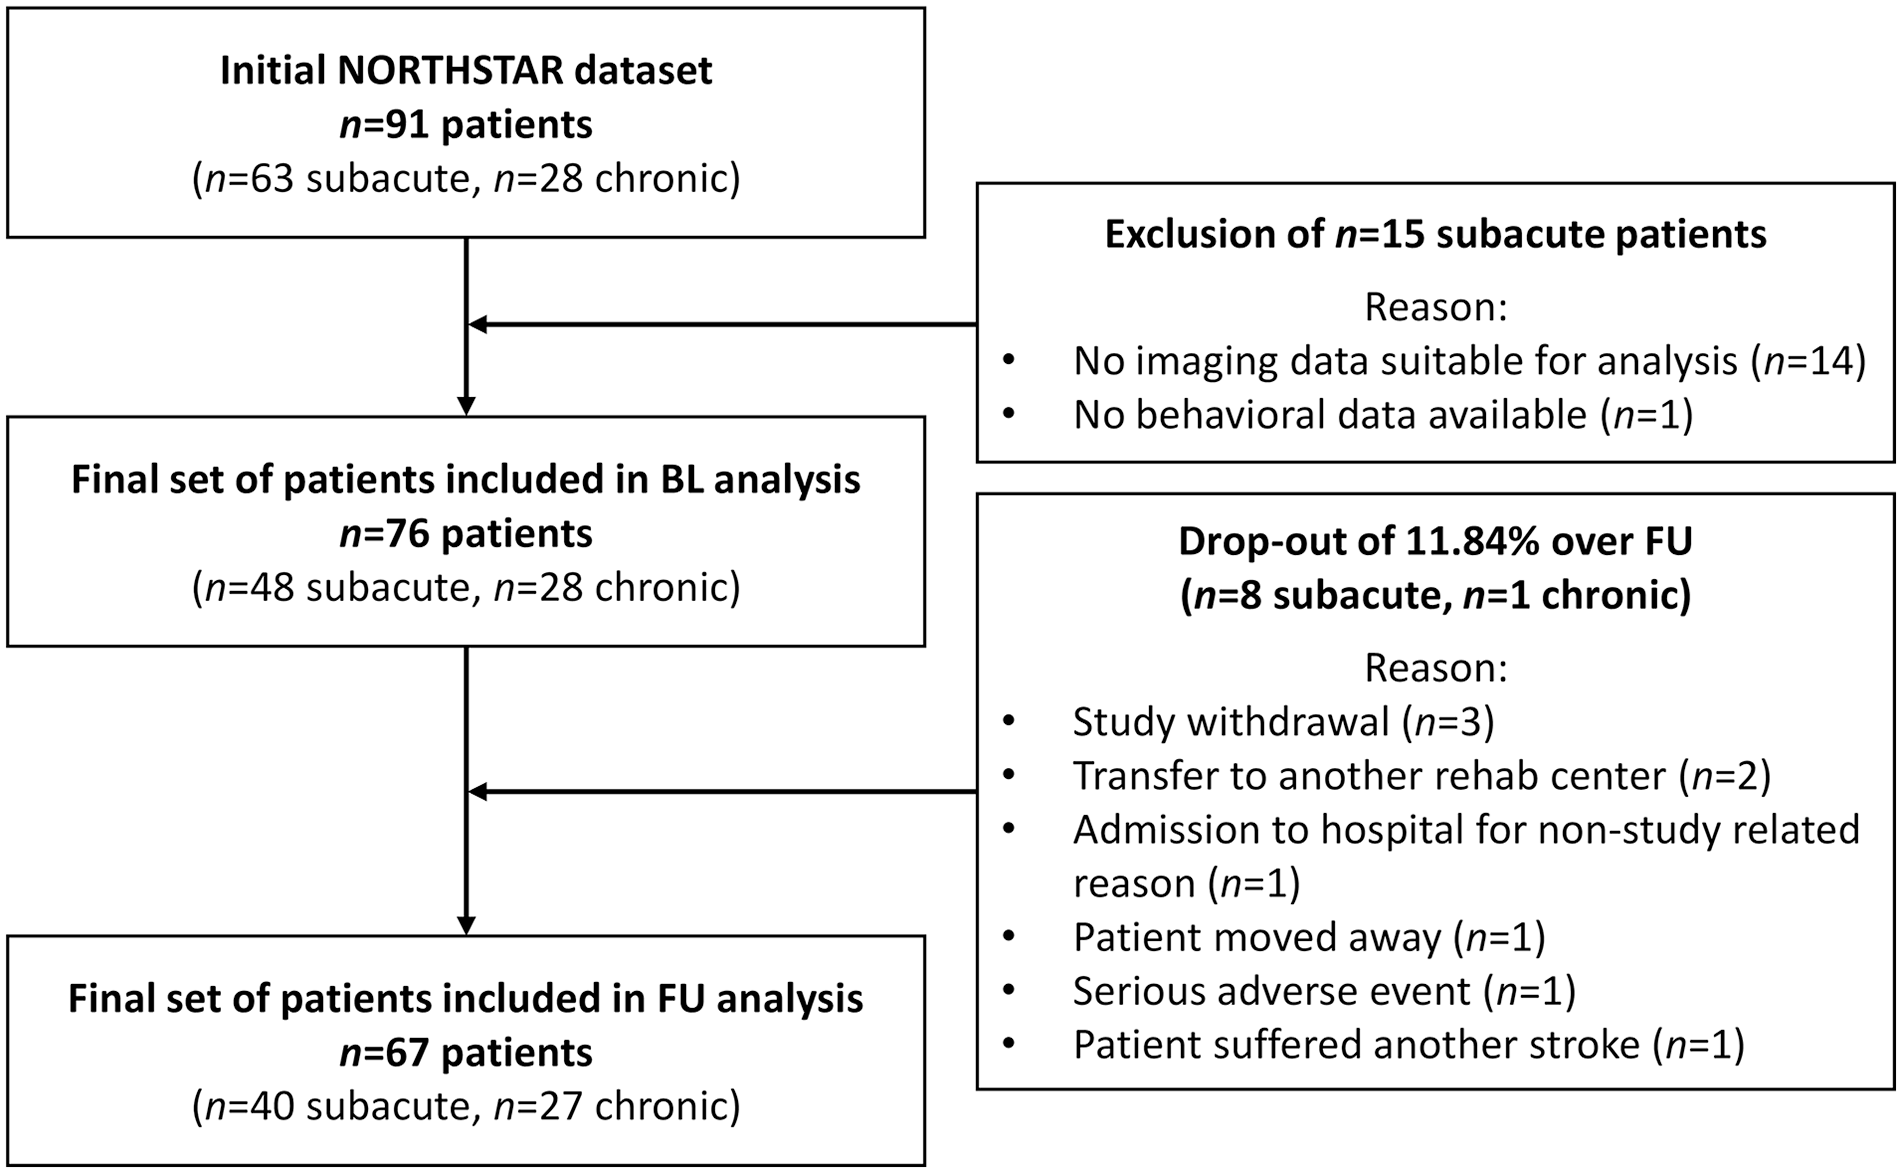
Patient selection for baseline and follow-up analysis.
Behavioral Evaluation
Primary outcome measures comprised 3 language tests, with available norms in English, French, and German language. 26 Receptive language function was assessed with a sentence comprehension test (shortened version of the Token Test, TT), 29 and language expression was measured with a picture naming test (Boston Naming Test, BNT), 30 and a Semantic Verbal Fluency (sVF) Test. 31 Scores of all 3 language tests were transformed into standardized scores (z-values), using the mean and standard deviation derived from our total patient population at BL. All measures were acquired at BL, as well as 1 and 30 days after the last treatment session to allow for longitudinal analyses. A non-verbal subscore of the Montréal Cognitive Assessment (MoCA) was used to measure initial non-verbal cognitive ability, composed of the subtests visuospatial, attention, delayed recall, and orientation. The MoCA subtests naming, language, and abstraction were excluded, as they heavily rely on language function.
Imaging Data
For 74 of the 76 patients, an individual 3T MR scan was acquired in the respective study center, using the well-established ADNI (Alzheimer’s Disease Neuroimaging Initiative) protocol. An anatomical T1-weighted image with 1mm isotropic resolution was obtained, followed by a T2-weighted fluid-attenuated inversion recovery (FLAIR) sequence (2 mm × 2 mm × 2mm). For 2 patients, a computed tomography (CT) scan was acquired instead of the MR scan.
Assessment of Structural Connectivity Disruption
Structural connectivity disruption resulting from a given lesion was assessed using the NeMo tool. 25 The NeMo tool superimposes the patient’s individual infarct mask onto a DTI tractogram reference set derived from 420 healthy control subjects in Montréal Neurological Institute (MNI) common stereotaxic space. 25 Infarct masks were hand-drawn according to hypo- or hyperintensities in the T1 and T2 FLAIR images or CT image, respectively, after which 2 stroke neurologists adjudicated the masks and agreed upon corrections if deemed necessary. Patients’ T1 scans were brain-extracted using the Freesurfer autorecon1-tool. For the 2 CT scans, the Freesurfer SynthStrip tool was used. 32 Brain-extracted scans were normalized to the MNI152 template, using a linear rigid body and affine normalization, followed by a non-linear transformation using the ANTs SyN (Advanced Normalization Tools, Symmetric Image Normalization) algorithm. 33 For MR scans, the lesion was masked out to optimize the normalization results. 33 For CT scans, optimal normalization results were obtained without lesion masking. Linear and non-linear transformation matrices were applied to the infarct masks, which were subsequently entered into the online NeMo toolbox (NeMo v2.1a8). 25 Default options were used within the NeMo tool (probabilistic tractography, streamline weighting by data fit). For a detailed description of the NeMo workflow refer to Kuceyeski et al. 25
Change in Connectivity (ChaCo) scores were calculated as the ratio between the total number of fibers connecting a given GM region to the rest of the brain and the number of those fibers passing through an area of infarct. For GM parcellation, the Automated Anatomical Labeling (AAL) cortical and subcortical region atlas was used. 34 To minimize the probability of type II statistical errors, we pre-selected 13 language-relevant GM regions of the left hemisphere (Table 1). Regions of interest (ROIs) were selected based on their involvement in language production and/or language comprehension as identified through a literature review of functional imaging studies.20,35-37 Respective right-hemispheric homologues of pre-defined ROIs were additionally included. To cover the whole brain, residual left-hemispheric and right-hemispheric regions (excluding the 13 left-hemispheric ROIs and their right-hemispheric homologues) were merged into 2 separate volumes. Labels of interest in the AAL atlas were dilated by 1mm to ensure the NeMo tool captures streamlines ending at the border between WM and GM. A higher ChaCo score corresponds to a higher estimated connectivity disruption experienced by a given GM region. 25
Connectivity Disruption of Language-Relevant Gray Matter Regions After Stroke.
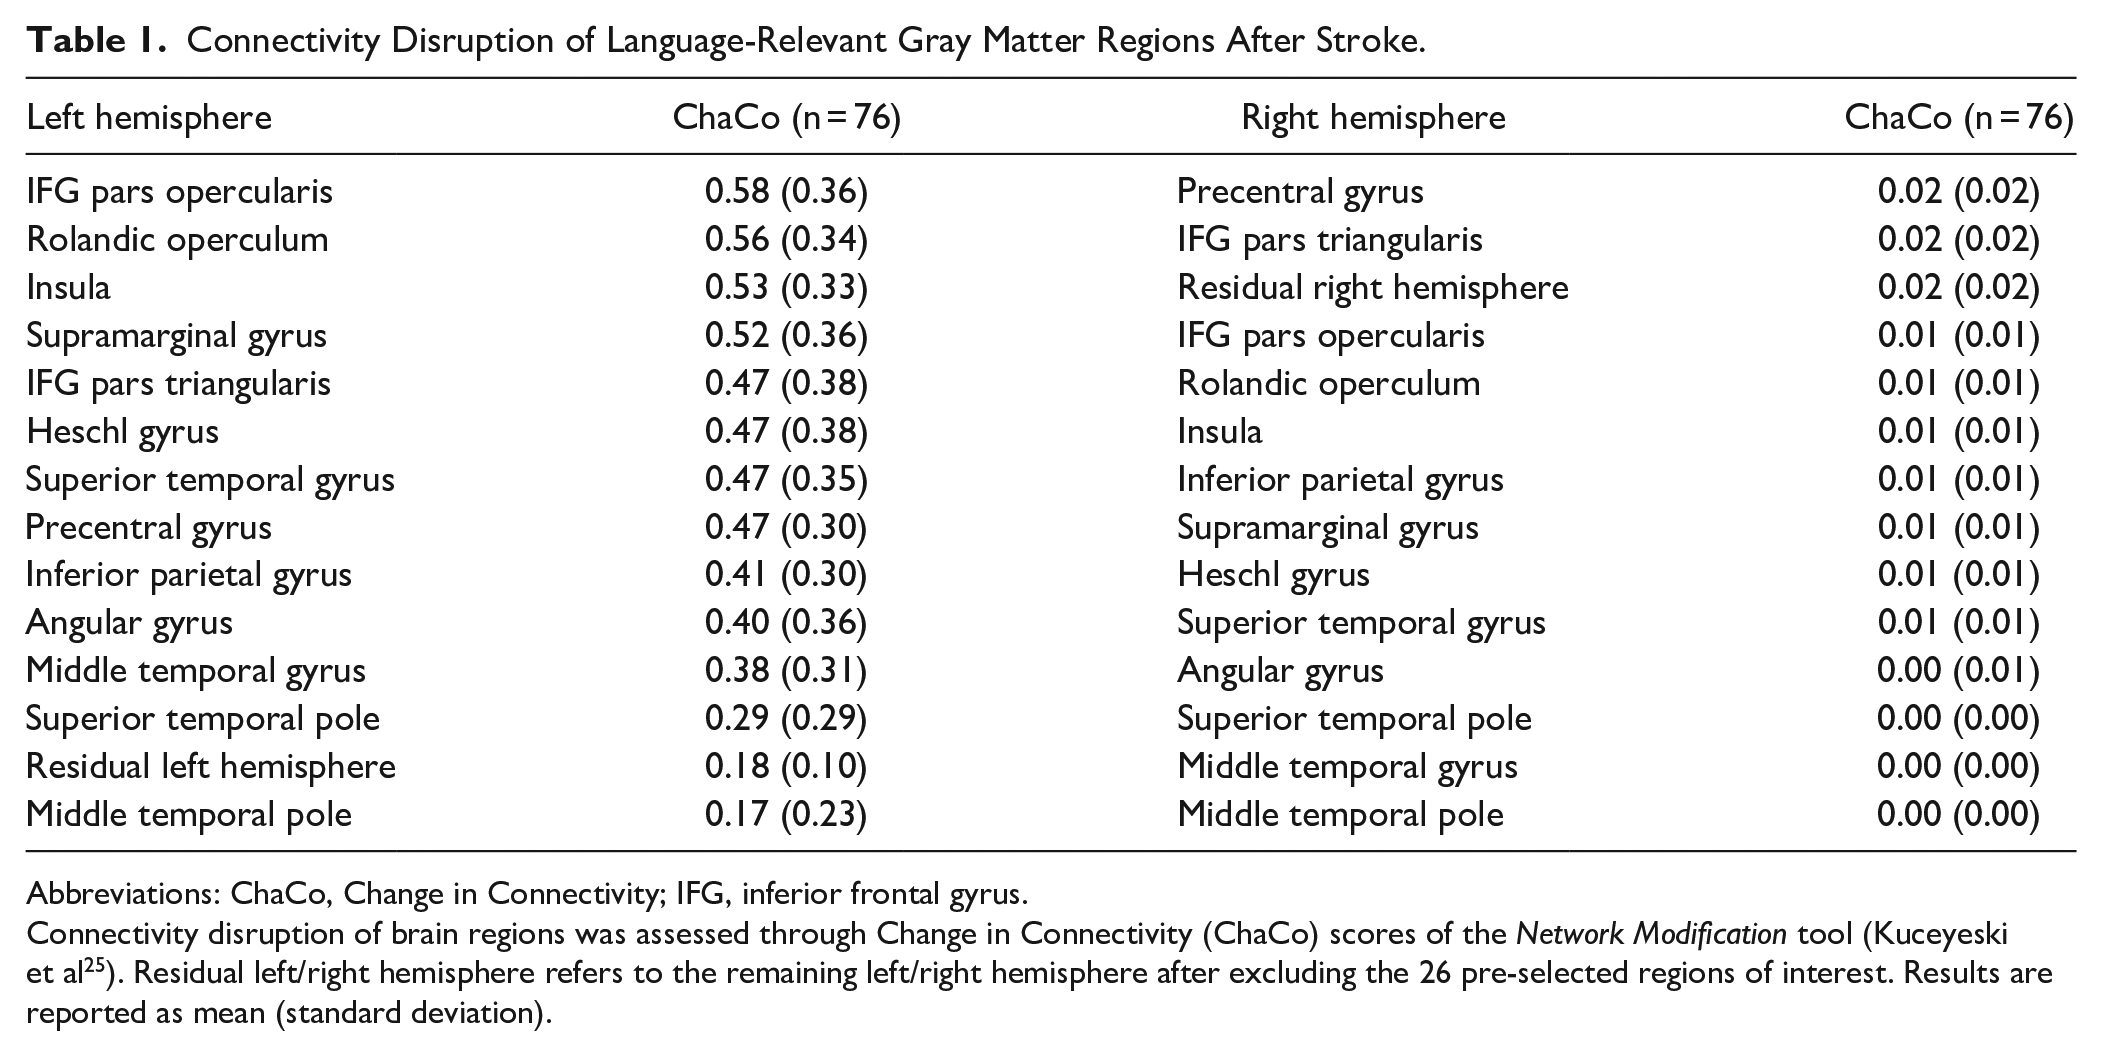
Abbreviations: ChaCo, Change in Connectivity; IFG, inferior frontal gyrus.
Connectivity disruption of brain regions was assessed through Change in Connectivity (ChaCo) scores of the Network Modification tool (Kuceyeski et al 25 ). Residual left/right hemisphere refers to the remaining left/right hemisphere after excluding the 26 pre-selected regions of interest. Results are reported as mean (standard deviation).
Variable Selection for Random Forest Prediction
Several demographic, clinical, and brain-structural variables were selected for inclusion into the multivariable Random Forest prediction models. Besides the connectivity disruption scores of the 13 language-relevant left-hemispheric ROIs, their right-hemispheric homologues, the residual left and right hemisphere, age at aphasia onset, sex, education, number of days between stroke and BL assessment, initial non-verbal cognitive ability, and lesion volume were included. Lesion volume was assessed after normalization to MNI space to account for variance in total brain volume between subjects. For models predicting language function at 30-day FU, the BL language score of the respective test as well as the treatment arm of the patient (rTMS, tDCS, or sham) were included as additional predictor variables.
Random Forest Machine-Learning Algorithm
A supervised machine-learning approach, that is, Random Forest algorithm, was used to predict patients’ language function. The Random Forest algorithm is based on the concept of ensemble learning, that is, the individual predictions of a multitude of decision trees are combined to increase the prediction accuracy compared to a single model. 38 A decision tree consists of a root node, branches, and leaf nodes, where each node represents a predictor variable and each branch represents a binary split option of that variable. 39 At each node, the algorithm searches the best split variable in a subset of 1/3 of the predictor variables. For each decision tree, a bootstrapped training sample is drawn from the data pool, comprising by default 2/3 of the whole patient sample. The other 1/3 of patients is used as the test sample for internal validation. The algorithm predicts the test data, using the decision trees grown on the training data. The predictions of each individual regression tree are then aggregated and the prediction error, defined as the squared difference between the predicted language score implied by the model and the actual observed language score, is calculated. 38 The Random Forest approach has the advantage of showing the independent and complementary predictive effect of each individual input variable, without making assumptions on the relationship between certain predictor variables.38,40 This avoids issues of non-normality and collinearity, which often are fundamental concerns in traditional regression models.1,40
The Random Forest model estimates importance of each predictor variable, defined as percentage increase of the prediction error of a model, when omitting a single predictor variable from the model, while all other predictor variables remain unchanged, that is, it tells how much a model’s performance improves or deteriorates when omitting one of the predictor variables. 41 The prediction error is captured with the mean squared error (MSE). For details of how MSE is assessed, see Breiman, 2001. 38 Variable importance is reported as the percentage increase of the MSE (%IncMSE), with a higher %IncMSE specifying a larger role of the predictor variable in explaining the model variance. 38 Based on previous methodology, a predictor variable was considered relevant, if IncMSE ≥4%. 18
The robustness of the Random Forest models was assessed by performing 500 repetitions of fitting 1.000 decision trees. The model was deemed robust, when the standard deviation of the amount of total variance explained between the 500 Random Forests was <0.05.
Data Availability
The data supporting this study can be made available upon reasonable request to the corresponding author. The Network Modification tool used for model-based connectivity analysis in this study, is an open-access online tool. 25
Results
Demographic and Clinical Data
A total of 76 stroke patients were included in this study, of which 41% were female (n = 31). Patients had a mean age at stroke of 63.1 ± 11.86 years. The median normalized lesion volume of patients was 63.4cm3 (interquartile range: 27.50-101.33 cm3). A lesion overlay map is shown in Figure 2. The mean initial non-verbal MoCA score was 8.9 ± 6.86 out of 23 total points. The mean raw language test scores at BL were 15.3 ± 10.80 for TT, 18.8 ± 18.73 for BNT, and 5.6 ± 6.18 for sVF (Table 2). Patients showed a significant mean absolute change over 30-day FU (n = 67) in all 3 tests (Wilcoxon Signed Ranks test, P < .001).
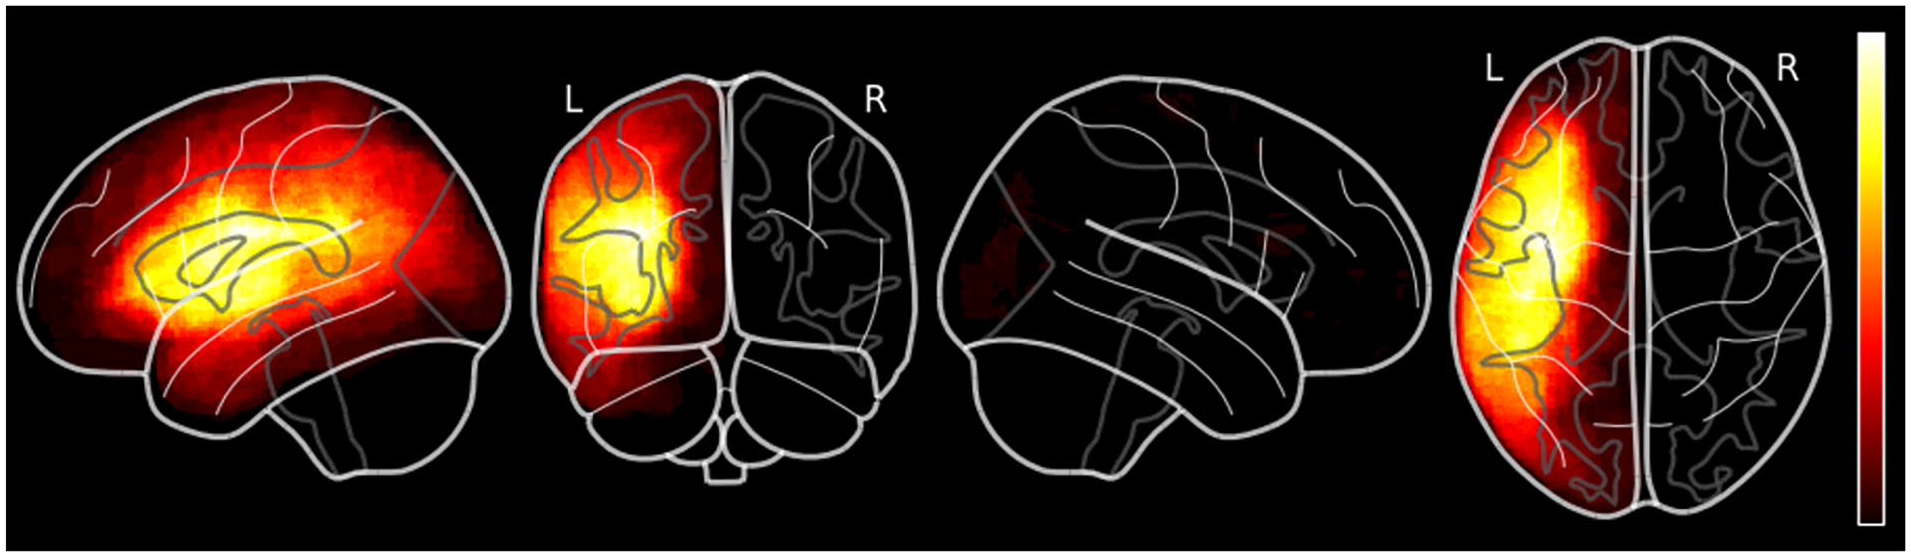
Lesion overlay map.
Sample Characteristics of Patients After Stroke.
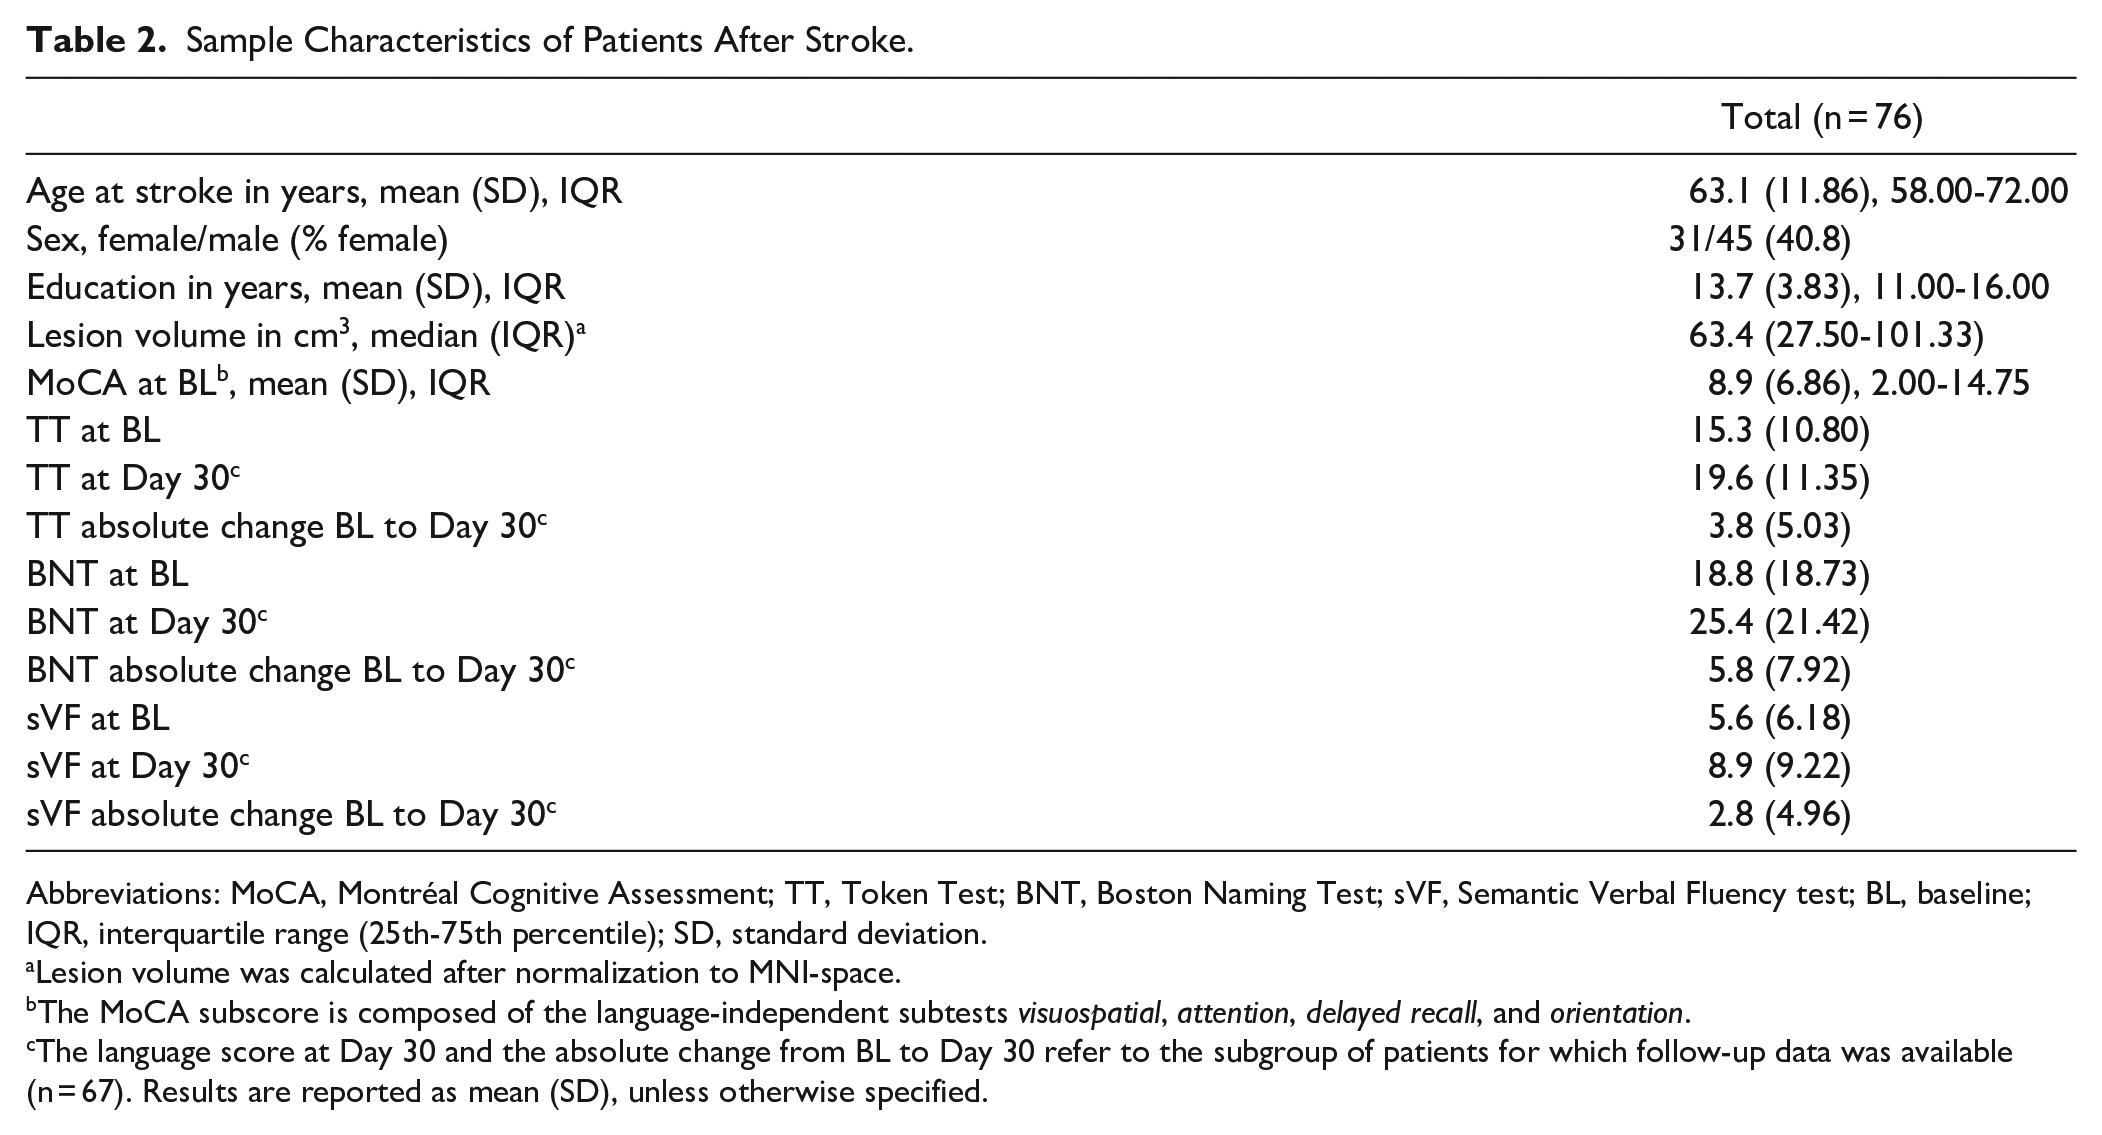
Abbreviations: MoCA, Montréal Cognitive Assessment; TT, Token Test; BNT, Boston Naming Test; sVF, Semantic Verbal Fluency test; BL, baseline; IQR, interquartile range (25th-75th percentile); SD, standard deviation.
Lesion volume was calculated after normalization to MNI-space.
The MoCA subscore is composed of the language-independent subtests visuospatial, attention, delayed recall, and orientation.
The language score at Day 30 and the absolute change from BL to Day 30 refer to the subgroup of patients for which follow-up data was available (n = 67). Results are reported as mean (SD), unless otherwise specified.
Connectivity Disruption
The average ChaCo score, measuring the connectivity disruption of the pre-defined 13 left-hemispheric ROIs over all 76 patients was 0.4 ± 0.21 and significantly higher than the average ChaCo score of the residual left hemisphere (0.2 ± 0.10, Wilcoxon Signed Ranks test, P < .001), indicating a higher degree of connectivity disruption of the pre-selected language-relevant regions. Regions with the highest ChaCo scores were the left-hemispheric inferior frontal gyrus pars opercularis, rolandic operculum, insula, and supramarginal gyrus. ChaCo scores of right-hemispheric ROI homologues were all ≤0.02, indicating mostly intact transcallosal connectivity (Table 1).
Random Forest Prediction of Language Function
A total of 34 predictor variables were included in the Random Forest prediction models at BL (age at stroke, sex, education, lesion volume, days since stroke, initial non-verbal MoCA subscore, 13 left-hemispheric ROIs and right-hemispheric homologues, and residual left and right hemisphere) and 36 at FU (treatment arm and BL language score in addition). Our BL prediction models explained 63% of variance for TT, 47% for BNT, and 52% for sVF. Our FU models explained 76% of variance for TT, 84% for BNT, and 61% for sVF. Initial non-verbal cognitive function, as measured by the non-verbal MoCA subscore, consistently emerged as the most predictive factor in all 3 BL models and second-highest predictive factor in the 3 FU models. Higher initial non-verbal cognitive function was associated with better post-stroke language function. A higher initial language test score was the most critical predictor variable in explaining better FU-outcomes for TT, BNT, and sVF. Smaller lesion volume showed a predictive effect for better language function in the BNT and TT models at both BL and FU, while time post-stroke showed a predictive effect in TT and sVF at BL, and BNT at FU. Age at stroke, sex, education, and treatment arm did not exhibit a relevant predictive effect in any model (<4% IncMSE). Connectivity disruption of language-relevant ROIs decreased the prediction error by up to 12.5% at BL and 12.8% at FU (Figure 3).
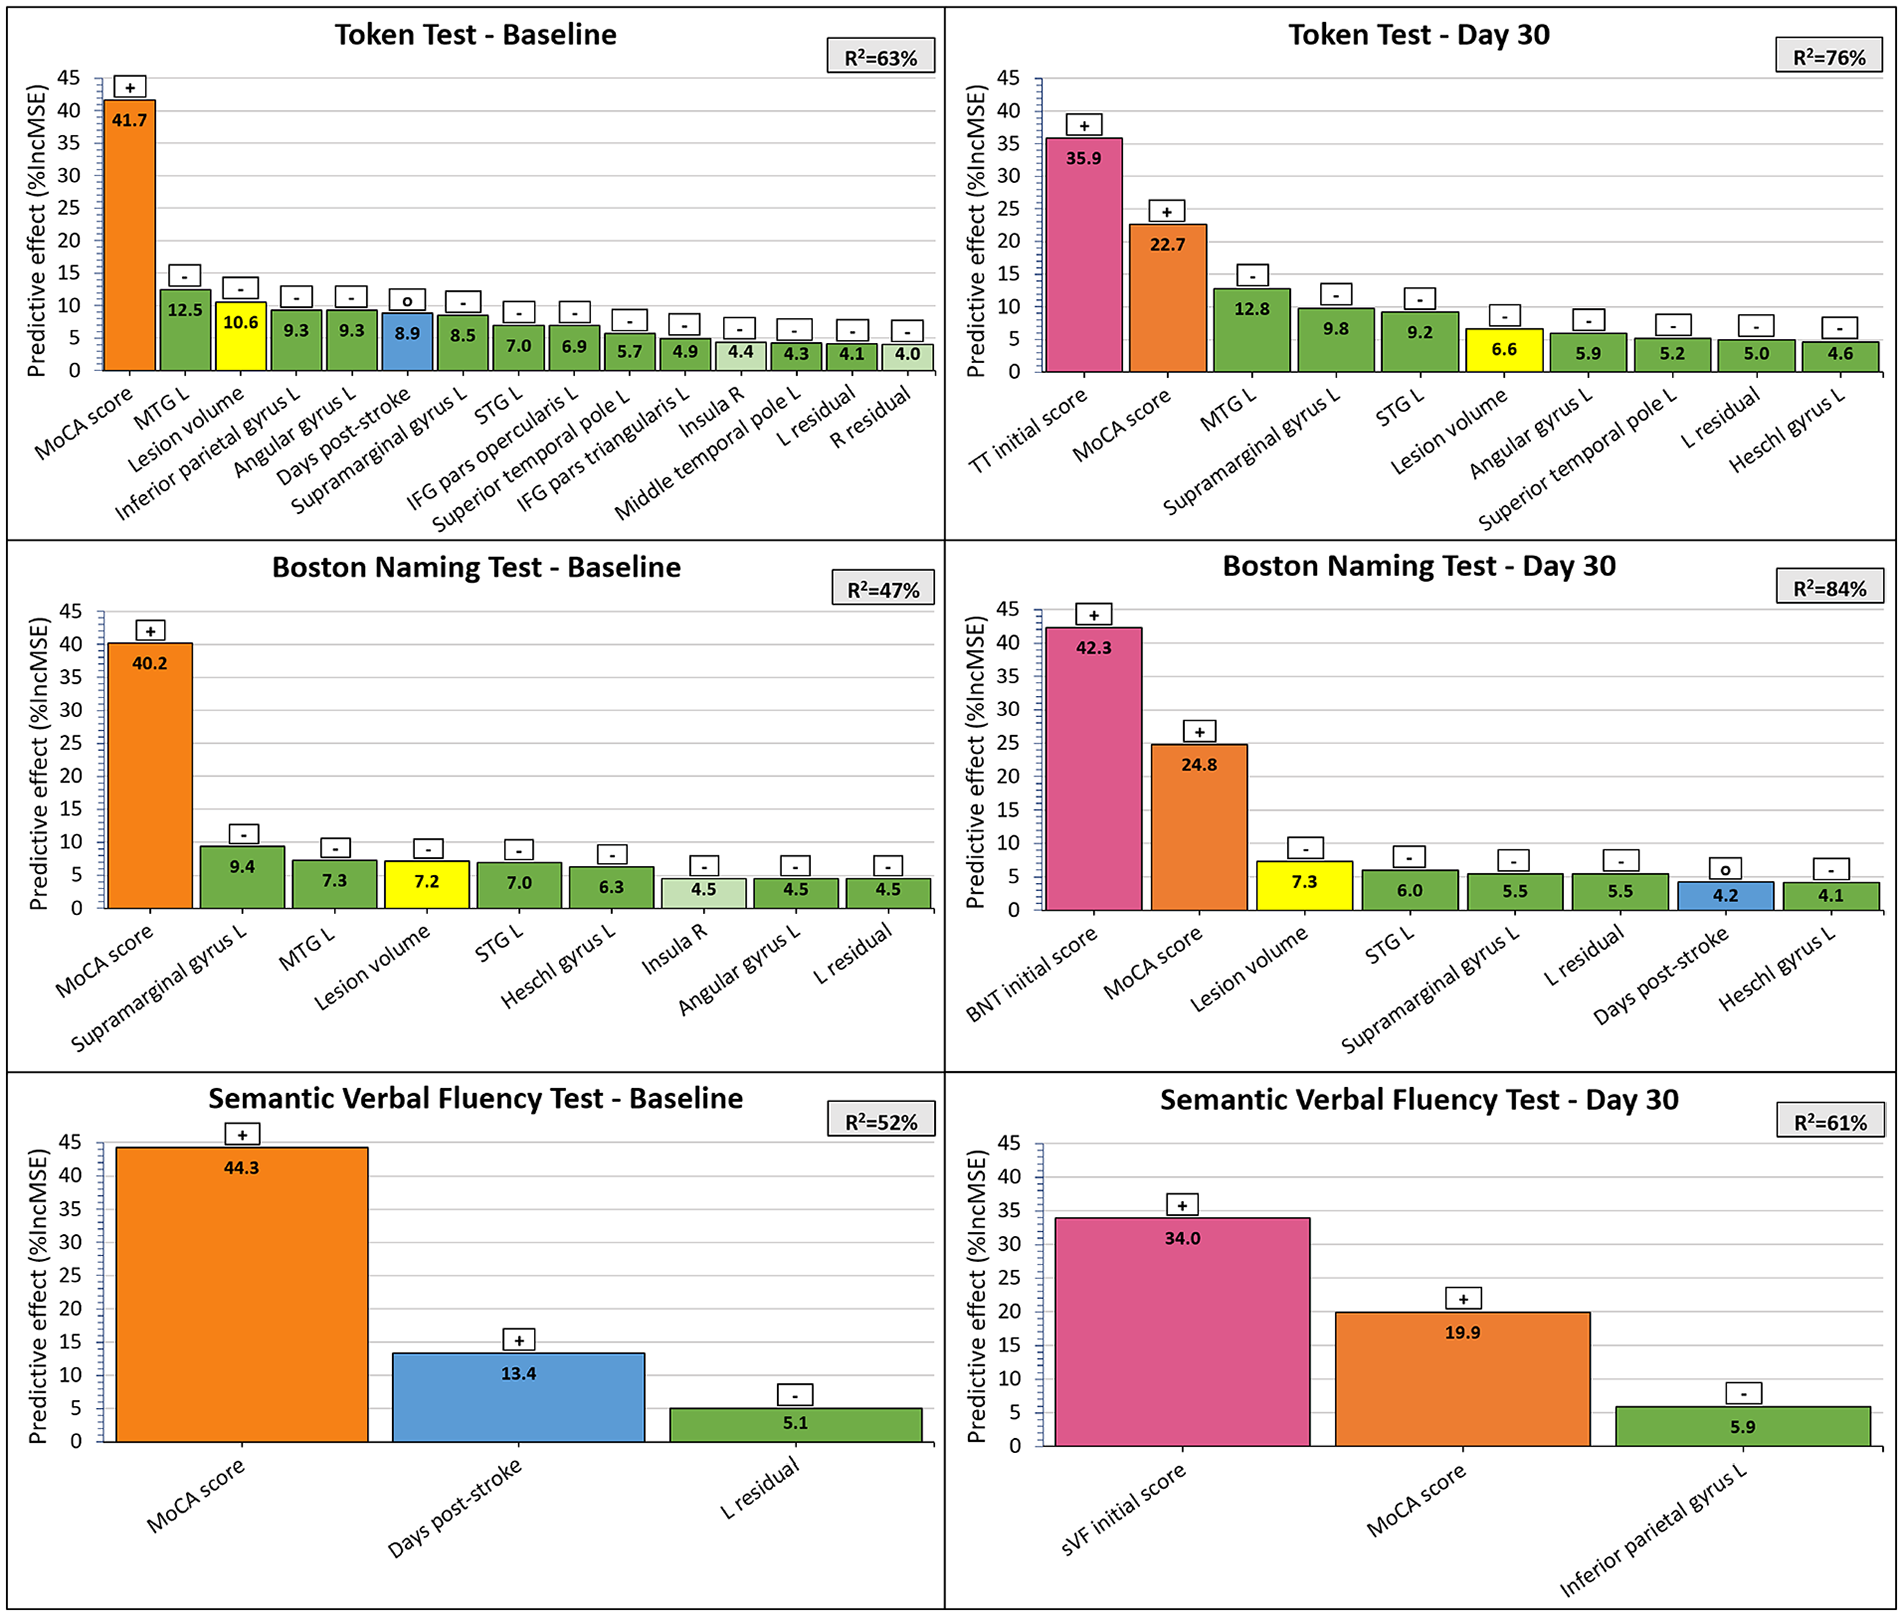
The predictive effect of demographic, clinical, and brain-structural factors for language function after stroke.
Random Forest models identified connectivity disruption scores of the left MTG, STG, and supramarginal gyrus as the strongest brain-structural predictors for language production (BNT). Connectivity disruption of the same 3 regions, along with the left inferior parietal gyrus and angular gyrus, revealed the strongest brain-structural predictive effect for language comprehension (TT, Figure 4). Generally, smaller connectivity disruption scores of the included ROIs predicted better language function at both BL and FU.
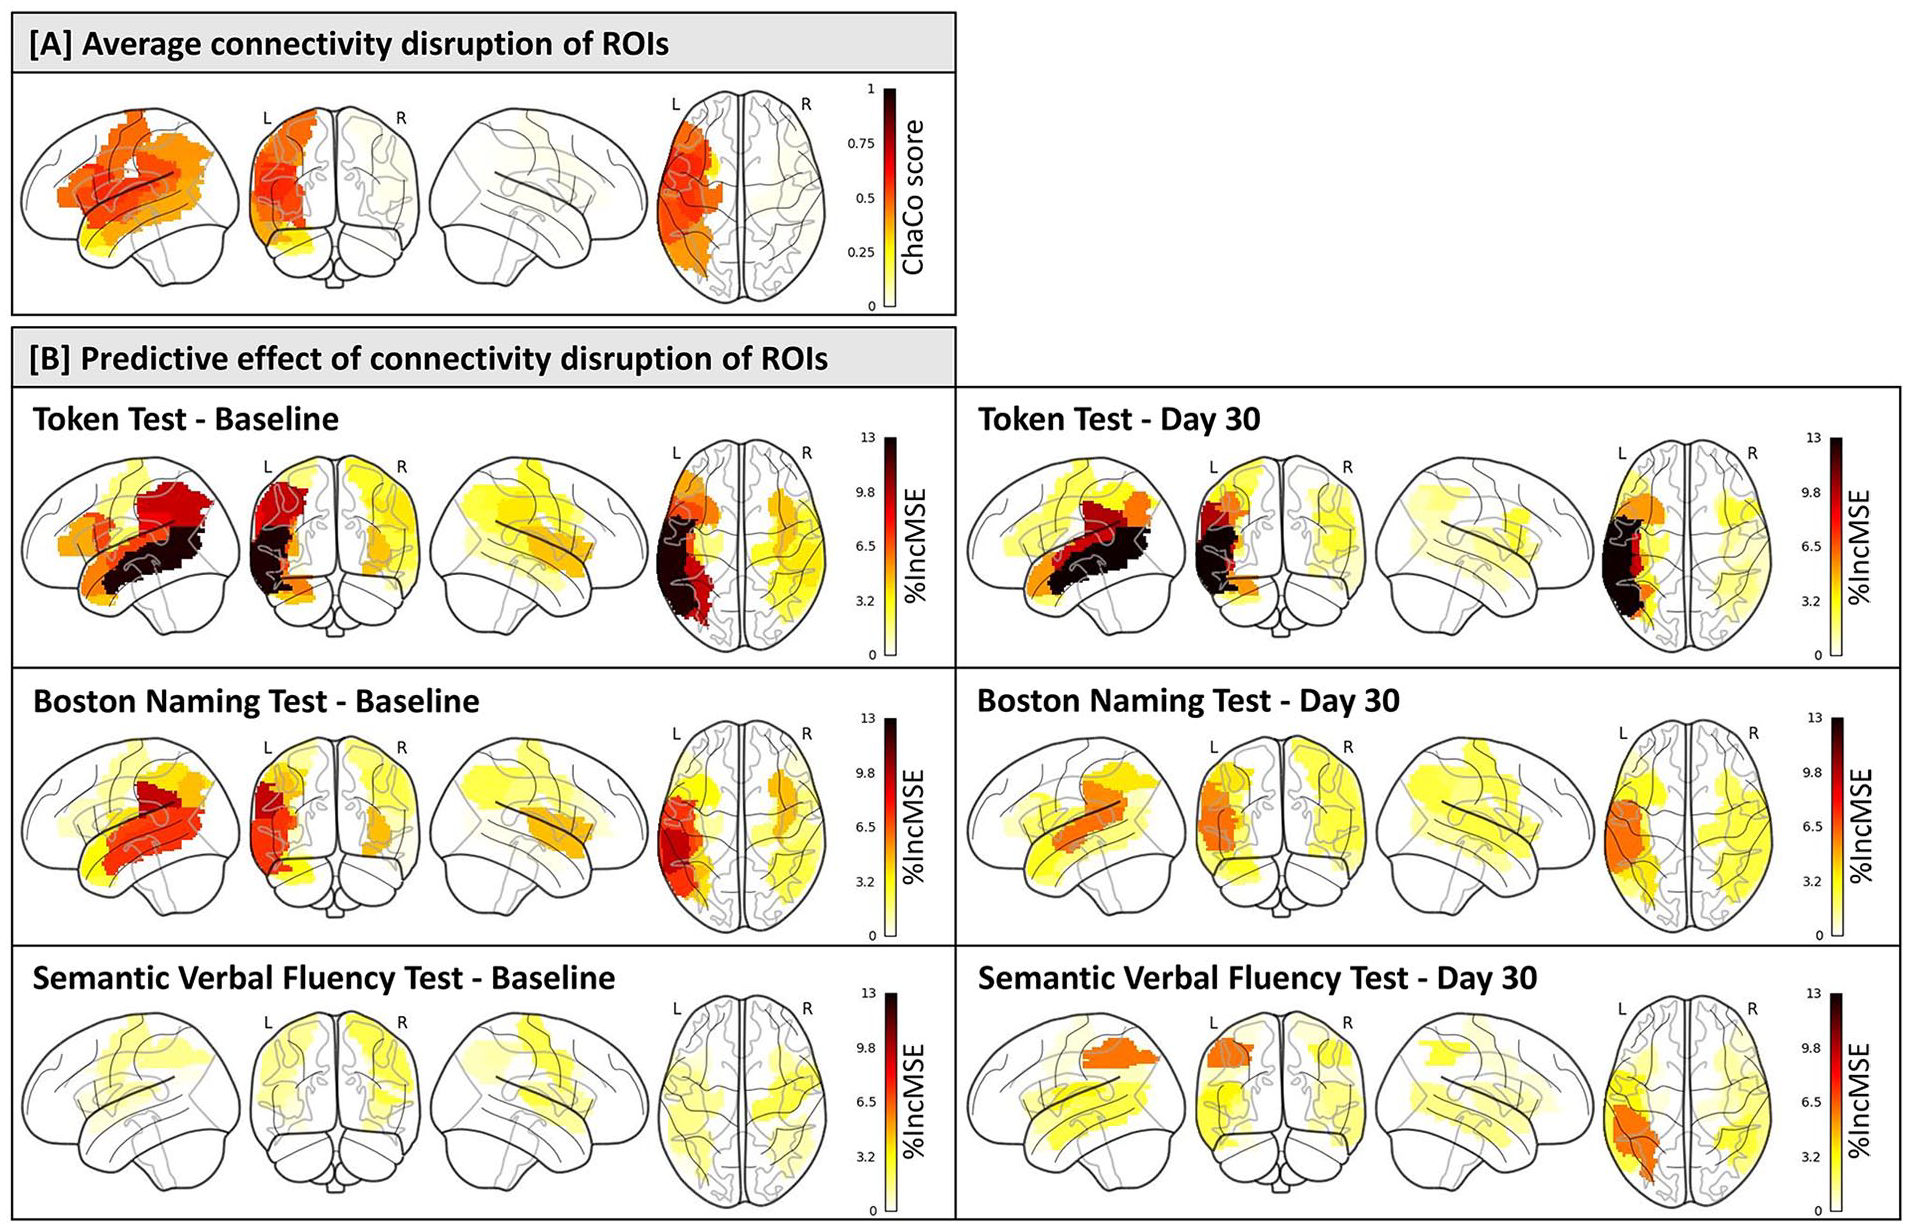
The predictive effect of connectivity disruption of language-relevant gray matter regions for language function after stroke. (A) Glassbrain visualization depicting the average connectivity disruption scores of 13 left-hemispheric ROIs and their right-hemispheric homologues after stroke (n = 76). A score of 1 on the color scale indicates complete disconnection of the ROI from the rest of the brain, while a score of 0 indicates fully intact connectivity of the ROI. Connectivity disruption was assessed via Change in Connectivity scores of the Network Modification tool (Kuceyeski et al 25 ). (B) Glassbrain visualization illustrating the predictive effect of connectivity disruption of ROIs for language function after stroke (n = 76 at baseline, n = 67 at follow-up). A higher score on the color scale represents a greater %IncMSE when omitting an individual predictor variable from the model, indicating higher variable importance.
The right insula was the only right-hemispheric ROI, for which connectivity disruption led to a slight improvement of the BL prediction models for language comprehension (TT) and language expression (BNT).
All Random Forest models were deemed robust. FU Random Forest models demonstrated a strong effect for all 3 language tests (R2: 61%-84%), whereas BL models demonstrated a moderate effect (R2: 47%-63%).
Discussion
We developed multivariable prediction models to explore how information on structural connectivity disruption could improve the prediction of language function after stroke beyond known demographic and clinical variables.
Small Predictive Effect of Demographic Variables for Aphasia Severity
Age at stroke, sex, and education did not contribute to the prediction of language function post-stroke in our models. Previous findings on the predictive effect of demographic variables for language function are controversial, with some studies reporting an association,5-8,15 and others reporting no such effect.8,17,42,43 Those inconsistencies might be driven by strong interrelations between co-existing predictor variables, differing study designs, as well as studies being underpowered due to small sample sizes. 6
Time since stroke onset strongly predicted sVF at BL, with more days passed since stroke predicting a higher sVF score. This aligns with previous studies that report a predictive effect of longer time post-stroke for lower aphasia severity.6,9 The longer the time between stroke and language assessment, the more treatment and language therapy the patient likely received, and the more coping skills the patient possibly developed. 6 Language gain might further be positively influenced by processes of neural reorganization, such as sprouting of axons, remodeling of synapses, and compensatory reorganization of cognitive processes evolving over time. 44 Time since stroke also predicted TT at BL and BNT at FU, however, no clear direction of correlation could be identified. The large time frame after stroke in our patient cohort, ranging from only 2 days to 25 years, may depict a non-linear recovery profile, with some phases after stroke being more beneficial for functional recovery than others.
Initial Language and Cognitive Function as Strong Predictors for Aphasia Severity
Our models consistently identified a higher initial language score as the most predictive factor for better longitudinal language function. Previous studies have demonstrated that higher initial language scores in naming, repetition, and comprehension predict better language function at 90 days and smaller language score change, accounting for 33% and 41% of variance, respectively. 42 In a subsequent study, the authors report that initial scores of a global measure of language function explain 81% of variance of actual language score change over 90 days. 10 This strong correlation might be attributed to varying amounts of therapy administered in that study. Our findings are further supported by another study, which reported that low initial scores in naming, repetition, and comprehension predict severe aphasia scores post-stroke. 5 The inclusion of the initial language score as an additional predictor variable in our FU models likely contributed to the higher explained variance in the FU models compared to the BL models.
Our models further reveal a predictive effect of higher initial non-verbal cognitive ability for better language function post-stroke. Linguistic performance requires the recruitment of non-linguistic cognitive abilities, such as memory and executive function. Assessing language-independent cognitive ability is challenging, given that the neural networks of non-verbal cognition and language are interrelated. 6 The use of standard cognitive tests in aphasic patients is controversial, as they require a certain level of language comprehension for test instructions and language production for task execution. To address this challenge, we measured non-verbal cognitive function with a MoCA subscore, excluding all subtests directly relying on language (ie, naming, language, and abstraction).
No Predictive Effect of rTMS or tDCS for Aphasia Severity
The NORTHSTAR trial was an intervention trial aiming at assessing the effects of rTMS and tDCS compared to sham stimulation. Zumbansen et al 26 reported a significantly greater improvement in picture naming (BNT) in the rTMS group compared to the tDCS and sham group. Additionally, the study found a significantly greater improvement in language comprehension (TT) in the tDCS group compared to the rTMS group, 30 days post-intervention, in subacute stroke patients with intact Broca’s area. 26 This add-on effect was only present in the subacute phase and could not be found in the chronic patient group. 27 In our models, the type of intervention had no effect on predicting either language production or language comprehension at 30-day FU. We opted to use the total patient cohort, comprising subacute and chronic patients, and accounted for the phase by including time after stroke as a potential predictor variable, as well as treatment arm. This decision was made because our sample size was not large enough to run the Random Forest analyses on the 2 subgroups.
Connectivity Disruption of the Language Network Predicts Aphasia Severity Beyond Lesion Size
Our models indicate that lesion volume predicts language comprehension (TT) and language expression (BNT) post-stroke. It is widely recognized that larger lesion size is associated with poorer language function and aphasia recovery.4-6,8,11,12 Lesion location may be a more specific parameter for predicting language function, as a small lesion in a key language region is more likely to impact language function than a large lesion in an area of the brain less important for language.11,13,14
In addition to the predictive effect of lesion volume, we demonstrated that connectivity disruption of 6 left-hemispheric and 1 right-hemispheric language-relevant GM region had a predictive effect on language expression (BNT and sVF). Connectivity disruption of 10 left-hemispheric and 1 right-hemispheric ROI had a predictive effect on language comprehension (TT) post-stroke (Figure 3). Interestingly, in some models, lesion volume demonstrated a smaller predictive effect on language function compared to connectivity disruption of specific critical GM regions, namely the left MTG, STG, and supramarginal gyrus. This was particularly notable in predicting the recovery of language comprehension (TT) at FU. Not only did connectivity disruption scores of those 3 regions exhibit a more important effect than lesion volume, but they consistently emerged as among the strongest predictors for both language comprehension (TT), as well as language production (BNT). The predictive role of STG integrity can be attributed to its involvement in early spectro-temporal analyses and its connection with the phonological network. 20 Our findings align with a previous study that reported lesion load in the posterior STG of the left hemisphere as predictive of poorer naming performance post-stroke. 15 The predictive effect of connectivity disruption of the left MTG may be explained by its involvement in phoneme processing and lexical-syntactic analyses.20,45,46 The impact of connectivity disruption of the left supramarginal gyrus in our model may be caused by its role in phonological processing and speech repetition.46,47 Moreover, complex semantic processing of sentences and context occurs in the conceptual network, including the inferior parietal lobe, 37 which may explain the predictive effect of connectivity disruption of the left inferior parietal gyrus, as well as the angular gyrus, for language comprehension (TT) in our models.
Connectivity disruption of the left inferior parietal gyrus and the residual left hemisphere were the only brain-structural factors showing a small predictive effect for the sVF outcome. The sVF has previously been shown to involve executive control processes, such as monitoring working memory representations, inhibition ability to avoid repetition, and processing speed. 48 Our sVF models did not demonstrate any major brain-structural predictors, which may be attributed to the hybrid test character and the recruitment of brain regions beyond our pre-selected language-specific ROIs.
Our models revealed the predictive role of preserved connectivity of the right-hemispheric insula for language function post-stroke. In contrast to left-hemispheric ROIs, which exhibited medium to high connectivity disruption scores (Table 2), right-hemispheric ROIs showed low connectivity disruption scores, indicating largely preserved connections of ROI homologues. Language comprehension (TT) and language expression (BNT) were sensitive to small disruptions in connectivity of the right-hemispheric insula in our BL models. A connectivity disruption of the right insula as little as 1% was associated with a decrease in language scores. The insula is involved in coordinating higher-order aspects of speech and language production, as well as articulatory control. 49 Right-hemispheric homologues of the language network serve a compensatory role when the left-hemispheric language network is disrupted, as the brain shifts the function of regions with parenchymal damage and critical hypoperfusion to perilesional, distal ipsilesional and right-hemispheric homologue regions.50-52 Progressive recovery of left-hemispheric regions leads to a reduction in the compensatory role of the right hemisphere, which might explain why the right hemisphere does not show any effect in our FU models.
Differences in initial connectivity profiles of right-hemispheric language homologues have been suggested to predict aphasia outcome post-stroke. 53 Lower fractional anisotropy values of certain right-hemispheric homologue regions have been associated with significantly lower speech fluency after stroke. 53 Diffusional changes in the WM of the right hemisphere might be caused by mechanisms of Wallerian degeneration elicited by the distant left-hemispheric lesion.53,54 A recent study further demonstrated a relationship between structural connectivity of right-hemispheric fiber tracts (assessed via quantitative anisotropy) and language production as well as language comprehension. 55 Our results support the role of intact structural connectivity of right-hemispheric homologues of language-specific regions for language function post-stroke.
Model-Based Versus Tractography-Based Connectivity Analysis
The applied model-based approach offers 2 clinical advantages over the gold-standard individual tractogram-based approach (DTI) for quantification of connectivity disruption. First, the approach exclusively relies on structural T1/FLAIR images collected as part of the clinical imaging routine. Second, applying model-based analyses is less complex and labor-intensive than individual tractography, with minimal user interaction, and a high degree of automation. Additionally, the NeMo tool provides a quantitative metric for connectivity disruption rather than the probability of a track being disconnected. 25
Previously, the NeMo tool has been used to predict various clinical performance measures from structural connectivity disruption in subacute stroke patients. 24 This previous study reported connectivity disruption scores of the left heschl gyrus and rolandic operculum to predict language function post-stroke. 24 Our study, including both subacute and chronic aphasic stroke patients, builds upon these findings by modeling specific language functions rather than the overall aphasia score. Predicting different aspects of language separately, instead of creating a composite score, was clinically more informative, as the recovery of language comprehension versus language expression makes an important difference in the lives of people suffering from aphasia.
Limitations
Despite our dataset being the largest dataset of stroke patients with aphasia from a prospective randomized controlled trial, for applying a machine-learning approach, the sample size was relatively small. To minimize the risk of overfitting, we decided not to conduct a separate analysis of subacute versus chronic patients. Instead, we included the number of days between stroke and BL assessment as potential predictor variable. Furthermore, the AAL atlas lacks finer segmentation of certain brain regions, particularly in the temporal lobe. While our Random Forest models might have benefited from a brain atlas with a finer parcellation, selecting smaller regions could increase the risk of overfitting the model given the limited sample size. Moreover, measuring non-verbal cognitive function poses challenges. We used a MoCA subscore, excluding subtests directly assessing language function, however, it must be acknowledged that even those subtests (eg, delayed recall and orientation) rely to some extent on language for understanding of test instructions and task execution. A completely independent, unbiased test assessing language-independent cognitive function may not exist, given the strong interrelation between language and cognition. Additionally, it needs to be considered that model outcomes may be influenced by technical factors such as the normalization procedure, and the accuracy of lesion mask drawing.
Conclusions and Future Directions
Structural connectivity disruption of key left-hemispheric language-relevant GM regions demonstrated a predictive effect for post-stroke language expression and comprehension beyond lesion volume, time post-stroke, non-verbal cognitive function, and initial language score. To identify, which other factors account for the unexplained variance in our models, the potential impact of reperfusion therapy on functional outcomes should be considered. 56 Cardiovascular risk factors, including hypertension, dyslipidemia, diabetes mellitus, and atrial fibrillation, might also hold additional potential as predictive factors for language recovery. Improvement of our models could involve incorporating approaches that leverage multiple imaging modalities to assess lesion location information. This might include combining structural methods (eg, DTI) with functional measures (eg, fMRI and PET) of connectivity disruption. Alternatively, indirect assessments of infarct-driven network dysfunction through lesion-behavior mapping, 57 or structural and functional disconnection maps could be explored. 58
We demonstrated that combining model-based structural connectivity analyses with Random Forest prediction modeling offers a promising alternative strategy to traditional regression modeling for clinically prognosticating patients’ recovery trajectories. The resulting models can be easily applied to newly acquired patient data, enabling the prediction of expected aphasia severity levels for individual patients post-stroke. This has the potential to guide patient-centered treatment decisions. To this end, our work serves as a roadmap to efficiently optimize these prediction models in larger cohorts from existing databases, as long as brain images (MRI or CT) for infarct extraction are available.
Footnotes
Appendix
Acknowledgements
We give our special thanks to Dr. Houssem-Eddine Gueziri, a research associate at McGill University, for his assistance in setting up the Python code for our analyses, as well as Mohammadreza Eskandari, a PhD student in biomedical engineering at McGill University, for his guidance related to coding with MATLAB. Our gratitude also goes to Dr. Samy Suissa, director of the Centre for Clinical Epidemiology, Lady Davis Institute, Montréal, for his statistical consultations, as well as to Dr. Jeffrey Minuk, chief of the Department of Neuroscience, Jewish General Hospital, Montréal, for his consult in reviewing the hand drawn infarct masks. Furthermore, we acknowledge the Healthy Brains, Healthy Lives initiative at McGill University, which financially supported the first author of this manuscript F.E.H. with a PhD graduate fellowship.
Author Contributions
Franziska E. Hildesheim: Data curation; Formal analysis; Investigation; Methodology; Validation; Visualization; Writing—original draft; Writing—review & editing. Anja Ophey: Data curation; Formal analysis; Investigation; Writing—review & editing. Anna Zumbansen: Conceptualization; Data curation; Formal analysis; Investigation; Methodology; Writing—review & editing. Thomas Funck: Data curation; Formal analysis; Investigation; Methodology; Visualization; Writing—review & editing. Tibor Schuster: Data curation; Formal analysis; Investigation; Methodology; Visualization; Writing—review & editing. Keith Jamison: Formal analysis; Investigation; Methodology; Software; Visualization; Writing—review & editing. Amy Kuceyeski: Methodology; Software; Writing—review & editing. Alexander Thiel: Conceptualization; Data curation; Formal analysis; Funding acquisition; Investigation; Methodology; Project administration; Supervision; Validation; Writing—review & editing.
Declaration of Conflicting Interests
The author(s) declared no potential conflicts of interest with respect to the research, authorship, and/or publication of this article.
Funding
The author(s) disclosed receipt of the following financial support for the research, authorship, and/or publication of this article: This work was supported by the Canadian Institutes of Health Research [CIHR MOP#125954]; the Lady Davis Institute for Medical Research [CLIPP#2014]; and a Platform Support Grant (CanStim) from Brain Canada Foundation and the Canadian Partnership for Stroke Recovery.