
Abstract
Background. The contribution of lesion size and location in poststroke aphasia is debated, especially the extent to which aphasia severity is affected by damage to specific white matter areas. Objective. To identify specific white matter areas critical for poststroke aphasia global severity and to determine whether injury to these areas had more impact on aphasia severity than the infarct volume. Methods. Twenty-three chronic poststroke aphasic patients were assessed with the Aphasia Rapid Test (ART) and the Boston Diagnosis Aphasia Examination (BDAE) global severity scales and underwent diffusion tensor and structural imaging. Voxel-based diffusion tensor imaging regression analysis was used to determine in which areas fractional anisotropy (FA) abnormalities were correlated with ART and BDAE severity scales. The relationships between aphasia severity, FA values, and infarct volumes were investigated using global and partial correlations. Results. We found a critical area associated with aphasia severity overlapping with the arcuate and the inferior fronto-occipital fasciculi, resulting in a combined disconnection of the dorsal and ventral pathways. ART scores were inversely correlated with FA values in this region, with greater severity present with lower FA values (correlation coefficient = −0.833, P < .0001). The proportion of variance explained by the FA value was higher than the proportion of variance explained by the infarct volume (R2 = 68% vs 27%, P = .01). The impact of infarct volume on aphasia severity disappeared when damage to this critical white matter area was taken into account (P = .38). Conclusion. The assessment of the integrity of this region may potentially have a clinical impact in neurorehabilitation and acute decision making.
Introduction
There have been years of debate about the contribution of lesion size and lesion location in poststroke aphasia recovery. Studies on aphasia prognosis have emphasized the predictive value of lesion volumes for aphasia outcomes.1-4 However, the apparent influence of lesion size could be due to the more frequent extension of the infarction into critical areas involved in the symptoms severity. 1 This could explain why some studies have found no or low correlation between infarct size and aphasia severity.5,6 On the other hand, magnetic resonance (MR) studies using techniques such as diffusion tensor imaging (DTI) have investigated the anatomical correlates of specific items in speech impairment such as repetition, comprehension or naming disturbances7-9 underlining the role of the white matter tracts. However, the extent to which aphasia global severity (instead of specific language items) is affected by damage to specific white matter areas is less known. Hosomi et al (2009) 10 have suggested that the loss of the asymmetry of the arcuate fasciculus at the acute stage was predictive of the persistence of aphasia at day 30. Recently, Marchina et al (2011) 9 have investigated not only the contribution of the arcuate fasciculus (AF) in the impairment of the conversational speech but also white matter pathways in the ventral stream (the uncinate and the extreme capsule system). The AF lesion load (the percentage of the AF damaged by the infarct lesion), but neither the ventral lesion load nor the infarct size, predicted the overall efficiency of speech. However, the ventral lesion load has been found to correlate with comprehension impairment and comprehension is known to be one of the major determinants of aphasia severity. 8
In this study, we aimed to determine which white matter areas are critical for aphasia severity and to what extent damage to this/these area/s contributes to chronic aphasia impairment, especially compared with infarct volumes. Our aim was not to localize a specific cognitive process but to identify critical areas, which may correlate with the global severity of aphasia. For this purpose, we have chosen to conduct a study in chronic poststroke aphasic patients using a voxel-based DTI (VB-DTI) regression analysis. 11 VB-DTI regression analysis allows for the determination of areas where fractional anisotropy abnormalities correlate with a given score, here a global index of aphasia severity, without the identification of any specific location a priori. We focused on a global index severity, since a global index reflects more daily-life disability and impairment for stroke patients than specific language items (such as repetition, fluency, etc) rated separately. We hypothesized that any critical area would not be restricted to the AF as previously demonstrated9,10,12 but would also disconnect the ventral pathway, which has been proposed to be involved in the sound-to-meaning processes.13-15 We further hypothesized that fractional anisotropy values (which could be a measure of white matter integrity in stroke) extracted from this area would be better correlated than the infarct volume with the aphasia impairment.
Methods
The protocol consisted of a multimodal MRI and a language evaluation at the chronic stage. The local ethics committee approved the study. Written informed consent was obtained from each participant or from a legal proxy/family member.
Population
Twenty-three right-handed patients (14 males, mean ± standard deviation [SD] age = 57 ± 19 years, mean ± SD time poststroke = 16 ± 21 months) participated in the study. Patients were recruited retrospectively according to the following criteria: (a) presence of their first ever stroke in the left middle cerebral territory, (b) age >18 and < 85 years, (c) French native speaker, (d) aphasia persistent at day 1 poststroke (≥1 point in the language items of the Aphasia Rapid Test [ART] 16 ), (e) no contraindications for MRI, (f) no severe white matter lesions (Fazekas score <3), and (g) right-handedness.
Language Evaluation
The language evaluation was performed the same day as the multimodal MRI. All ratings were made by a trained speech therapist and verified by a second therapist.
As an index of severity of aphasia, we used the ART score. 16 ART allows for the rapid evaluation of aphasia severity based on 6 items, consisting of simple comprehension tasks (rated from 0 to 5 points), word and sentence repetition (0-8 points), object naming (0-6 points), semantic fluency of animals (0-4 points), and a dysarthria evaluation (0-3 points). The final score ranged from 0 to 26 points, with higher scores indicating greater impairment. Although the ART is a new test, it has been shown to be highly reproducible, very sensitive to changes in aphasia severity in acute stroke patients, and highly predictive of aphasia outcome (these characteristics and the simplicity of the task explain that we called it “an NIHSS-like aphasia test”). 16 In addition, the following tests were used to characterize aphasia’s profile for each patient: the Boston Diagnosis Aphasia Examination 17 with the dedicated severity scale (BDAE SS) and literal fluency 18 (known as Cardebat’s fluency). The severity scale from the BDAE ranged from 0 to 5, with lower scores indicating higher impairments. Verbal fluency was measured as the number of words beginning with the target letter “p” that could be generated in 2 minutes, excluding proper nouns, numbers, and different forms of the same word.
Magnetic Resonance Image Acquisition
The MR protocol included anatomical 3-dimensional T1-weighted MPRAGE images (TR = 2.3 seconds; TE = 4.18 ms; flip angle = 9°; TI = 900 ms; voxel size = 1 × 1 × 1 mm3; 176 slices), spin-echo echo-planar diffusion tensor imaging (TR = 10 seconds, TE = 87 ms, voxel size = 2 × 2 × 2 mm3, 60 slices, 60 gradient encoded directions with a b value of 1500 s/mm2, 11 non–diffusion-weighted volumes, with cardiac gating). Axial FLAIR (fluid attenuated inversion recovery) images were acquired also with the following parameters (voxel size = 1 × 1 × 5 mm, matrix = 256 × 320 mm, TR = 9 seconds, TE = 128 ms TI = 2.5 seconds).
Diffusion Image Processing
Image preprocessing was carried out using the FSL software (version 3.3; http://www.fmrib.ox.ac.uk/fsl). Diffusion images were corrected for eddy current distortions. Fractional anisotropy (FA) maps were generated using FDT (FMRIB’s Diffusion Toolbox). 19 All preprocessed FA maps were normalized into the Montreal Neurological Institute space (MNI http://www.bic.mni.mcgill.ca). For this purpose, non–diffusion-weighted images (B0) from each subject were normalized using the EPI template provided in SPM8 (http://www.fil.ion.ucl.ac.uk/spm). The transformation matrix derived from the normalization of the B0 images was applied to each FA map. Each normalized FA map was visually checked for misregistration. All normalized FA maps were then smoothed using an isotropic 6 mm, full-width, half-maximum Gaussian kernel, to reduce the variance due to individual anatomical variability. 11
We then performed a voxel-based multiple regression analysis using SPM8 with the smoothed and normalized FA maps and the language scores as variables of interest (ART scores). In the general linear model, age and time poststroke were entered as confounding covariates. The analysis was conducted using a height threshold of 0.001 (uncorrected) and corrected at the cluster level by a familywise error threshold at P < .05, for multiple comparisons. The 3 most significant peaks were described in terms of location and T-values using the Jülich Atlas. 20 The significant clusters that survived this multiple comparison were then overlapped with the probability maps of 3 main tracts representing components of the dorsal pathway (the arcuate fasciculus [AF]) and the ventral pathway (the uncinate [UNC] and the inferior fronto-occipital fascicule [IFOF]). These probability tracts maps (Figure 1) were generated from 24 healthy subjects scanned on the same MRI with the same diffusion acquisition and matched for age (P = .63), gender (P = .92), and laterality coefficient (P = .81) (see the Supplementary material). Finally, FA values were calculated for each patient into these areas determined by the voxel-based regression analysis.
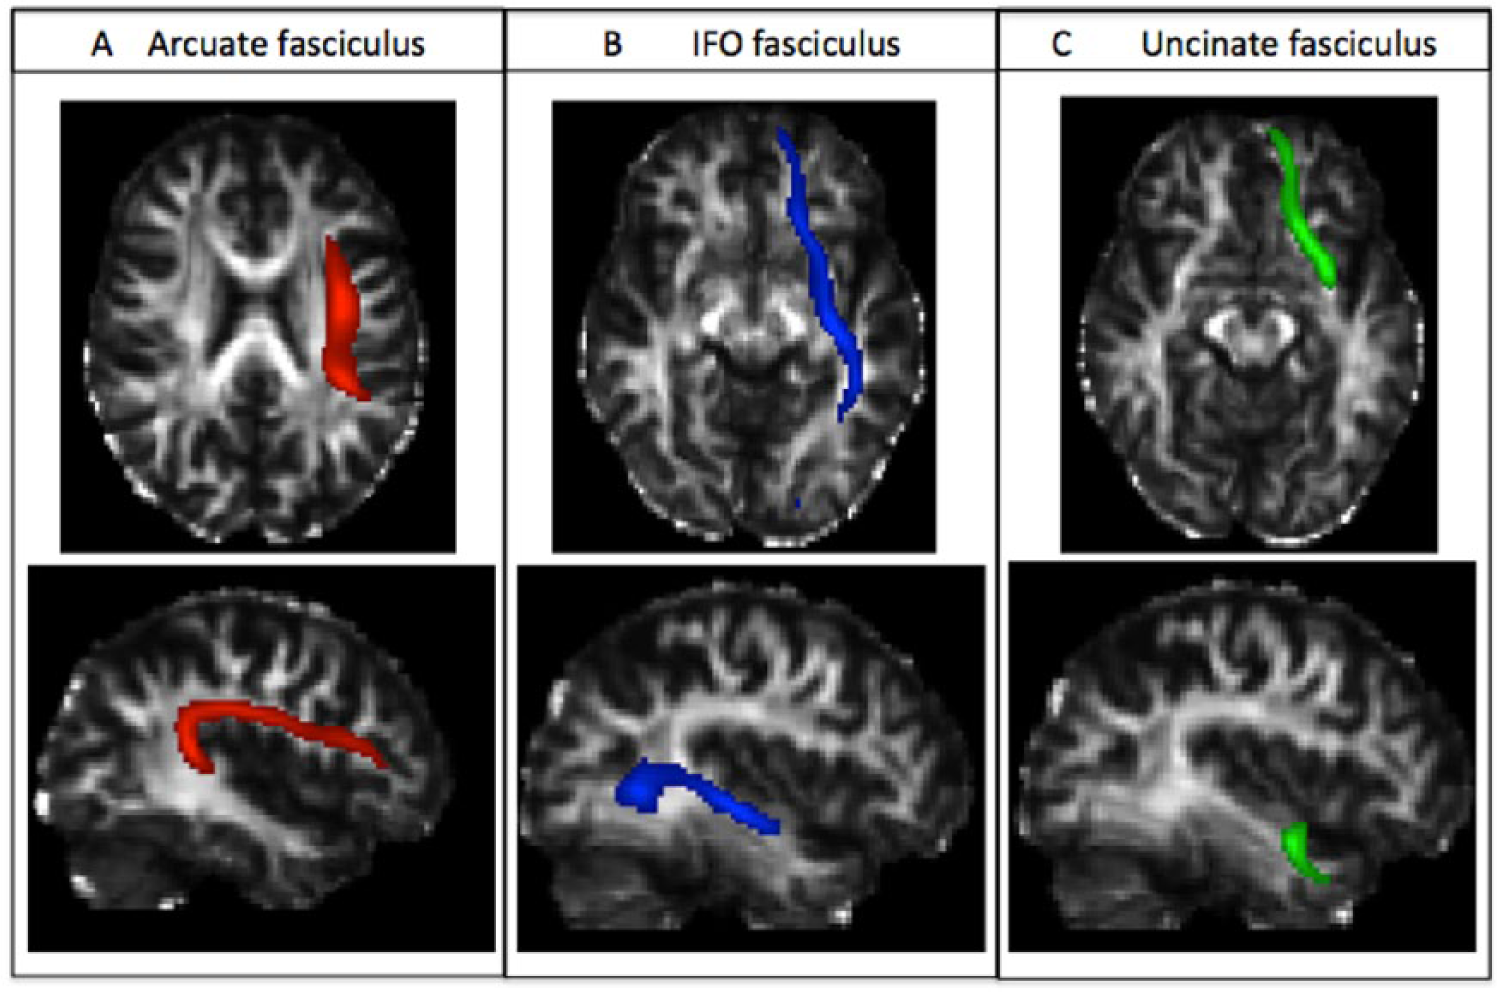
Probabilistic fibers tracts template in healthy subjects superimposed on a normalized fractional anisotropy map. (A) The arcuate fasciculus in axial and sagittal views (red). (B) The inferior fronto-occipital fasciculus in axial and sagittal views (blue). (C) The uncinate fasciculus in axial and sagittal views (green).
An addition voxel-based regression analysis was also conducted using the BDAE SS instead of the ART scores in order to verify that the areas found significant were not specific of the ART scores, but of aphasia severity.
Anatomical Images Processing
Infarct lesions were delineated on the FLAIR images of each patient in the native space by interactive manual outlining using the MRICron software (http://www.cabiatl.com/mricro/mricron). 21 This segmentation was performed by an experienced stroke clinician. Care was taken to avoid areas of leukoaraiosis. In cases where the infarct lesion was difficult to differentiate from lesions due to moderate microvascular leukencephalopathy, we compared it with the diffusion-weighted imaging acquired at the acute stage to localize the acute hypersignal. This case happened only once. FLAIR images were then normalized in MNI space using the masking option. 22 Volumes were then calculated in the MNI space.
Statistical Analysis
The descriptive statistics of the population include the mean and SD. Pearson’s correlation coefficients were used to correlate the fractional anisotropy values into the area determined by the voxel-based analysis (and the infarct volumes) with the ART scores (with 95% confidence interval [CI]). To disentangle the relationships between the ART scores, the FA values and the infarct volumes, we further examined the partial correlation coefficients between these FA values and the ART scores while removing the effects of changes due to infarct volumes. Indeed, partial correlation coefficients measure the degree of association between 2 variables (ie, the FA values and the ART scores) while removing the effect of a controlling random variable (ie, the infarct volume). 23 We did the same analysis between infarct volumes and the ART scores, while removing the effects of FA values, in order to determine the relative contribution of each factor. Finally, to determine if the correlation between ART scores and the region found related to aphasia severity by our voxel-based analysis (VB-DTI) was driven by a direct effect (caused by the infarct lesion) or a remote effect (by Wallerian degeneration), we performed the intersection between the lesion mask of each patient and the VB-DTI region. If the correlation between ART scores and this intersection was significant, we could argue that the correlation was mostly driven by a direct effect of the infarct. In constrast, if the correlation was not significant, the correlation could be the result of a remote effect. To that purpose, we overlapped the infarct lesion of each patient with the region found by our voxel-based analysis and computed the proportion (Pintersection in percentage) of this critical region infarcted in each patient according to the following formula: Pintersection = Vintersection/Vregion, where Vintersection is the number of voxels of the intersection and Vregion is the number of voxels of the critical region.
All descriptive statistical analyses were performed using SPSS software (version 20).
Results
Behavioral Characteristics
Patients’ characteristics are reported in Table 1. All had persistent aphasia at day 1 poststroke, based on the ART (mean ± SD = 15 ± 10). As expected, at the time of this study (mean ± SD time poststroke = 16 ± 21 months), aphasia severity (mean ART ± SD = 5 ± 6) and profile had evolved. Five patients (22%) scored 0 on the ART (5 on the BDAE SS). The remaining 18 had different profiles: 3 (13%) remained classified with a global aphasia, 5 were Broca’s aphasia (22%), 2 anomic aphasia (8.6%), 2 Wernicke’s aphasia (8.6%), 1 subcortical aphasia (4.3%), 1 transcortical sensory aphasia (4.3%), 1 conduction aphasia (4.3%), and 3 not classified (13%). The probability map of infarct localization covers most of the middle cerebral artery territory, but the distribution of individual infarcts was heterogeneous because, as shown in Figure 2, the area corresponding to voxels infarcted in less than 50% of the patients (in blue and purple on the rainbow map) was quite large.
Characteristics of the Patients.
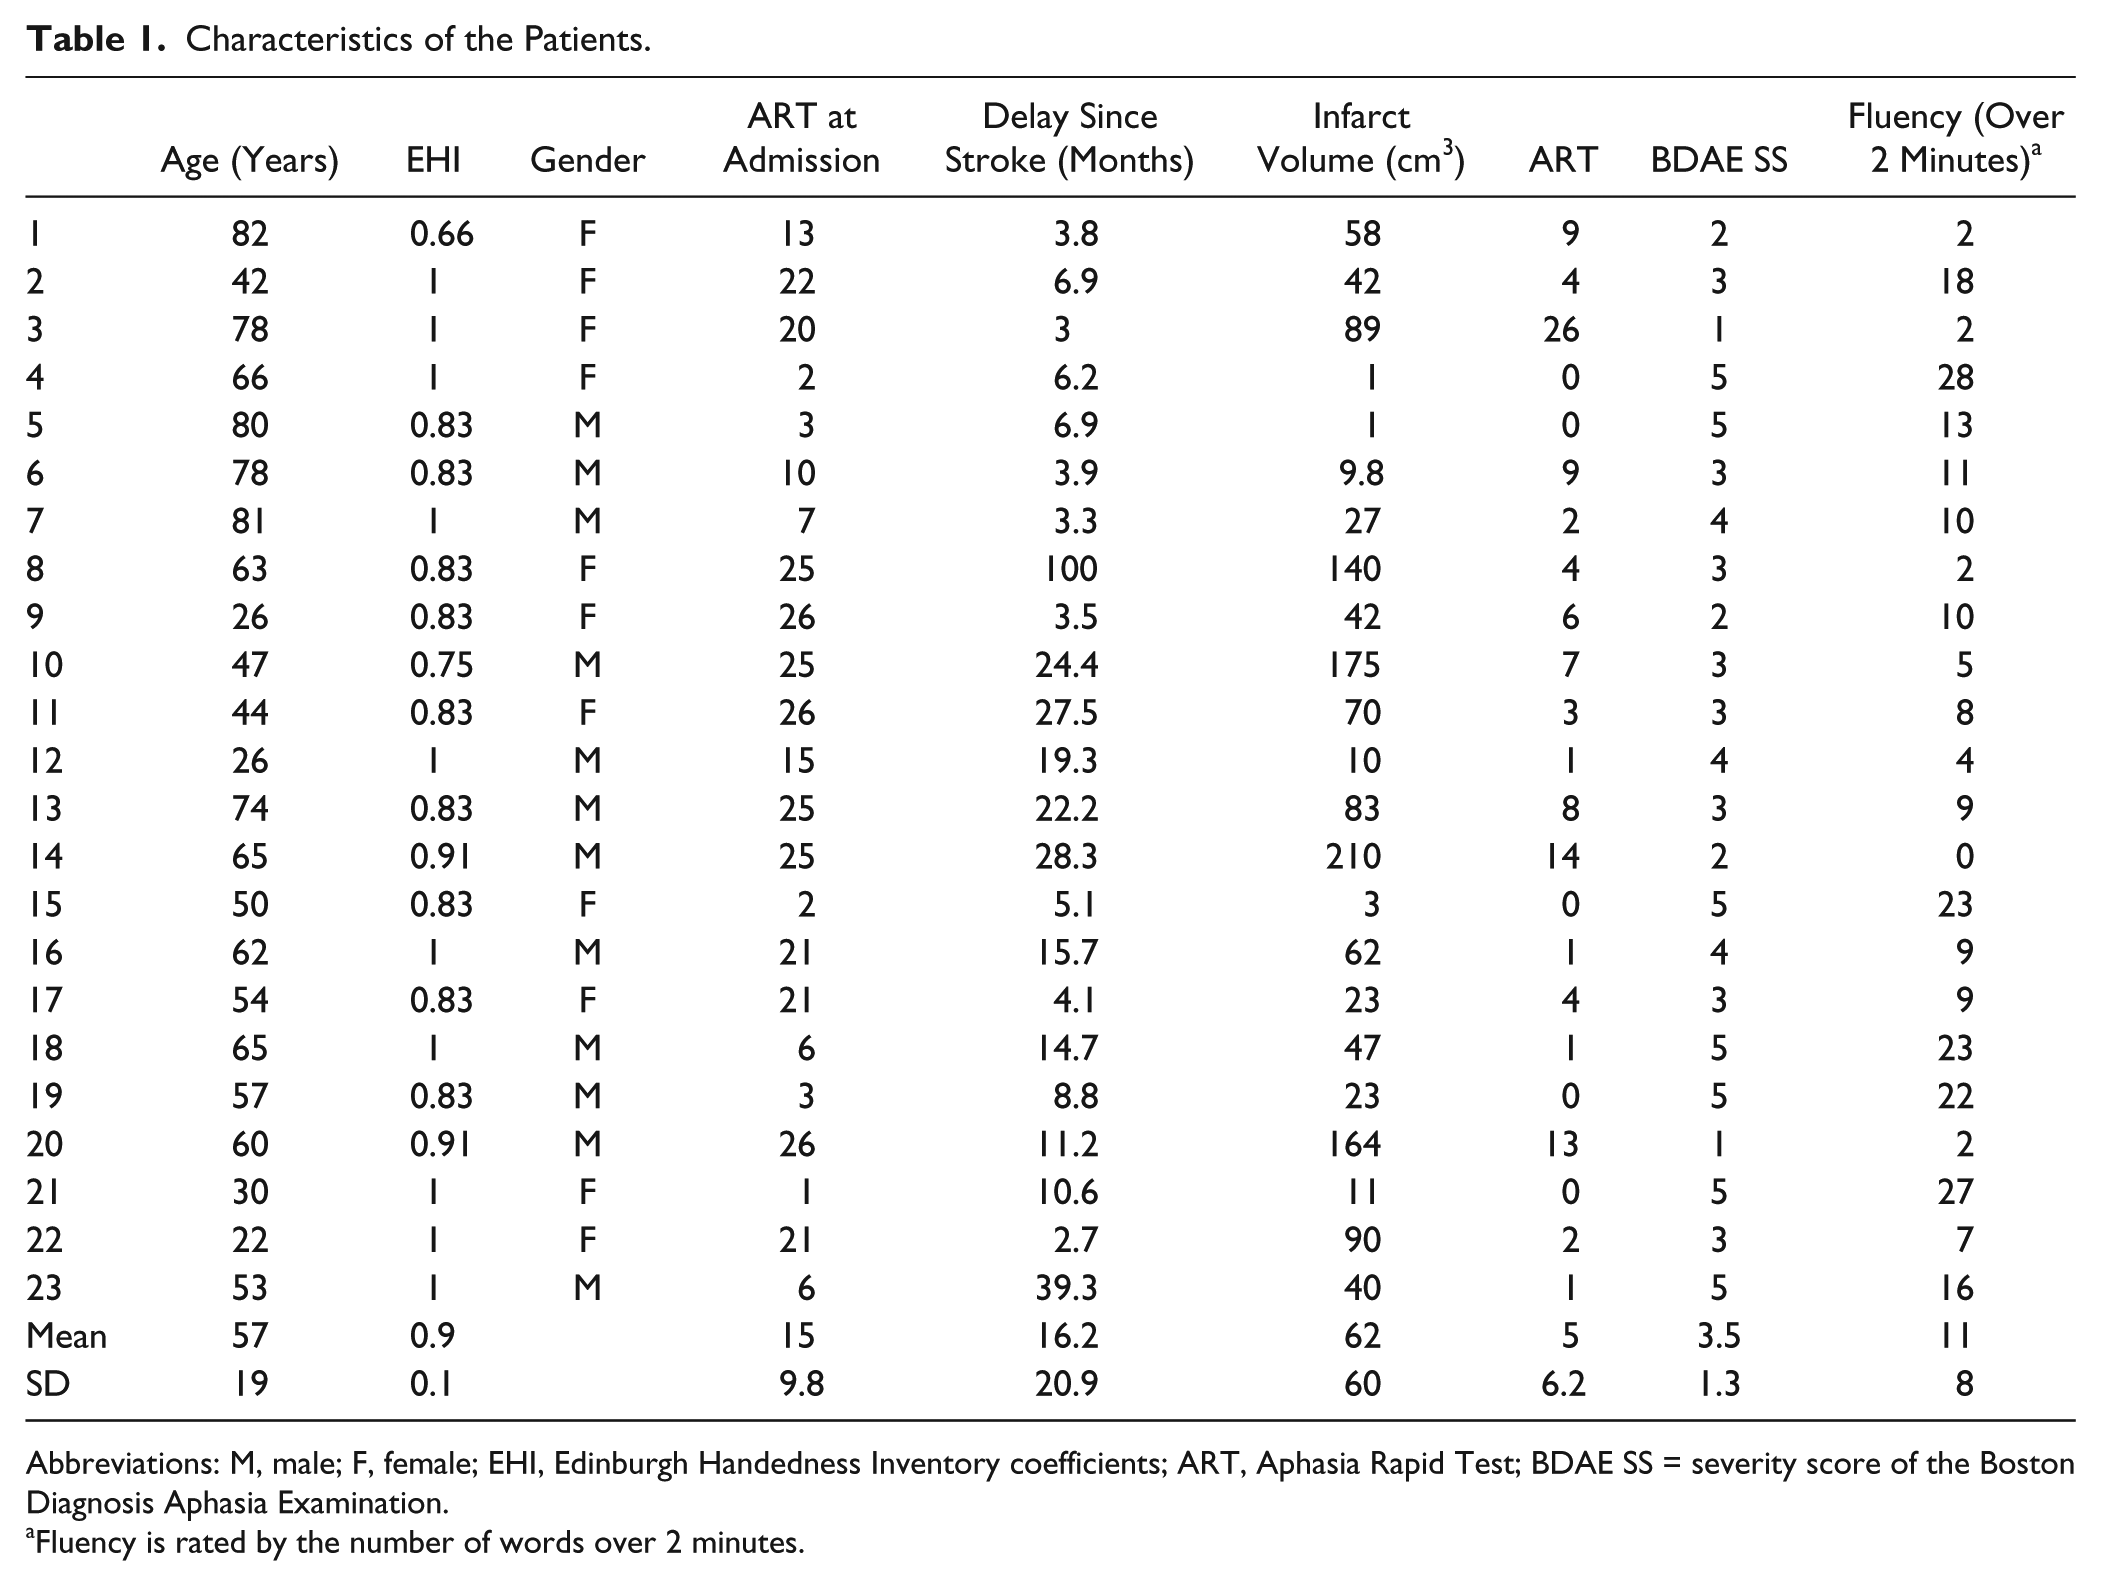
Abbreviations: M, male; F, female; EHI, Edinburgh Handedness Inventory coefficients; ART, Aphasia Rapid Test; BDAE SS = severity score of the Boston Diagnosis Aphasia Examination.
Fluency is rated by the number of words over 2 minutes.
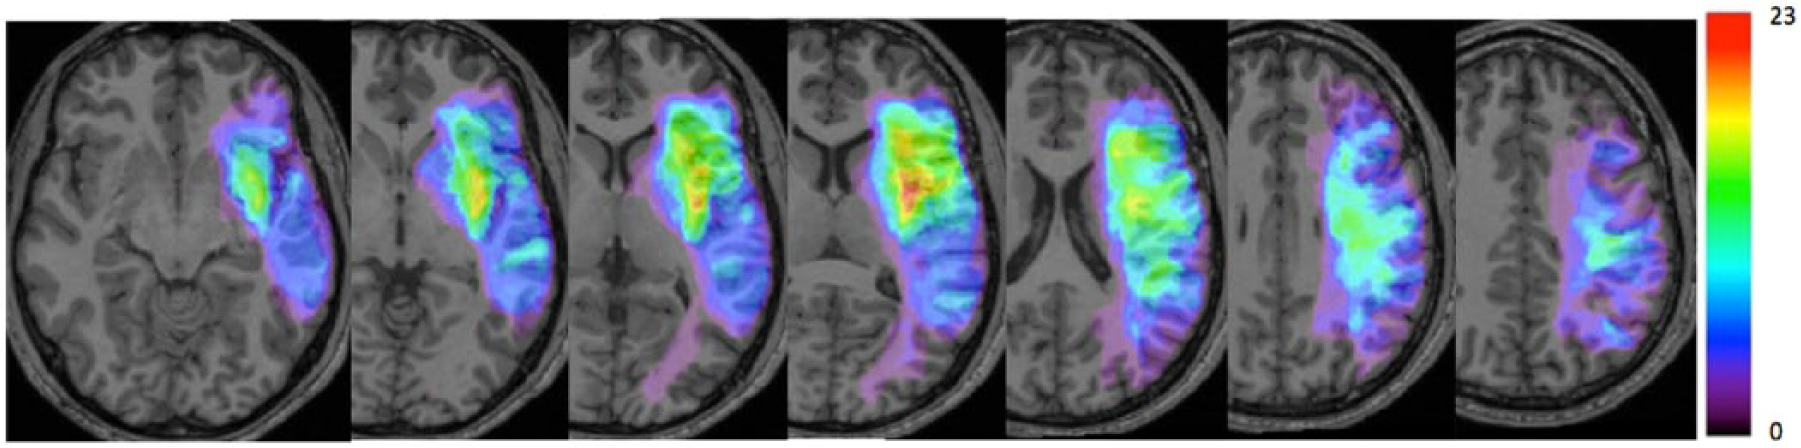
Probability maps of infarct lesions’ location. Overlap of infarct lesions on a T1 anatomical template. Color bar indicates the number of patients with infarction for each voxel from 0 to 23 (100%).
White Matter Correlates of Aphasia Severity
The voxel-based regression analysis between normalized FA maps and ART scores at the time of MRI showed that regions associated with greater aphasia severity were located in a single cluster (n = 1922 voxels, P < .0001), including the posterior arm of internal capsule, the posterior portion of the external capsule and the white matter underlying the supramarginalis cortex, and the posterior portion of the superior temporal gyrus, that is, the temporoparietal junction (Table 2, Figure 3A). Figure 3B and C shows that this area overlapped with the AF in this descendant portion, and the IFOF, creating a combined disconnection in the dorsal and the ventral pathways. This area spared the uncinate fasciculus. As an additional analysis, we found that the global severity scale of the BDAE correlated with the FA abnormalities in the same area, although at a lower height threshold (P < .01, Figure 3D). It should be noted that ART and BDAE SS were correlated with an R2 of 0.697 (P < .001), indicating that both scores capture similar aspects of aphasia severity.
Peak Coordinates a of the Statistical T-Map of Decreased Fractional Anisotropy Values Related to Aphasia Global Severity.
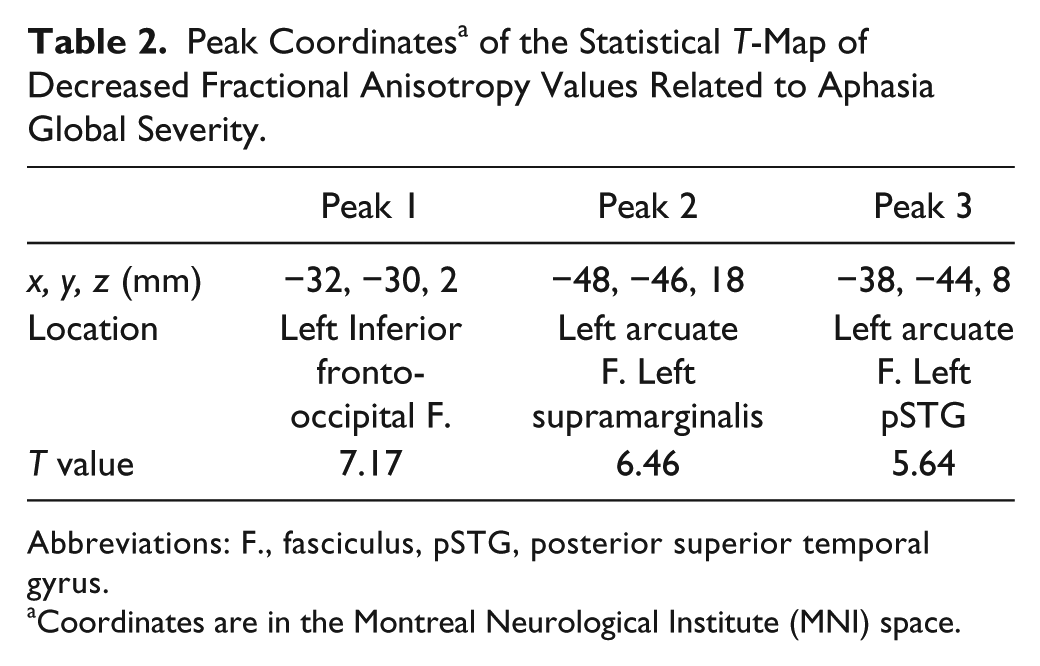
Abbreviations: F., fasciculus, pSTG, posterior superior temporal gyrus.
Coordinates are in the Montreal Neurological Institute (MNI) space.
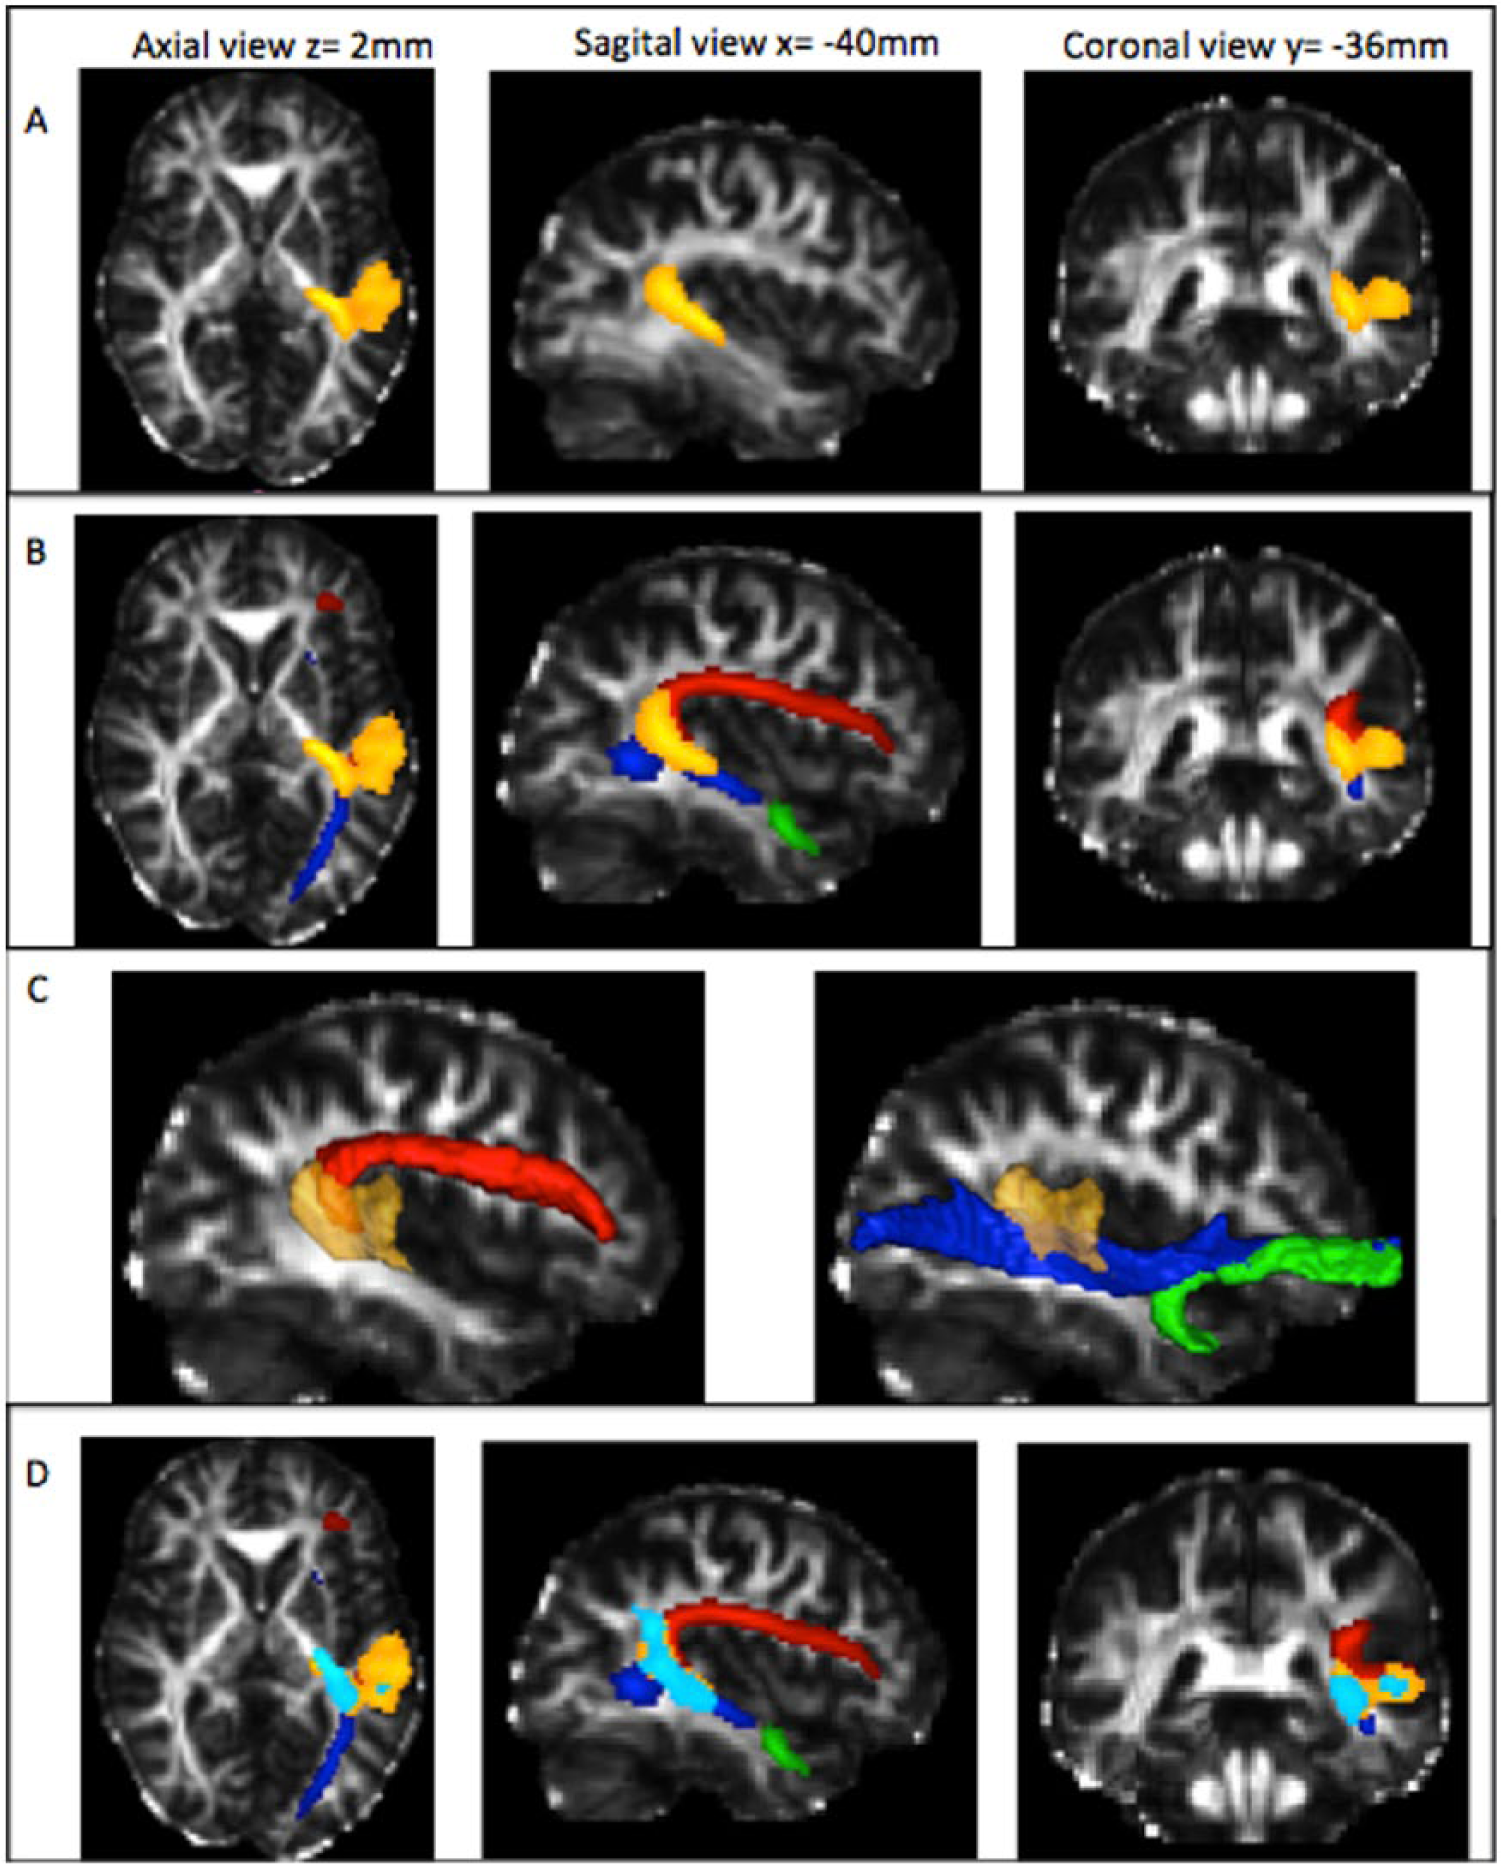
Region associated with aphasia severity superimposed on a normalized fractional anisotropy (FA) map. (A) Region associated with aphasia severity assessed by the Aphasia Rapid Test (ART) scores (in orange). (B) Region associated with aphasia severity assessed by the ART scores (in orange) and overlapping with the 3 fasciculi: arcuate fasciculus in red, inferior fronto-occipital fasciculus in blue, and the uncinate fasciculus in green. (C) Sagittal views of a normalized FA map with surface rendering of the regions of interest: region associated with aphasia severity in orange, arcuate fasciculus (red) and the ventral pathway with inferior fronto-occipital fasciculus (in blue) and uncinate (in green). (D) Regions associated with aphasia severity assessed by the ART scores (in orange) and the Boston Diagnosis Aphasia Examination (BDAE) severity scale (in turquoise) overlapped with the 3 fasciculi: arcuate fasciculus in red, inferior fronto-occipital fasciculus in blue and the uncinate fasciculus in green.
Contribution of Infarct Volumes, Damages of the Severity-Related White Matter Area, and the Aphasia Impairment
The FA values extracted from each subject from the area determined by the voxel-based analysis correlated well with the ART scores (correlation coefficient = −0.833, 95% CI = −0.927 to −0.641, P < .001; adjusted R2 = 0.680). Infarct volumes were also well correlated (correlation coefficient = −0.549, 95% CI = −0.177 to −0.784, P = .006, adjusted R2 = 0.269). However, the proportion of the variance of the ART scores explained by the FA values was higher than those of the infarct volumes (P = .01, Figure 4).
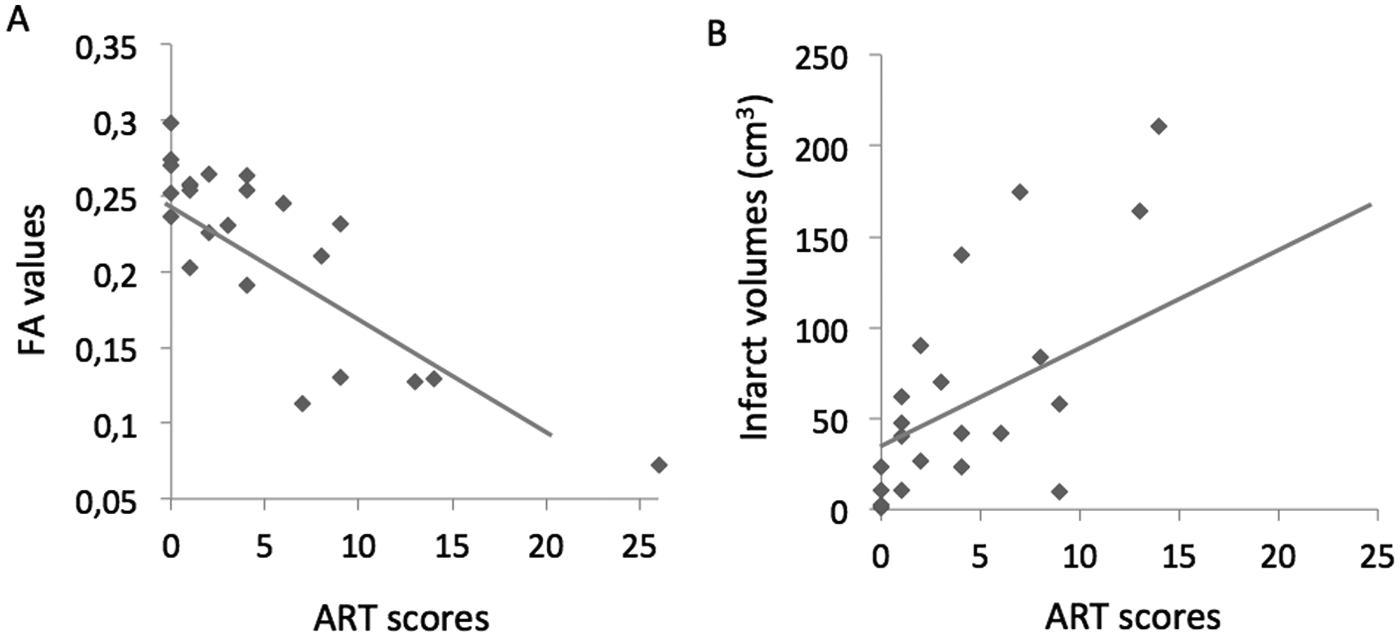
Scatter plot of (A) the Aphasia Rapid Test (ART) scores versus the fractional anisotropy (FA) values (y = 0.25 − 0.008x) and (B) the ART scores versus the infarct volumes (y = 35 + 5.3x).
To study the respective contribution of FA values and infarct volume on the variance of the ART scores, we computed partial correlations. Once the possible contribution of the infarct volumes on the relationship between the FA values and the aphasia severity was taken into account, the partial correlation coefficient was still significant (partial correlation coefficient = −0.761, 95% CI = −0.954 to −0.563, P < .0001). Conversely, once the possible contribution of the FA values on the relationship between the infarct volumes and the ART scores was taken into account, the partial correlation coefficient for infarct volumes was no longer significant (partial correlation coefficient = −0.194, P = .38), These results suggested that infarct volume contribution was likely a reflection of damage to this particular area.
Finally, the correlation between the ART scores and the Pintersection was found significant (correlation coefficient = 0.796, 95% CI = 0.572-0.910, P < .0001), indicating that the correlation was mostly driven by a direct effect caused by the infarct lesion instead of Wallerian degeneration.
Discussion
We found that the severity of aphasia was best correlated in these chronic stroke patients with injury to a relatively small white matter region (15 cm3), strategically located at the crossroads between the dorsal and the ventral language pathways. Injury to this area interrupts the arcuate and the IFO fasciluli, as well as the white matter of the temporoparietal junction. The severity of the damage to this area explained 60% of the variance in aphasia severity as measured by the ART. The correlation remained significant when the volume of infarction was taken into account, whereas the correlation between aphasia severity and infarct volume disappeared when damage to this white matter region was taken into account.
Location of the Critical Area Is Related to Aphasia Global Severity
The modern conception of the brain’s language organization reflects Dejerine’s and Geschwind’s original view of dorsal and ventral connections between language-related cortical areas.24,25 Indeed, Geschwind 26 already described that a “disconnection lesion” will be a large lesion either of the white matter projecting from association cortices or directly of the association cortex. The role of cortical and subcortical damage in disabling aphasia has been actually debated since Broca’s analysis of Leborgne’s brain and Pierre Marie’s description of its “quadrilatere” space (that involved the external capsule). Interestingly, we found that the aphasia severity was mainly related to damage to specific white matter structures including the ventral language pathway that travels through the “quadrilatere space” described by Pierre Marie.
The arcuate fasciculus is the largest and best-identified tract of the dorsal stream of the language network, and its role in the severity of aphasia is in agreement with previous studies. At least five studies using DTI have reported that damage to the AF is related to repetition impairment, naming and even comprehension disturbances but, moreover, to persistent chronic aphasia.7-10,27 By contrast, the ventral stream may play a central role in semantic processing, as suggested by the dual route model proposed by Hickock and Poeppel (2000) 28 and as confirmed by recent lesion studies, which found significant correlations between lesion load in the ventral fiber tracts, comprehension performance in acute aphasia, and semantic processing. 29 Duffau et al (2005) 30 also observed that IFO fasciculus stimulations generate semantic paraphasias. However, the role of ventral stream lesions in aphasia global severity is more contested. For example, lesion load in the uncinate and extreme capsule tracts did not correlate with impairments in speech production. 9 We believe that simultaneous injury to both dorsal and ventral streams may explain the strong correlation with aphasia severity in chronic stroke patients. This is consistent with the data of Marchina et al (2011) 9 who found that AF lesion load explained 45 % of the variance of overall efficiency of speech, whereas the combination of AF, uncinate, and IFOF lesion load explained 61% of the variance. This implies the supportive hypothesis that it is the multiple disconnections of both of the pathways that is related to aphasia severity. However, in our cohort, the uncinate was not found to be a critical location, as it has in others.10,31 Interestingly, the neurocomputational dual-route model of Ueno et al 32 suggests that recovery of repetition after dorsal lesion is explained in part by an increased role of the ventral pathway. Finally, it should be noted that, in addition to large white matter tracts lesions, the critical area as determined by the voxel-based analysis also extended into the white matter underlying the supramarginalis and superior temporal gyri, 2 regions that, when damaged, have been associated with poor recovery in aphasic patients.1,33 This region contained also a part of the cortices of these 2 regions, as VB-DTI analysis is not strictly restricted to white matter abnormalities.
Relationship Between Damage in the Severity-Related White Matter Area, Infarct Volume, and the Aphasia Global Impairment
In this study, infarct size was found to be well-correlated with the aphasia global severity, as in previous studies.1-4 One hypothesis could be that, considering the complex organization of language networks and the multiple areas involved, a greater volume is associated with damage to a higher number of critical cortical areas. Surprisingly, the relationship between aphasia global severity and infarct size was no longer significant when we took into account damage to the area defined by our voxel-based analysis. This suggests that the relationship between infarct size and aphasia global severity was only mediated by the damages to this region. Interestingly, the area described here is not so extended (15 cm3), and this finding does not support the hypothesis that infarct size was a surrogate for the destruction of multiple areas, but instead of one crucial one.
Limitations
There are several limitations to our study. First, although the total sample size was in the higher range of published DTI studies, the number of subjects was relatively low, limiting the subgroup analysis, for example, for different types of aphasia or different lesion locations. Indeed, few patients had infarcts limited to the inferior division of the MCA territory in order to determine the effect of white matter lesions on these different aphasia profiles. Another limitation is the pathophysiological significance of FA abnormalities in the white matter, which can theoretically be caused directly by the ischemic damage or by other remote mechanisms such as Wallerian degeneration. The ischemic damage hypothesis is supported by (a) the topography of the white matter critical area, (b) the probability map of the infarcts in good- versus poor-outcome patients (Supplementary figure 1), (c) the disappearance of the aphasia severity–infarct volume correlation once we controlled for the FA values in the critical white matter area, and (d) the correlation between the ART scores and the intersection of infarcted lesions with the critical white matter area. However, the role of Wallerian degeneration cannot be totally dismissed. Third, one may argue that our sample of patients is biased. However, the probability maps of the infarcts are very similar to those reported in 2 other studies8,34 suggesting that the distributions of the lesions are representative of the patients seen in clinical routines and already reported elsewhere. Also timing of assessments/measurements since stroke is heterogeneous in this study (ranging from 3 to >40 months), the interquartile ranges (25th and 75th percentiles) were between 5 and 20 months (median = 8 months). Since this time frame could have consequences on the FA values, we added it in our voxel-based analysis as an adjusting covariate. Finally, the simultaneous lesion of the dorsal and ventral language pathway explained only 60% of the variance of aphasia severity in the present study. This indicates that other focal cortical or subcortical lesions, which were injured in only a few of our patients and were not detectable by our method of statistical image analysis, may explain the remaining 40% of the variance. For example, the medial subcallosal pathway and the periventricular white matter, identified by Naeser et al (1989) 35 as important sites in severe nonfluent aphasic patients, were preserved in almost all our patients.
Conclusion
Aphasia global severity in chronic stroke patients is related to the destruction of a white matter crossroad area that disconnects both the dorsal and the ventral language streams. Damage to this area is strongly correlated with aphasia severity, independently of infarct size. The purpose of the study was not to elucidate the brain basis of specific language facilities but to determine which regions were associated with aphasia severity (with a global index) because it could be useful in clinical practice to assess the global impairment of aphasic stroke patients, with the help of the MRI. Indeed, and as a perspective, the assessment of the integrity of this region may potentially have a clinical impact in neurorehabilitation decision making. However, this impact should be assessed in more specific ranges of chronic patients, as the delay since stroke in our study varied from few months to 4 years and the decision making in neurorehabilitation should be adapted to this delay. Moreover, if confirmed in a more acute time window, mismatch in this area could give some clues for decision making in recanalization therapies. 36 For example, if the salvageable ischemic tissue included this area at the hyperacute stage, this could help stroke neurologists decide to give thrombolysis in some difficult cases, in order to spare this critical region.
Footnotes
Acknowledgements
We thank the Centre d’Investigation Clinique (INSERM/APHP, CIC9503) for their help in conducting this study by providing administrative facilities: Jean-Christophe Corvol (MD, PhD), Timothée Lenglet (MD), Vanessa Brochard (research assistant).
Authors’ Note
The funding sources had no role in the design or conduct of the study, data collection, data analysis, data interpretation, or in writing or approval of this report.
Declaration of Conflicting Interests
The author(s) declared no potential conflicts of interest with respect to the research, authorship, and/or publication of this article.
Funding
The author(s) disclosed receipt of the following financial support for the research, authorship, and/or publication of this article: This work was partially supported by the IFR 49 Institute (Institut Federatif de Recherche n°49, Gif sur Yvette, France). The research leading to these results has also received funding from the program “Investissements d’avenir” ANR-10-IAIHU-06.
References
Supplementary Material
Please find the following supplemental material available below.
For Open Access articles published under a Creative Commons License, all supplemental material carries the same license as the article it is associated with.
For non-Open Access articles published, all supplemental material carries a non-exclusive license, and permission requests for re-use of supplemental material or any part of supplemental material shall be sent directly to the copyright owner as specified in the copyright notice associated with the article.