
Abstract
Background
Gait characteristics and their changes during the 6-minute walking test (6MWT) in people with multiple sclerosis (pwMS) have been described in the literature, which one may refer to as walking fatigability in the body function level of the International Classification of Functioning, Disability, and Health. However, whether these metrics are reliable is unknown.
Objective
To investigate the between-day reliability of the gait characteristics and their changes in pwMS and healthy controls (HCs).
Methods
Forty-nine pwMS (EDSS 4.82 ± 1.22 and 54.7 ± 9.36 years) and 23 HCs (50.6 ± 6.1 years) performed the 6MWT, as fast as possible but safely while wearing Inertial Measurement Units. Gait characteristics were measured in the pace, rhythm, variability, asymmetry, kinematics, coordination, and postural control domains and were obtained in intervals of 1 minute during the 6MWT. In addition, gait characteristics change in the last minute compared with the first minute were calculated for all gait variables using a fatigability index (ie, distance walking index). The intraclass correlation coefficient (ICC), Bland–Altman Plots, and Standard error of measurement were applied to investigate reliability.
Results
Reliability of gait characteristics, minute-by-minute, and for their changes (ie, using the fatigability index) ranged from poor to excellent (pwMS: ICC 0.46-0.96; HC: ICC 0.09-0.97 and pwMS: ICC 0-0.72; HC: ICC 0-0.77, respectively).
Conclusion
Besides coordination, at least 1 variable of each gait domain showed an ICC of moderate or good reliability for gait characteristics changes in both pwMS and HC. These metrics can be incorporated into future clinical trials and research on walking fatigability.
Introduction
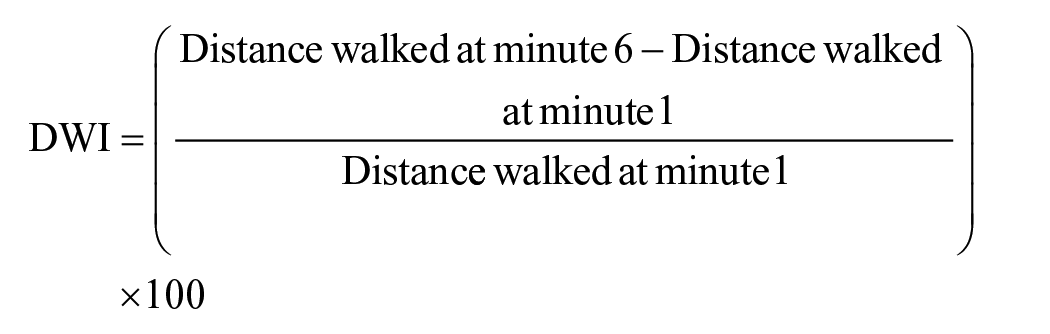
Multiple sclerosis (MS) is a chronic inflammatory-mediated and neurodegenerative disease and the leading cause of disability in young adults worldwide. 1 Impairments in walking and elevated fatigue levels are 2 of the most prevalent symptoms among people with MS (pwMS), with reported prevalence rates of up to 71% and 78%, respectively.2,3 Walking impairments are caused by many factors, such as spasticity, lower limb muscle weakness and/or loss in gait automaticity.4-6 In addition, fatigue in MS is also multifactorial and complex, including fatigability (ie, a decrease in performance in a given task) being an essential component of this symptom. 7 Within the fatigability construct, walking fatigability has been increasingly investigated at the activity level of the International Classification of Functioning, Disability, and Health (ICF) identified during prolonged walking protocols such as the 6-minute walking test (6MWT). 6 Walking fatigability is caused by MS-related symptoms such as increased spasticity, lower knee flexor/extensor muscle strength of the weakest leg, and impairments in balance.6,8,9 In recent years, studies have defined walking fatigability through different methods, such as investigating the dynamics of walking speed10,11 or the gait speed trajectory, 12 minute-by-minute, in the 6MWT. Another clinical definition very well used is the decrease of at least 10% in distance walked toward the end of the 6MWT, 13 affecting up to 50% of moderate-to-severe disabled pwMS. 14 The DWI6-1 (distance walked index, being the distance walked at minute 6 minus distance walked at minute 1/distance walked at minute 1 × 100), a fatigability index, is used to identify walking fatigability and has been shown to be a reliable measure in pwMS (intraclass correlation coefficient [ICC] of .762). 13
Nevertheless, the reliability of the changes, applying a fatigability index, in gait characteristics during prolonged walking protocols, which may help to understand walking fatigability manifestations at the body function level in the ICF, has not yet been investigated. Thereby, previous findings showing changes (worsening) in gait characteristics toward the end of the 6MWT in pwMS might be biased. Numerous studies have shown that several gait domains (ie, rhythm, pace, postural control, variability) are affected in pwMS toward the end of the 6MWT compared with the beginning 15 , including increased gait variability, 16 uncoordinated and asymmetric strides/steps, 17 reduced dynamic stability, 18 or even a drop foot sign. 19 To the best of our knowledge, only Hadouiri et al, 20 investigated and found that gait characteristics in the pace (gait velocity and stride length), rhythm (double support and cadence), and postural control (step width) gait domains, however, only within three 1-minute intervals (initial, 0′-1′; middle, 2′30″-3′30″; end, 5′-6') of walking, are reliable metrics during the 6MWT. However, gait also encompasses other domains,such as coordination, variability, asymmetry, complexity, and kinematics.16,21,22 Considering that MS is a heterogeneous disease and walking can be differently affected from patient-to-patient, 16 having all dimensions of gait could offer substantial and comprehensive information regarding gait characteristics and their changes during the 6MWT. Therefore, allowing for the detection of gait characteristics changes over the 6MWT, opening avenues for differentiating pwMS affected by walking fatigability in the activity (decrease in distance walked) and body function (gait characteristics changes) level of the ICF. Nevertheless, in order to include such measures in clinical trials and/or clinical practice, the gait characteristics change metrics over time must be reliable to drive conclusions regarding the effects of rehabilitation or symptomatic treatments in pwMS.
In this study, we aimed to investigate, in pwMS and healthy controls (HC), the (i) reliability of gait characteristics minute-by-minute during the 6MWT in 7 gait domains (pace, rhythm, asymmetry, variability, postural control, coordination, and kinematics), (ii) the reliability of gait characteristics changes during the 6MWT in the last minute compared with the first minute of the 6MWT, applying a similar as the DWI6-1 formula (ie, a fatigability index), and (iii) to provide cut-off scores for the reliable variables to assess whether changes over time are (ab)normal. We hypothesized that gait characteristics values over 6 minutes of walking would present good to excellent reliability between days. 20 The fatigability index, applied to these gait characteristics values, will result in lower but acceptable reliability, considering the higher variability these formulas can produce. 23
Materials and Methods
Participants
Fifty-one pwMS and 23 HC were recruited from the Belgian MS rehabilitation centers in Melsbroek (NMSC) and Overpelt (Noorderhart RMSC), flyers, website, and social media of the REVAL research center at UHasselt and the Flemish MS Society. Criteria for inclusion were age between 30 and 70; diagnosed with MS according to the revised McDonald criteria 24 ; and an Expanded Disability Status Scale (EDSS) score between 2.5 and 6.5. 25 HCs were sex- and age-matched at the group level. PwMS who had relapses less than 1 month before the start of the study and those who reported that they could not walk for 6 minutes without rest were not included. Other exclusion criteria were cognitive impairments hindering the understanding of the study instructions, pregnancy, musculoskeletal, cardiovascular, and disorders in the lower limbs or neurological disorders unrelated to MS that could affect mobility (checked by self-report).
Experimental Procedure
The study is part of a large project investigating the psychometric values of walking and cognitive fatigability in pwMS. Participants were enrolled for 2 test sessions (5-7 days in-between and at the same time of the day). Each session lasted approximately 2 hours, including rest periods. Conditions between the sessions (environment and evaluators) were identical. The participants were informed about the study objectives and provided consent by signing an informed consent (approved by the local ethical committee—#B1152021000009).
Descriptive and Clinical Outcomes
Several tests and questionnaires were applied in order to describe our cohort, including (i) Cognitive function: Paced Auditory Serial Addition Test (PASAT) 26 and the Symbol Digit Modality Test (SDMT), 27 (ii) Perceived fatigue: Modified Fatigue Impact Scale (MFIS), 28 (iii) Perceived fatigability: Pittsburgh Fatigability Scale (PFS),29,30 (iv) sleep quality: Pittsburgh sleep quality instrument (PSQI), 31 (v) Perceived walking ability: MS Walking Scale (MSWS-12), 32 (vi) Walking capacity: 25-foot walking test (T25FW), and (vii) Maximal Voluntary Contraction (MVC): To define the weakest/strongest leg the participants sat on a table with their knees in 90° flexion and were requested to perform a maximal isometric knee extension twice for 5 seconds, while their legs were strapped at the distal tibia (TAS606 Load Cell, maximal capacity: 50 kg, data frequency: 10 Hz). The peak force (kgf) was obtained from each trial, and the average of the 2 trials was used to define the weakest/strongest leg. A threshold of 10% difference between legs was obtained to define strength asymmetry. 33
Six-Minute Walk Test, Gait Measurement, and Data Analysis
For the 6MWT, the participants were instructed to walk as fast and safely as possible, back and forth, in either a 25 or 30 m hallway, depending on the testing location. 34 The use of assistive devices while walking was allowed. No encouragement was given throughout the test, and participants were informed about the last minute. The distance (m) and perception of effort (using the 10-point Borg scale 35 ) were documented before the beginning of the 6MWT and at every minute. To identify walking fatigability, the DWI 14 was calculated using the following equation:
Six Inertial measurement units (IMUs- Opal V1, APDM Inc., USA) set at 128 Hz and placed on the feet, wrists, lumbar (L4), and sternum were used to collect 3-axial accelerations, gyroscope, and magnetometer at upper and lower limb and trunk. After the end of the trial, the signal was transmitted to a PC for storage and further processing. Gait parameters were extracted on a cycle-by-cycle basis using dedicated software (Mobility Lab V 2.0.0.2 APDM Inc., Portland, OR, USA). Afterward, they were processed using a dedicated routine developed under the MATLAB® environment. In particular, they were segmented on a 1-minute basis. Values above or below 1.5 standard deviations of the average of that parameter per individual were excluded. The average of each gait variable within each minute was used as the final value for subsequent analysis. Lastly, the average of the weakest and strongest leg was calculated, and the values referring to the strongest and weakest leg (identified by leg extension MVC) were also calculated. The following gait variables for the specific gait domains were obtained (i) Pace: Stride length and gait speed; (ii) Rhythm: Cadence, step duration, double support, and stance time; (iii) Asymmetry: asymmetry of step duration and stance time; (iv) Variability: variability of step duration, and stance time; (v) Kinematics: Circumduction, foot strike and toe-off angle; (vi) Coordination: phase coordination index (PCI)17,36; and (vii) Postural control: Lyapunov exponent (Lye), trunk movement (sagittal and coronal planes, Table 1).
Gait Domain With Their Respective Gait Characteristics Description.
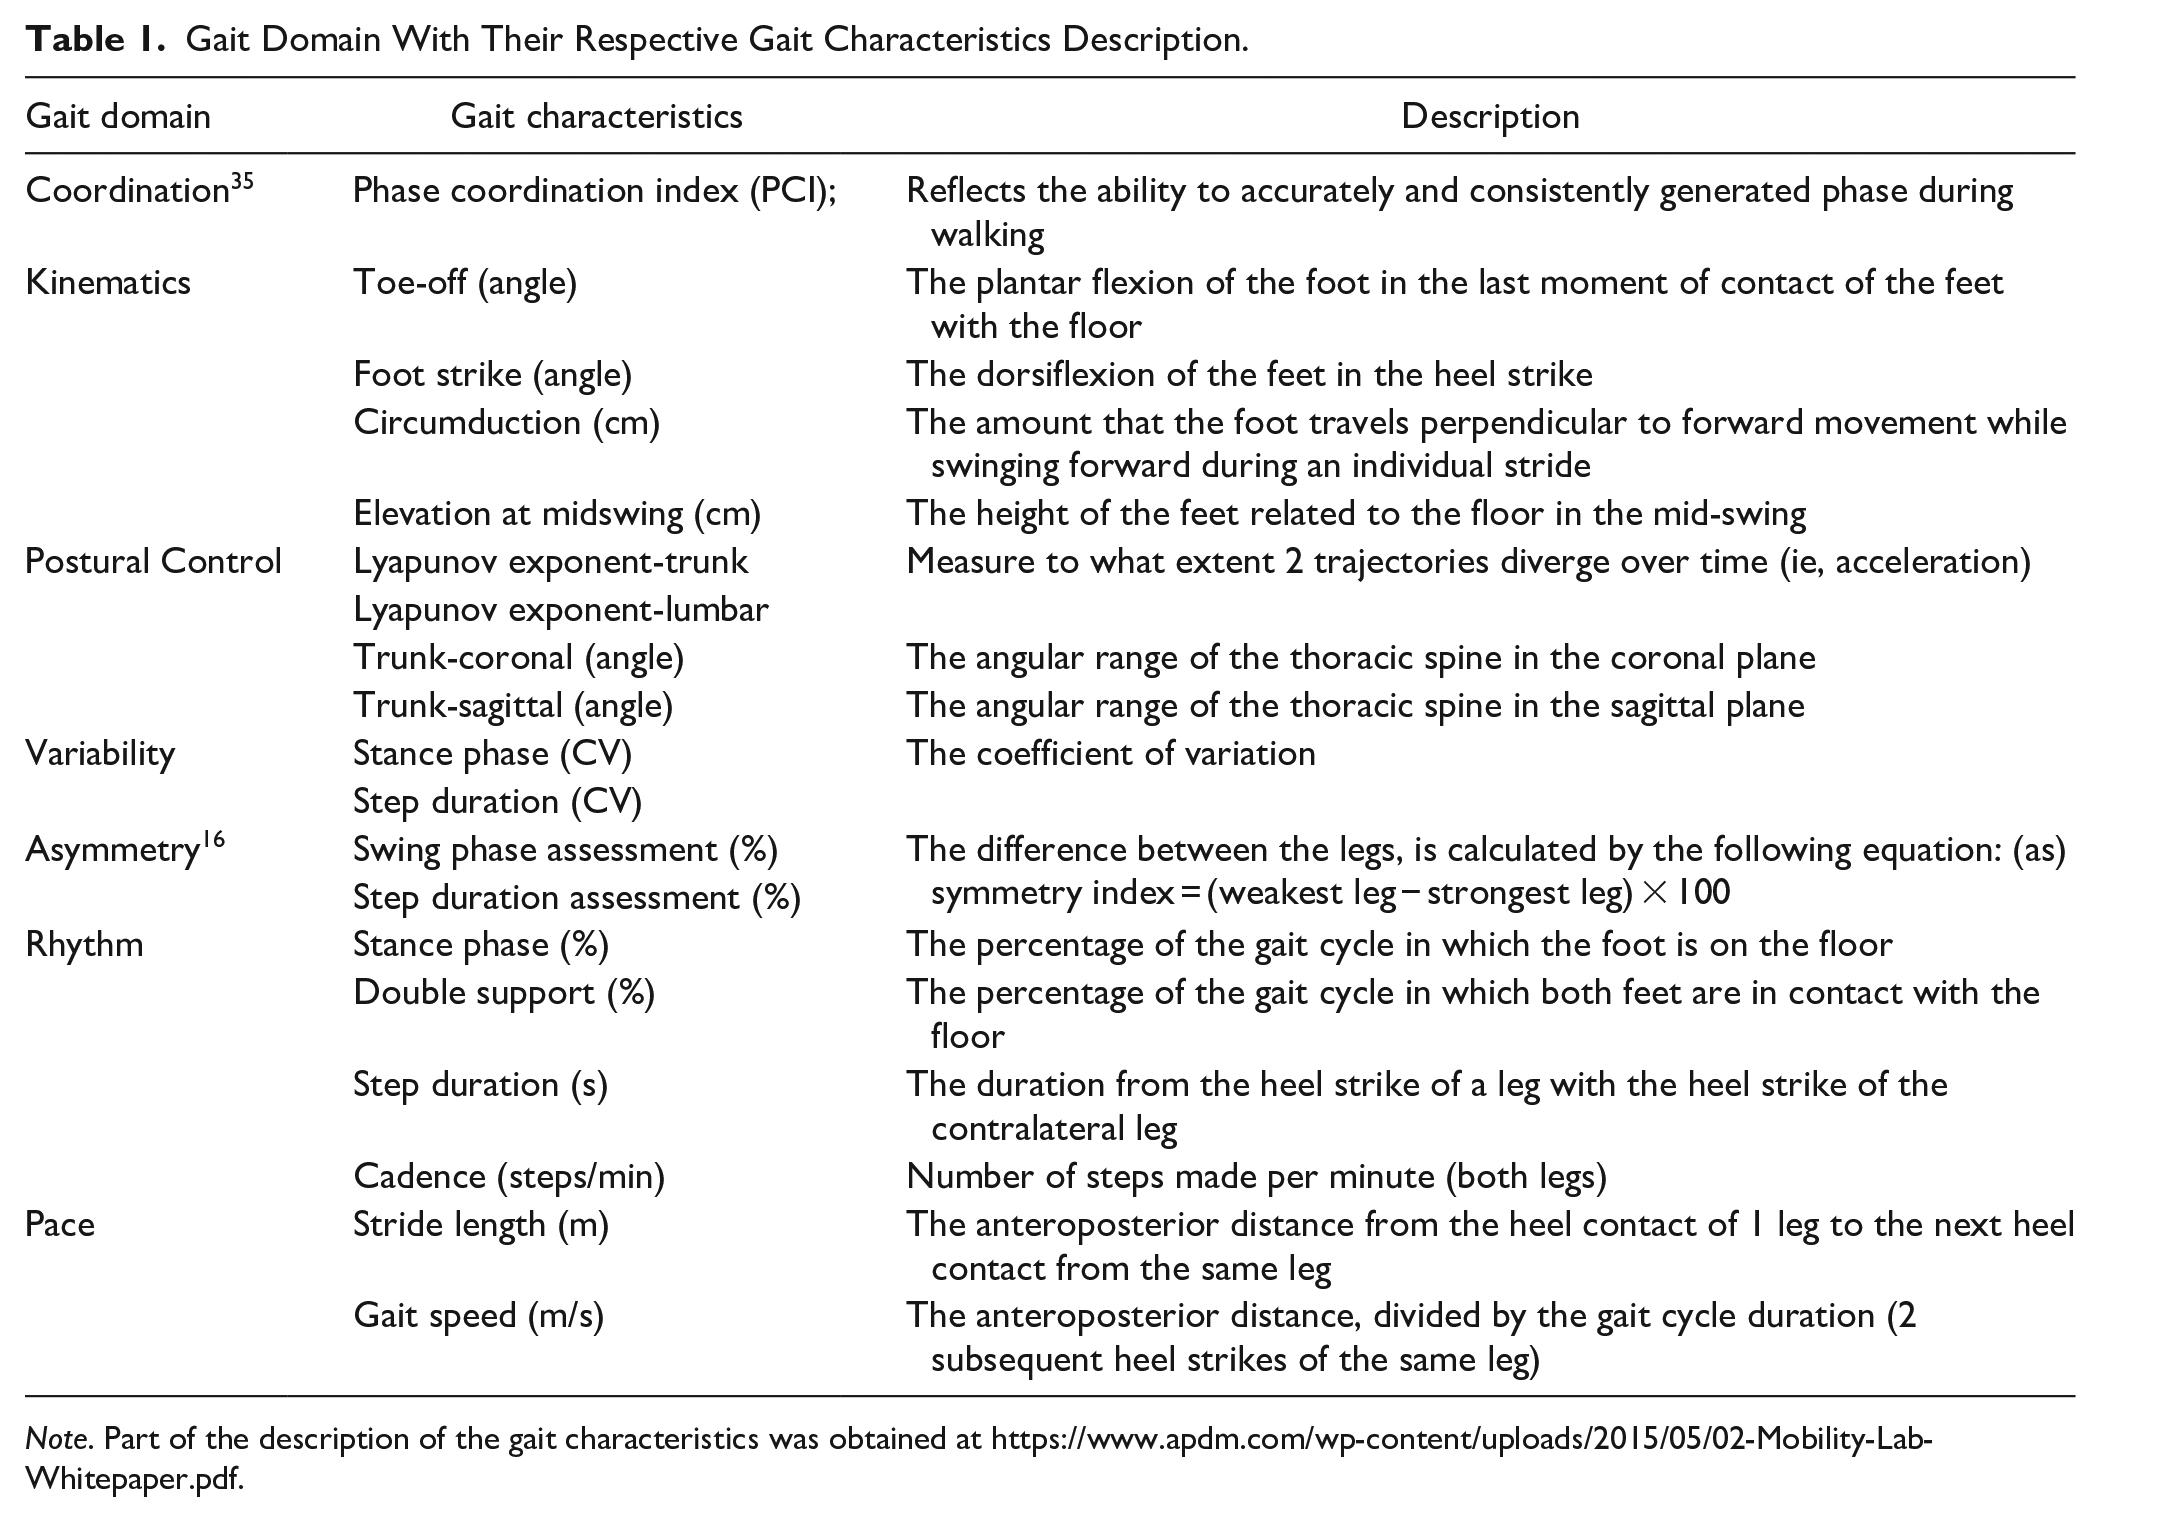
Note. Part of the description of the gait characteristics was obtained at https://www.apdm.com/wp-content/uploads/2015/05/02-Mobility-Lab-Whitepaper.pdf.
For postural control measurement during the 6MWT, the short Lye was calculated for the lumbar and trunk sensors using raw data (accelerometer and gyroscope) according to the procedure proposed by Arpan et al. 18 The following steps were performed (i) divided the data minute-by-minute and removal of turnings; (ii) detection of heel contact, mid-swing, and toe-off; (iii) segments of 7 consecutive strides and normalization of 130 points per stride; and (iv) Lastly, the Lyapunov exponent was applied and the average per minute was obtained. The feet sensors were used to detect the consecutive stride (steps ii and iii). Higher values of Lye were considered indicative of worse stability. 18
In addition to gait characteristics values, the changes in the percentage of these metrics were calculated by applying a similar approach to the DWI at the last minute (see formula above).
Statistical Analyses
Statistical analyses were conducted with R Studio (V. RStudio 2023.03.0+386 for Windows). All statistical tests were applied with a level of significance of 0.05. The Shapiro–Wilk test was used to check for normality. Anthropometric and descriptive outcomes were compared among groups with an independent-t test (parametric) and Mann–Whitney U (non-parametric) test.
Test–retest reliability of the gait characteristics of the 6MWT minute-by-minute and the gait characteristics changes (ie, fatigability index) comparing the last and first minute was examined by means of the ICC for a single measurement with a 2-way random effect with absolute agreement. Gait parameters were presented as the average of both legs and, in addition, for the so-called weakest and strongest leg (see Supplemental Materials). Test–retest was also examined for the total distance walked during the 6MWT and the DWI6-1. The ICC was interpreted as follows: <.5 poor reliability, .5 to .75 moderate reliability, .75 to .9 good reliability, >.9 excellent reliability. 37 The 95% confidence interval for the ICC was also calculated and reported in Figure 2 (gait characteristics changes) and in Supplemental Table 3 (gait characteristics). Bland–Altman plots (only for the gait characteristics changes), with 95% limits of agreements (LoA), were plotted to visualize the agreement of both sessions (differences and averages of the 2 sessions) and are presented in the Supplemental Material. We also calculated the average ± SD and standard error of measurement (SEM) of all parameters. Finally, cut-off scores to differentiate normal versus abnormal changes in gait characteristics of variables demonstrating ICC values above 0.5 (ie, moderate reliability) were calculated using the average ± 2 standard deviations for the fatigability index.13,38
Results
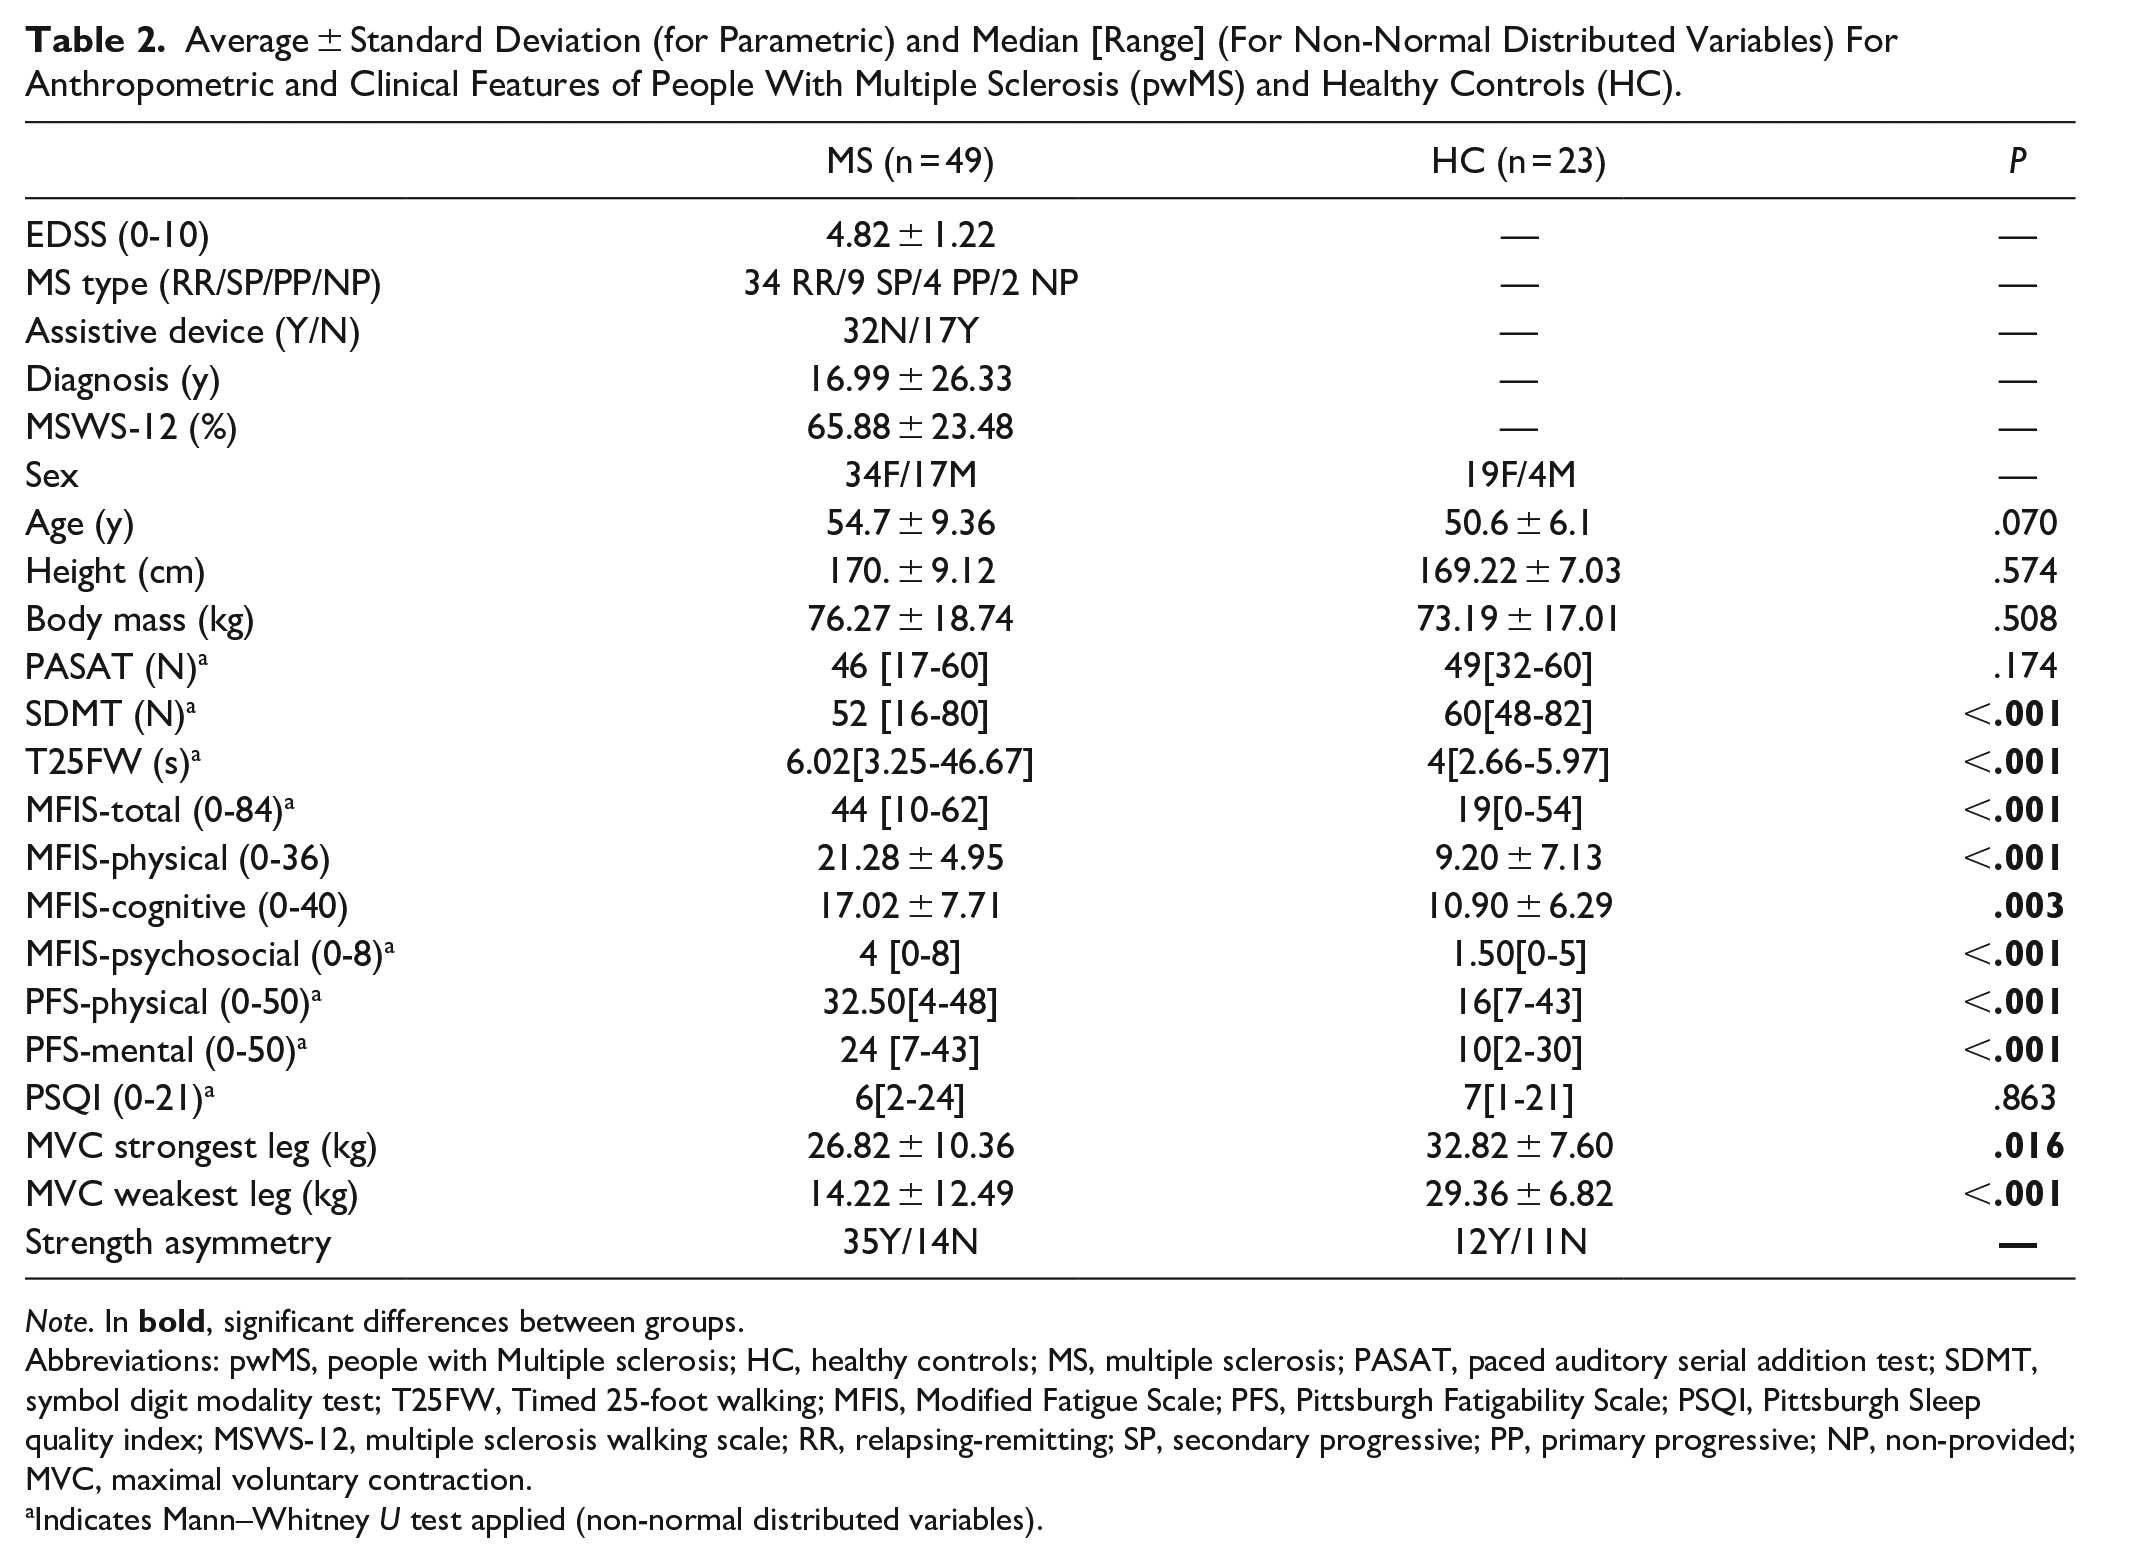
Two pwMS dropped out after the first session and therefore were excluded from the study. PwMS presented worse mobility (T25FW), higher fatigue (MFIS total and subscales), fatigability (PFS physical and mental), and slower cognitive processing speed (SDMT) compared with the HC group (P < .05, Table 2).
Average ± Standard Deviation (for Parametric) and Median [Range] (For Non-Normal Distributed Variables) For Anthropometric and Clinical Features of People With Multiple Sclerosis (pwMS) and Healthy Controls (HC).
Note. In
Abbreviations: pwMS, people with Multiple sclerosis; HC, healthy controls; MS, multiple sclerosis; PASAT, paced auditory serial addition test; SDMT, symbol digit modality test; T25FW, Timed 25-foot walking; MFIS, Modified Fatigue Scale; PFS, Pittsburgh Fatigability Scale; PSQI, Pittsburgh Sleep quality index; MSWS-12, multiple sclerosis walking scale; RR, relapsing-remitting; SP, secondary progressive; PP, primary progressive; NP, non-provided; MVC, maximal voluntary contraction.
Indicates Mann–Whitney U test applied (non-normal distributed variables).
Test–Retest Reliability on Gait Domains
For the test–retest reliability on gait domains (gait characteristics and changes), 8 pwMS and 1 HC were excluded because, in one of the sessions, there was missing data for the following reasons: sensors did not detect gait events (n = 1, dragging gait), software malfunctioning during data acquisition (n = 4), and incomplete buffering from sensors to data collection computer (n = 4). Therefore, the final analysis was based on 41 pwMS and 22 HC. Values from gait characteristics and fatigability index referring to the last minute of the trial can be visualized in Figures 1 and 2. The average and standard deviation scores of all the variables used, minute-by-minute, along with the SEM are presented in the Supplemental Material (Supplemental Table 1 and 2), the ICC for the weakest and strongest leg (Supplemental Figure 1), and the 95% confidence interval for all gait characteristics (Supplemental Table 3).
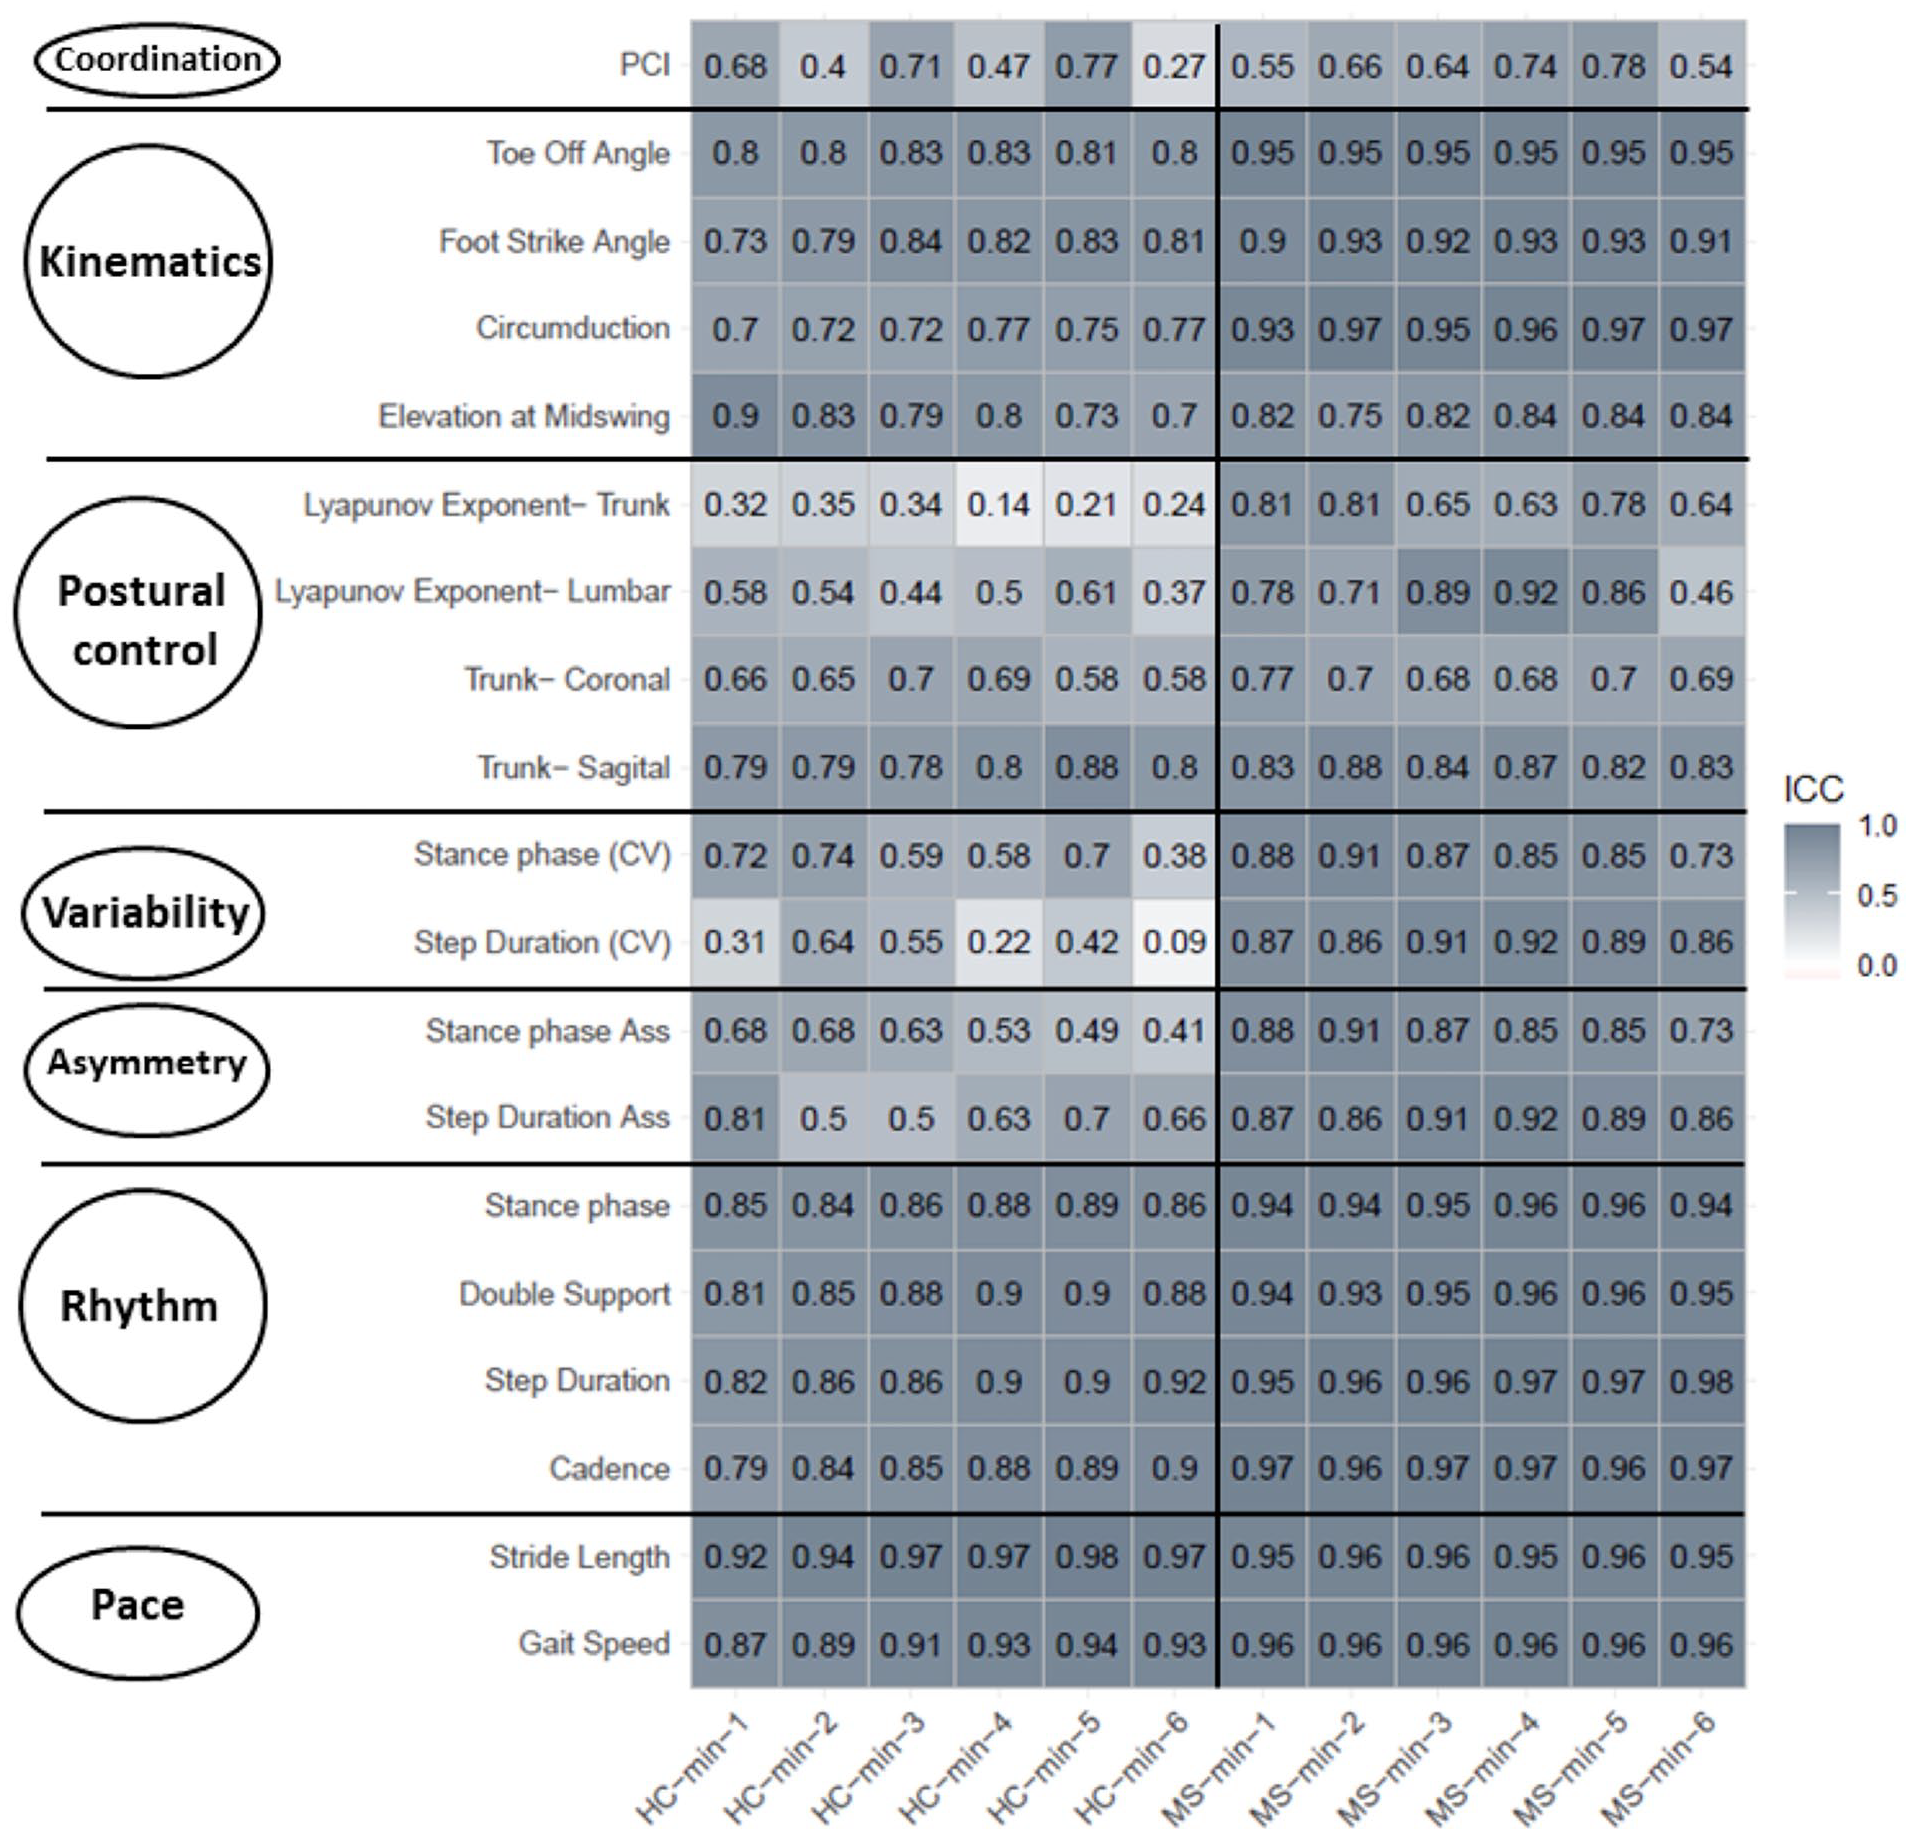
Color map of the intraclass correlation coefficient for each gait variable (pace, rhythm, asymmetry, variability, postural control, kinematics, and coordination gait domains), minute by minute, separated per group (healthy controls-HC and people with multiple sclerosis-pwMS).
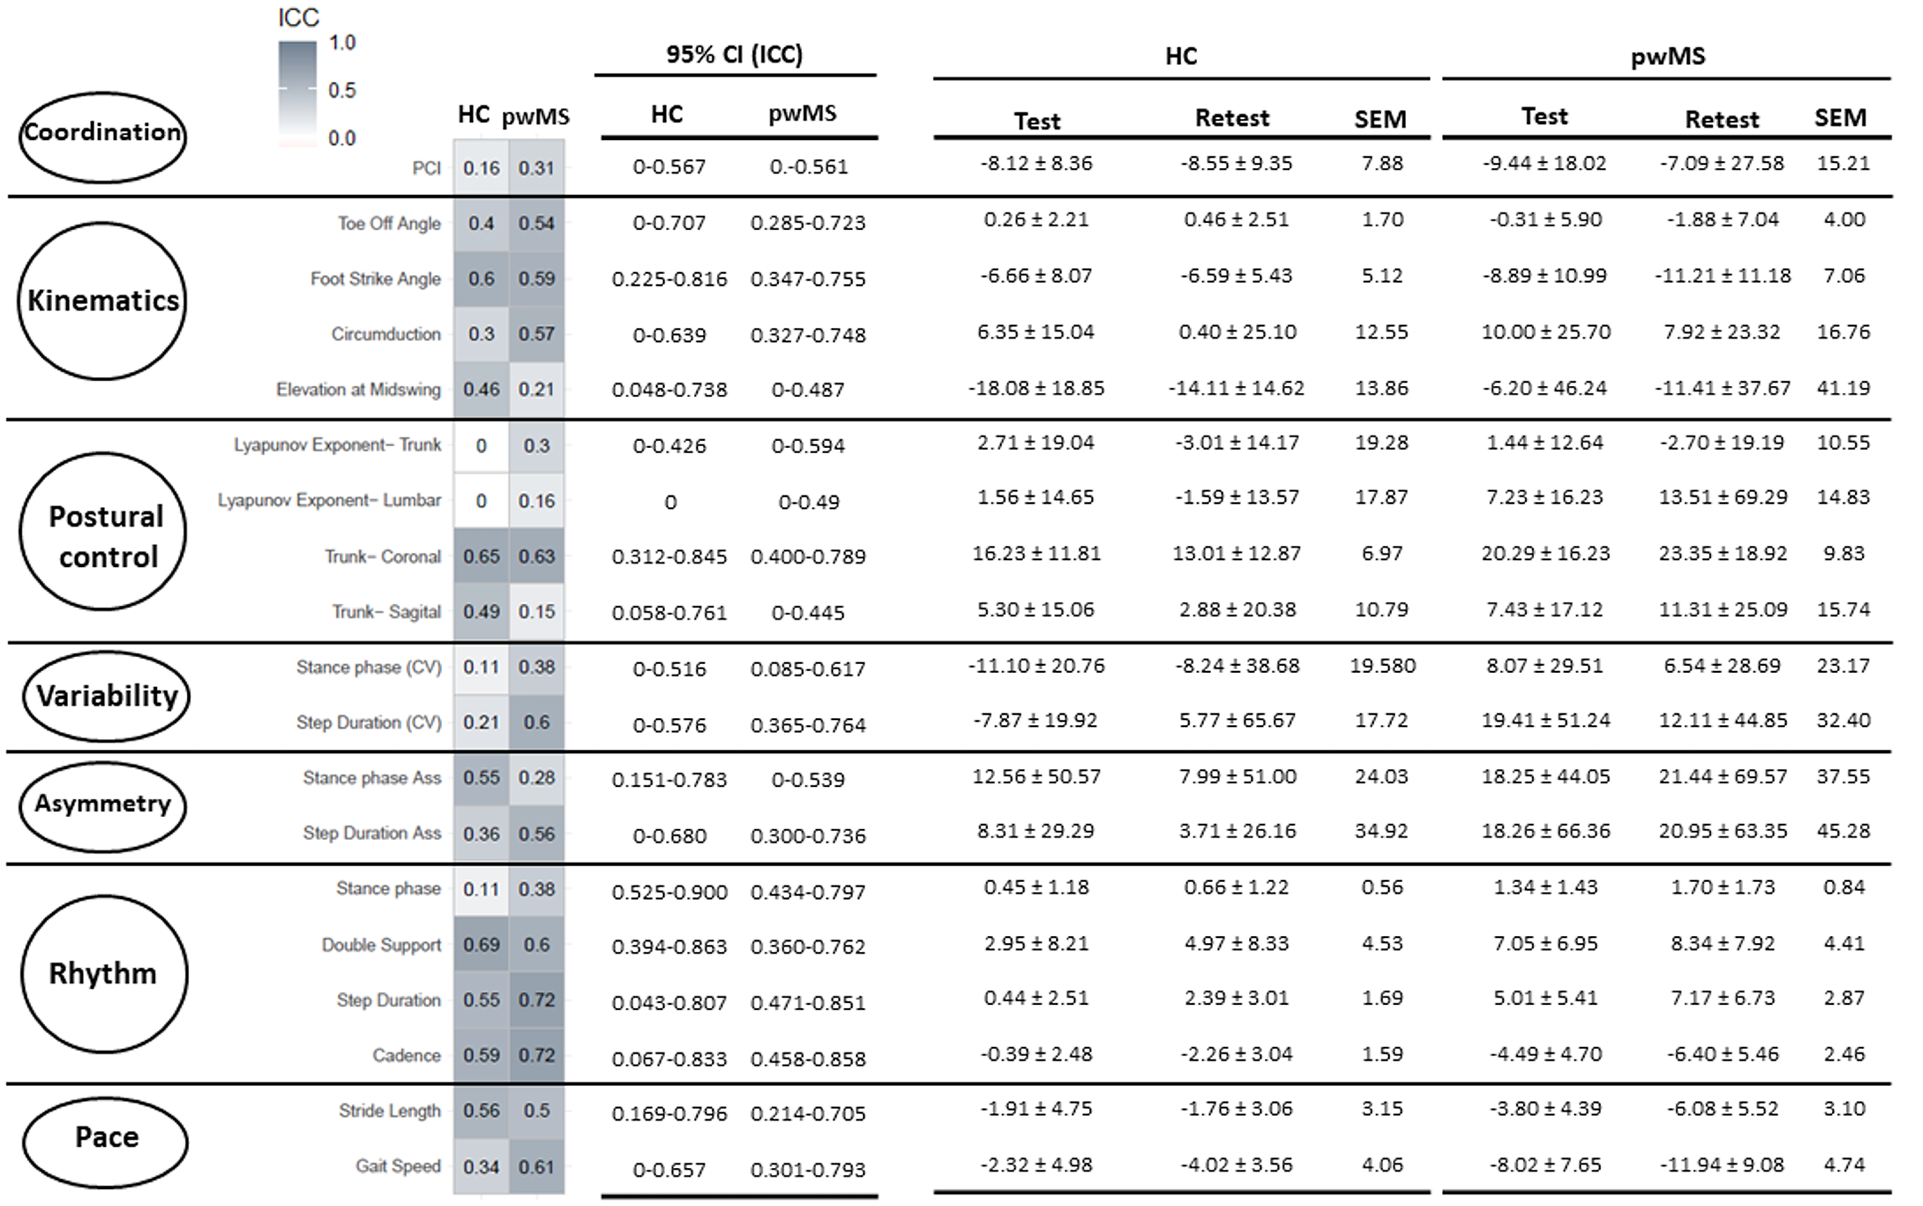
Intraclass correlation coefficient (ICC), 95% confidence interval (CI) of the ICC, average ± standard deviation, and standard error of measurement (SEM) for the gait characteristics changes from both healthy controls (HC) and people with multiple sclerosis (MS) groups.
Test–Retest Reliability on Gait Characteristics Minute-by-Minute
Related to the average of both legs for gait characteristics values, good to excellent reliability was observed for pace (HC ICC: 0.87-0.98, pwMS ICC: 0.95-0.96) and good to moderate on rhythm (HC ICC: 0.79-0.92; pwMS ICC: 0.93-0.98) gait domains. Additionally, the pwMS group presented good to excellent reliability on the asymmetry (ICC: 0.82-0.95) and kinematics (ICC: 0.79-0.97), moderate to good on variability (ICC: 0.64-0.86), poor to excellent on postural control (ICC: 0.46-0.92)h and moderate on coordination (ICC:0.73-0.74) gait domains. On the other hand, the HC group presented poor to moderate reliability on the asymmetry (ICC: 0.37-0.71), postural control (ICC: 0.14-0.88), and variability (ICC: 0.09-0.74), poor on coordination (ICC:0.36-0.37), and moderate to good on kinematics (ICC: 0.7-0.84) gait domains (Figure 1). Both the weakest and strongest leg presented similar results for the ICC and are displayed in Supplemental Figure 1.
Test–Retest Reliability on Gait Characteristics Change
Cut-off scores of gait pattern changes are presented in Table 3.
Cut-off Scores for the Gait Characteristics Change for the Reliable Variables and Are Presented in Percentage.
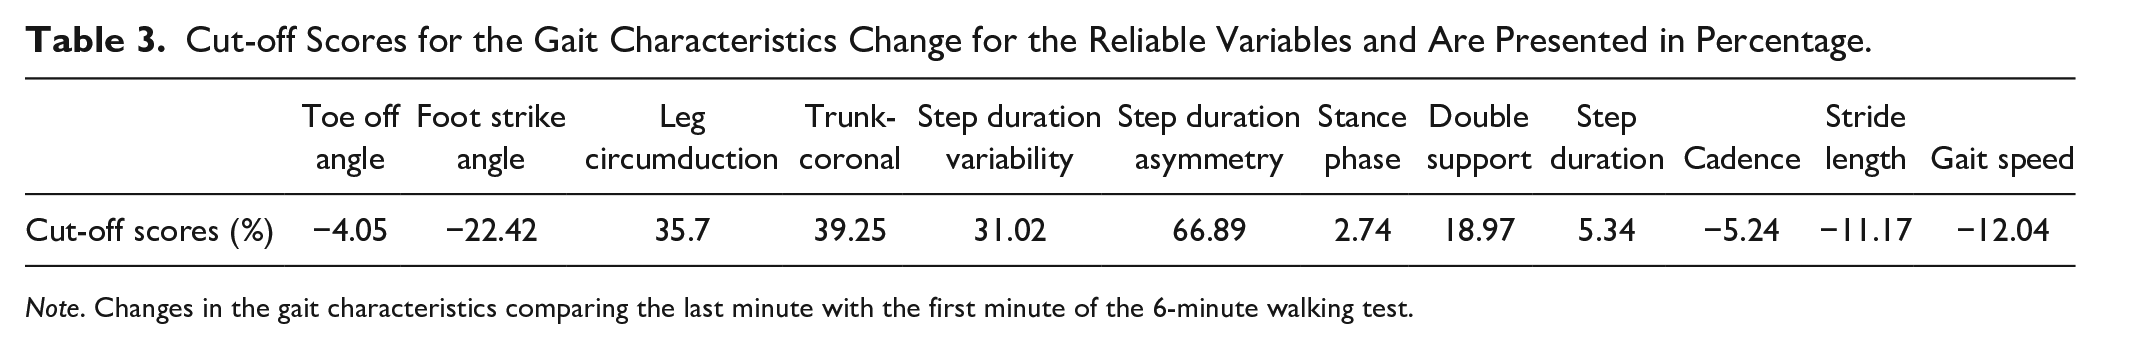
Note. Changes in the gait characteristics comparing the last minute with the first minute of the 6-minute walking test.
Related to the average of both the weakest and strongest legs for the gait characteristics change (ie, fatigability index values), the ICC values were lower compared with the gait characteristics values. Moderate to good reliability was observed for rhythm (HC: ICC 0.5-0.77; pwMS: ICC 0.6-0.72) and poor to moderate for pace (HC: ICC 0.34-0.56; pwMS: ICC 0.5-0.61), variability (HC: ICC 0.11-0.21; pwMS: ICC 0.38-0.6), postural control (HC: ICC 0-0.65; pwMS: ICC 0.15-0.63), kinematics (HC: ICC 0.20-0.56; pwMS: ICC 0.15-0.67), coordination (HC: ICC 0-0.65; pwMS: ICC 0.15-0.63), and asymmetry (HC: ICC 0-0.23; pwMS: ICC 0-0.41) gait domains (Figure 2). For pace and rhythm gait domains, the weakest and strongest leg presented similar ICC scores as average values. However, for kinematics (elevation at mid-swing) and variability, the weakest and strongest legs tend to differ in the ICC values (Supplemental Figure 1).
The Bland–Altman plot for changes in the gait characteristics changes is presented in the Supplemental Material (Supplemental Figures 2 and 3) and is in accordance with the ICC results. Although most of the data remained within the LoA in both study groups for all variables, several variables (with low ICC) were more dispersed from the mean difference. On the other hand, the gait characteristics change variable with higher ICC produced a Bland–Altman plot with data points around the mean difference.
Test–Retest Reliability on 6MWT, DWI, and BORG
The reliability of the 6MWT (min-by-min), DWI, and BORG are presented in Figure 3. The reliability of the distance walked in the 6MWT, minute by minute, ranged from moderate to excellent in HC (ICC 0.586-0.875) and excellent (0.948-0.970) for pwMS. As for the DWI, poor to moderate reliability was observed in HC, with the DWI6-1 presenting poor reliability (ICC = 0). In contrast, the reliability of the DWI ranged from moderate to good in pwMS (ICC 0.530-0.620), with the DWI6-1 presenting moderate reliability (ICC = 0.620). Lastly, poor to excellent reliability was observed for HC (ICC 0.243-0.880) and pwMS (ICC 0.413-0.684) on the BORG scale. The SEM and 95% confidence interval of the ICC for the 6MWT, DWI, and Borg are presented in Table S4.
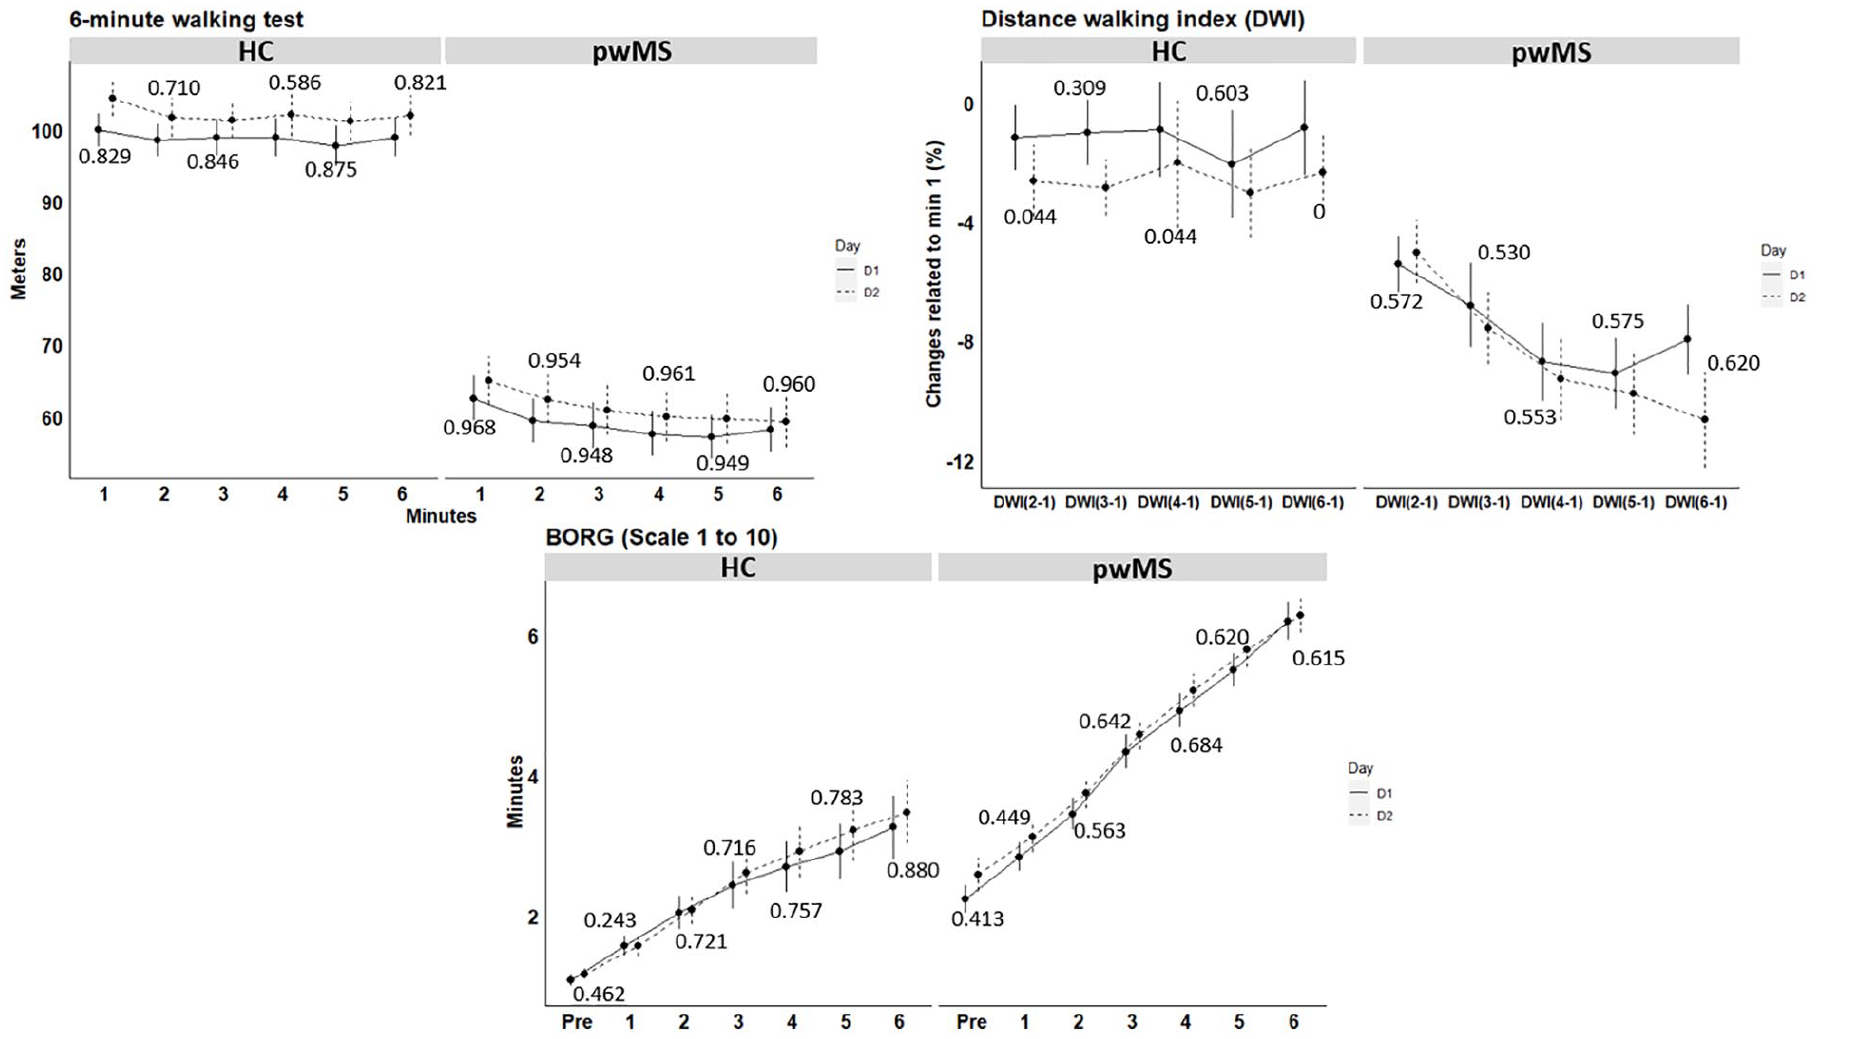
Average and standard error of the 6-minute walking test (6MWT, distance minute by-minute), as well as the distance walked index (DWI) and the perception of effort (Borg scale). Values reported in the figure are the intraclass correlation coefficient.
Discussion
The primary aim of the present study was to investigate the test-retest reliability of gait characteristics and their changes during the 6MWT in pwMS. This was performed by examining the gait characteristics minute-by-minute and exploring the changes in the last minute of the 6MWT compared to the first. Firstly, confirming our hypothesis, our results showed moderate to excellent reliability in all gait domains for gait characteristics minute-by-minute in both pwMS and HC. Secondly, the novelty of this study is the findings on the reliability of the changes in gait characteristics using the fatigability index (ie, similar DWI formula), which may contribute to identifying walking fatigability at the body function level. We demonstrated that, besides coordination, at least 1 variable of each gait domain demonstrated moderate (gait speed) or good (step duration variability) reliability in pwMS and HC. We provide cut-off scores for the reliable variables on the gait characteristics changes. Lastly, we demonstrated moderate reliability of the walking fatigability at the activity level (ie, DWI) and excellent reliability on 6MWT performance over time in both pwMS and HC, confirming previous findings.13,39,40
Our study sheds light on the consistency of gait characteristics, minute-by-minute, in the 6MWT in pwMS when performed on different days, confirming that gait characteristics are individual and are stable, similar to a fingerprint. 41 In contrast to Hadouiri et al, 20 which measured the 6MWT gait characteristics with an electronic walkway system and an oval circuit of 24m, we evaluated gait characteristics using IMUs in a 25 to 30 m corridor. The advantage of using IMUs enables the evaluation of gait characteristics on a single gait cycle basis (although the turnings are not included in the final analysis), is reliable in the assessment of gait parameters in short walking 42 and allows detecting changes in gait characteristics in pwMS during the 6MWT.10,16,18,43,44 Our results build upon the current knowledge by adding new variables to the domains measured by Hadouiri et al, 20 showing that variability, asymmetry, kinematics, and coordination gait domains are also reliable in pwMS during the 6MWT. Moreover, although reliability in gait parameters during short walking protocols has been shown to be similar between different levels of MS disability,45,46 we recommend future studies to investigate the reliability of the gait parameters during the 6MWT in mild pwMS (EDSS <2.5).
A major novelty of our study is related to the reliability of the fatigability index applied to different gait characteristics. To the best of our knowledge, no previous study has investigated this aspect in both pwMS and HC for different gait characteristics. A recent review of our research group highlighted the decrements in gait characteristics in pwMS toward the end of the 6MWT. 15 However, most of the included studies focused on the values of the gait characteristics without considering the change in these gait characteristics. To our knowledge, only Arpan et al, 18 Shema-Shiratzky et al, 16 Socie et al, 47 and Hadouiri et al, 48 applied a fatigue index formula (ie, similar to the DWI) on balance (ie, Lye), variability (ie, stride time), and spatial-temporal parameters, respectively. These studies observed a decrease in gait stability at the end of the 6MWT, 18 associations between the changes in gait characteristics with the MFIS or MSWS-12 16 and decrements in spatial-temporal parameters.47,48 Our findings demonstrated that these metrics have poor (Lye) and moderate (variability, rhythm, and pace) reliability in MS, which may introduce bias in their findings.
In addition, one may argue that using a fatigability index to detect changes in gait characteristics produced lower ICC than gait characteristics values. The 6MWT allows people to pace themselves, including pwMS, 49 even when instructed to perform their maximum, as in our case. Tests that provide and allow the pacing strategy can impact reliability results 50 as a learning effect could happen, and the participants could learn how far they can walk or how fatigued they will be at the end of the protocol, changing their initial and final strategy accordingly. For example, gait speed and cadence, mainly in the first minute but also minute-by-minute, seemed slightly greater on day 2 compared to day 1 (see supplemental file). This can indicate that pwMS and HC were familiar with the test on the second day and changed their strategy to some extent. Moreover, applying the fatigability index formula to identify gait characteristics changes increases the data’s variability, 23 reducing reliability. We encourage future studies to address this issue. In addition, our results allow us to investigate whether the changes at the end of the 6MWT are (ab)normal considering HC data and if this could be termed as another manifestation of walking fatigability in the body function level. Thereby, we also provided cut-off scores for those variables presenting at least moderate reliability values.
Although not a primary goal of this study, we presented the reliability of the gait characteristics and their changes by the weakest and strongest leg. Nevertheless, one may argue that the reliability of gait characteristics variables depends on impairment level. Typically, differences in kinematics and spatial-temporal characteristics are observed in pwMS between the strongest and weakest leg during gait, 51 with the weakest leg being the better predictor for gait performance. 5 In this context, Ramari et al, 9 and Van Geel et al, 8 have shown that walking fatigability (ie. DWI6-1) is related to knee flexor and extensor and ankle dorsiflexor muscle strength of the weakest leg. Therefore, the reliability of unilateral gait parameters was also calculated for the weakest and strongest leg, determined by a MVC knee extensor. The majority of pwMS showed an asymmetry in strength of more than 10%. Overall, parameters in most of the gait domains presented similar ICC values undependable of leg strength for the weakest and strongest leg compared to the average of both legs allowing future studies reporting the gait characteristics as preferred. Exceptions were in elevation at mid-swing and variability variables, which tend to differ between legs.
Clinical Implications and Future Research
In this study, we provide tools that might guide clinical practice and future research on walking fatigability in pwMS. The cut-off values are extremely important for the definition of what is considered (ab)normal. It might guide decision-making in which treatment is the most appropriate. Specifically, for walking fatigability, it may guide for a tailored rehabilitation depending on which gait domain is being abnormally affected. For example, a patient presenting abnormal deviations in rhythm, variability, or coordination gait domains toward the end of the 6MWT might require a rehabilitation program to recover walking automaticity 52 or the use of supplementary strategies, for example, music therapy or transcranial direct current stimulation, to improve brain capacity to respond to higher efforts. 53 Also, find the clinical importance and how pwMS perceived their walking related to changes in the gait characteristics, as well as changes after rehabilitation programs, should be investigated.
The walking fatigability indexes at the ICF body function (gait parameters) and activity (DWI6-1) do complement current traditional walking tests, providing metrics of speed (m/s) and endurance (m). It is recommended to apply these when persons with MS indicate changes in gait in daily life or when interventions aim to improve daily life physical activity. However, it is acknowledged that the ecological validity of the fatigability indexes needs further validation by investigating their relation with daily life physical activity and perceived gait abilities.
Our study also opens avenues to investigate the participation level of the ICF and the relationship with walking fatigability in the activity and body function level. It is known that reduced walking capacity is related to less participation in pwMS 54 and that they expend more energy and time to perform walking activities in daily life situations. 55 Also, expending more energy in daily life has been partially attributed to gait impairments in pwMS. 56 Therefore, the worsening of gait characteristics, mainly for those presenting abnormal changes toward the end of the 6MWT, could be related to the higher cost of walking, which might be lead to less participation.
Limitations
This study is not without its limitations. First, asking about the perception of effort may have given an idea of how much time they still had to perform the test, and therefore, they may have paced themselves. 57 Second, the straight-line 6MWT with 180° turning at both extremities, compared with a continuous 6MWT, and the different corridor lengths presented in each testing site (ranging from 25 to 30 m) may have impacted gait characteristics and their changes by involving deceleration, turning, and acceleration again, 57 which are challenging for more disabled patients. However, since daily life walking requires turning and changing directions, we believe that the 6MWT with turning may better represent daily life situations. Also, the gait characteristics measurement excluded the turns as well as some steps before and after the turns, minimizing their possible effects (deceleration and acceleration). Moreover, the participants repeated the 6MWT on day 2 at the same location and thus the same walking trajectory as day 1 and the 6MWT performed in our study is highly recommended and standardized for pwMS. 34 One may argue that the first minute of the 6MWT has more variability given the adaptation in the test and, therefore, is less stable compared to the second minute and may not be used to identify motor fatigability in pwMS.44,58 Nevertheless, our results showed good to excellent reliability for gait characteristics in minute 1, which may address this issue raised elsewhere. Finally, we did not include all possible gait characteristics for all gait domains (eg, intra/inter-limb coordination or dynamic control asymmetry) or the calculation of the Lye in all possible planes (anteroposterior, medial-lateral, and vertical), which can give extra information on walking fatigability. 59 Therefore, future studies are encouraged to do so.
Conclusion
Gait characteristics, measured minute-by-minute, are re-peatable and consistent between the test/retest sessions. This finding was observed for all gait domains and variables, giving insights for use in clinical practice and clinical trials. In addition, changes in gait characteristics of pwMS are repeatable in all gait domains, ranging from moderate to good reliability; however, not all variables presented the same reliability. The learning effect that the 6MWT might induce and the higher variability produced by the fatigability index may account for the lower reliability observed in the changes in gait characteristics. In sum, our results on reliability and cut-off score of fatigability indexes during the 6MWT provide valuable information for researchers and clinicians to investigate changes in gait characteristics during the 6MWT in various gait domains in clinical trials and clinical practice.
Footnotes
Acknowledgements
The authors would like to thank all the participants and clinical MS centers of the study for participation, the research foundations for their financial support (Research Foundation—Flanders, MS LIGA Flanders, and the King Beaudouin foundation), and the physiotherapy master students of the University of Hasselt in assisting with data collection.
Author Contributions
Felipe Balistieri Santinelli: Conceptualization; Data curation; Formal analysis; Funding acquisition; Investigation; Methodology; Writing—original draft; Writing—review & editing. Cintia Ramari: Conceptualization; Funding acquisition; Methodology; Resources; Supervision; Visualization; Writing—review & editing. Marie Poncelet: Data curation; Formal analysis; Writing—review & editing. Deborah Severijns: Formal analysis; Writing—review & editing. Daphne Kos: Investigation; Writing—review & editing. Massimiliano Pau: Investigation; Visualization; Writing—review & editing. Alon Kalron: Data curation; Visualization; Writing—review & editing. Pieter Meyns: Conceptualization; Formal analysis; Funding acquisition; Methodology; Supervision; Visualization; Writing—review & editing. Peter Feys: Conceptualization; Funding acquisition; Investigation; Methodology; Project administration; Resources; Supervision; Visualization; Writing—original draft; Writing—review & editing.
Data availability
The data used and which support the findings of the present study are available through the corresponding author upon request.
Declaration of Conflicting Interests
The author(s) declared no potential conflicts of interest with respect to the research, authorship, and/or publication of this article.
Funding
The author(s) disclosed receipt of the following financial support for the research, authorship, and/or publication of this article: This study was supported by Research Foundation - Flanders (#11O5823N), the MS LIGA Flanders (steunfonds), and the King Beaudouin foundation (fundClaire Fauconnier).
Supplementary material for this article is available on the Neurorehabilitation & Neural Repair website along with the online version of this article.
References
Supplementary Material
Please find the following supplemental material available below.
For Open Access articles published under a Creative Commons License, all supplemental material carries the same license as the article it is associated with.
For non-Open Access articles published, all supplemental material carries a non-exclusive license, and permission requests for re-use of supplemental material or any part of supplemental material shall be sent directly to the copyright owner as specified in the copyright notice associated with the article.