
Abstract
Background. In the general population, trajectories of walking capacity is accelerated and nonlinear with advanced age. Whether this is more pronounced in persons with multiple sclerosis (pwMS), along with the prevalence of dismobility (ie, slow gait speed), are currently unknown. Our objective was to investigate trajectories of walking capacity and prevalence of dismobility across the adult life span in pwMS versus healthy controls (HC). Methods. Data on maximal timed 25-foot walk test (T25FWT), 2-minute walk test (2MWT), and 6-minute walk test (6MWT) along with prevalence of dismobility were assembled from 2 RIMS multicenter studies (n = 502 pwMS; age range 21-77 years, 6 age groups: 20-29, 30-39, 40-49, 50-59, 60-69, and 70-79 years). HC data were extracted from studies containing normative reference values (n = 1070-3780 HC). Results. Age trajectories of walking capacity was nonlinear and accelerated in pwMS versus HC. While measures of walking capacity in pwMS were suppressed already early in life, the gap between pwMS and HC significantly widened across the 6 age groups (pwMS performed 64%, 70%, 57%, 59%, 51%, and 37% of HC, respectively). This coincided with high prevalences of dismobility in pwMS across the 6 age groups when using usual gait speed cut-point values <1.0 m/s (corresponding to 33%, 32%, 51%, 59%, 75%, and 100%) and <0.6 m/s (corresponding to 19%, 12%, 26%, 23%, 33%, and 43%), markedly exceeding that observed in HC. Conclusion. The present data on walking capacity provide evidence for an accelerated deterioration in pwMS with advanced age, coinciding with high prevalences of dismobility (ie, slow gait speed).
Introduction
Life expectancy has increased markedly in persons with multiple sclerosis (pwMS) over the past 20 to 30 years,1,2 which—due to drops in mortality rates 1 —is achieved in part through medical advances and lifestyle changes. The gap in life expectancy of pwMS in comparison with the general population is currently 6 to 10 years.2,3 Consequently, almost a third of all pwMS are 60 years or older1,4-6—a number estimated to increase markedly during the coming decades. 5
In the general population, deterioration of bodily functions accelerates from the sixth/seventh decade onward (ie, following a nonlinear trajectory), particularly in physical function (eg, walking capacity).7-10 Because of the pathology of MS comprising inflammation and neurodegeneration most often presents early in the adult life, physical (and cognitive) function will, for the majority of pwMS, already be markedly suppressed when they reach the sixth/seventh decade. Nonetheless, very limited evidence exists on trajectories of physical (and cognitive) function in pwMS across the adult life span. In a cross-sectional study with participants divided into 5 different age groups, Bodling et al 11 reported a comparable decline in cognitive function (processing speed) in pwMS (n = 245) and healthy controls (HC) (n = 188). In a recent large-scale cross-sectional study, Roy et al 12 also reported a comparable decline in cognitive function (memory and processing speed) in pwMS (n = 698) and HC (n = 226), while a steeper decline in physical function (upper and lower extremity motor function) was observed in pwMS compared with HC. However, the data by Roy and colleagues were presented and analyzed according to linear regression models, that is, with linear changes in measures of cognitive and physical function, which may not be ideal in order to capture the nonlinear trajectories that likely occur with advanced age.
Interestingly, lower extremity physical function (eg, walking capacity) in pwMS may be particularly vulnerable due to the pathology of MS (with lower extremity motor function being more affected than upper extremity motor function). 13 This is supported by survey data reporting patient perspectives, 14 which also coincide with pwMS reporting walking capacity among the most (if not the most) important bodily functions. 15 In pwMS, walking capacity has most often been examined objectively by short distance (eg, timed 25 foot maximal walk test [T25FWT]) and increasingly also by long-distance walk tests (eg, 2-minute and 6-minute maximal walk tests—2MWT and 6MWT, respectively), with the latter argued to be the most reliable, responsive, and the least variable.16,17 Moreover, as long-distance walk tests inherently assess walking endurance, these tests are viewed superior in terms of capturing motor fatigability.18,19 In aging research, objectively assessed walking capacity (eg, short- or long-distance walk tests, often reported as gait speed) have long been viewed be among the most important clinical measures.20,21 Indeed, slow gait speed derived from both short- and long-distance walk tests is a robust predictor of disability, morbidity, and mortality in older adults.21-23 The importance of examining lower extremity physical function in pwMS, is further emphasized by studies indicating that deterioration hereof precede deterioration of cognitive function. 14
Understanding age trajectories of physical function in pwMS is a prerequisite for designing optimal rehabilitative and preventive interventions. In 2 previous multicenter studies performed within the European Rehabilitation in MS network (RIMS, www.eurims.org), data on walking capacity was collected across the adult life span in pwMS. Consequently, we performed secondary analyses on pooled data from these multicenter studies aiming to (1) investigate trajectories of walking capacity with advanced age in pwMS and (2) compare these with published large-scale normative data from healthy controls (HC). Because of the apparently combined and perhaps even synergistic deleterious effects of aging and MS, it was hypothesized that pwMS would show an earlier and accelerated nonlinear deterioration of walking capacity when compared with HC.
Methods
Study Design and Participants
The present study is cross-sectional, comparing walking capacity between pwMS and HC across different age groups (ie, covering the adult life span). Data on HC representing the general population was extracted from previously published studies on normative reference values (see below). Data on pwMS was assembled from 2 multicenter studies performed within the RIMS network (n = 502 pwMS, 19 MS centers located across 11 countries), as previously described in detail.24-26 Briefly, subjects had a diagnosis of MS according to the McDonald criteria, and an Expanded Disability Status Scale (EDSS) score ≤6.5, as determined by the neurologist at participating sites. Subjects had not experienced an exacerbation in the month prior to testing, and had no other medical conditions interfering with walking. The study was conducted in accordance with the Declaration of Helsinki and approved by the Ethics Committee at Hasselt University (leading site) as well as by the local ethical committees. All subjects gave written informed consent.
Outcome Measures
For walking capacity, pwMS were assessed on the timed maximal 25-foot walk test (T25FWT, m/s), 2-minute maximal walk test (2MWT, m), and 6-minute maximal walk test (6MWT, m). The 12-item MS Walking Scale (MSWS-12) was used to record the patient-reported impact of MS on walking ability. For comparison, normative reference values for HC comprised maximal T25FWT (m/s),27,28 maximal 2MWT (m), 29 and maximal 6MWT (m).30,31 Of note, the study by Bohannon and Wang 28 measured maximal gait speed by using a 4-m distance. To make these data comparable to the maximal T25FWT (=7.62 m) data collected in the present study, a conversion formula was used (T25FWT gait speed = (1.241 × 4-m gait speed) − 0.148; with T25FWT and 4-m gait being strongly associated (R2 = 0.97)) based on a cohort of 78 healthy individuals with concurrent 4- and 7.62-m walks (7.62-m gait speed range: 0.73-2.12 m/s) (unpublished data).
To capture the prevalence of dismobility (assessed according to short distance usual gait speed <1.00 m/s or <0.60 m/s, with these cut-points indicating risk and high risk of adverse health outcomes, respectively),20,32 we calculated the percentage of pwMS having short distance usual gait speed below these cut points. Of note, these data were obtained from usual T25FWT (=7.62 m) or 10-meter walk test available in a subset of pwMS participating in the 2 multicenter studies (usual gait speed data were available in n = 463 pwMS only, corresponding to 92% of the total sample of pwMS). To illustrate whether the prevalence of dismobility in pwMS was accelerated with advanced age, comparisons were made to published data from the general population (National Health and Nutrition Examination Survey [NHANES]) on prevalence of dismobility based on short distance usual gait speed in HC aged 50 years and older. 20
Data Analysis
HC and pwMS participants were divided into age groups for analysis (20-29, 30-39, 40-49, 50-59, 60-69, 70-79, and 80-89 years), with data presented as gender-weighted mean ± SD in tables and gender-weighted mean ± SE in figures unless otherwise stated. As HC data on T25FWT and 6MWT, respectively, were merged from 2 studies, these were furthermore weighted according to participant numbers in these studies across age groups. Gender-weighted means were calculated by adding the product of number of males × mean of male outcome to the product of number of females × mean of female outcome, and then dividing it by the total number of males and females. The same principle was applied for participant number-weighted means. A 2-way analysis of variance was carried out to examine differences in measures of walking capacity between HC and pwMS across the different age groups (age × group interaction, main outcome). From this, the separate effects of age and group, respectively, were also examined. The differences in measures of walking capacity between HC and pwMS (group effect) are furthermore displayed as percentage differences and effect sizes (Cohen’s d; small = 0.20, moderate = 0.50, large = 0.80). To examine differences in chronological age, weight, height, body mass index, EDSS, disease duration, and MSWS-12 in pwMS across the different age groups (age effect), a 1-way analysis of variance was performed. To examine differences in MS type proportion (ie, relapse remitting [RR], secondary progressive [SP], and primary progressive [PP]) across the different age groups (age effect), a chi-square test was performed. To examine differences in prevalence of dismobility between HC and pwMS across the different age groups (age effect, group effect), a chi-square test was performed. The underlying assumptions for undertaking the chosen analyses were met (ie, all variables were normally distributed). All statistical analyses were performed using GraphPad Prism 7.0 (GraphPad Software, La Jolla, CA, USA, www.graphpad.com). Corrections for multiple comparisons (Tukey test) were made for all 2- and 1-way analyses. The level of significance was set at P < .05.
Results
MS Patient Characteristics
In pwMS, we observed a significant (P < .05) age effect for EDSS, disease duration, MS type proportion, and MSWS-12. Specifically, EDSS, disease duration, and MSWS-12 increased along with a RR-to-SP-to-PP shift when going from younger-to-older age groups (Tables 1 and 2).
pwMS Characteristics. a
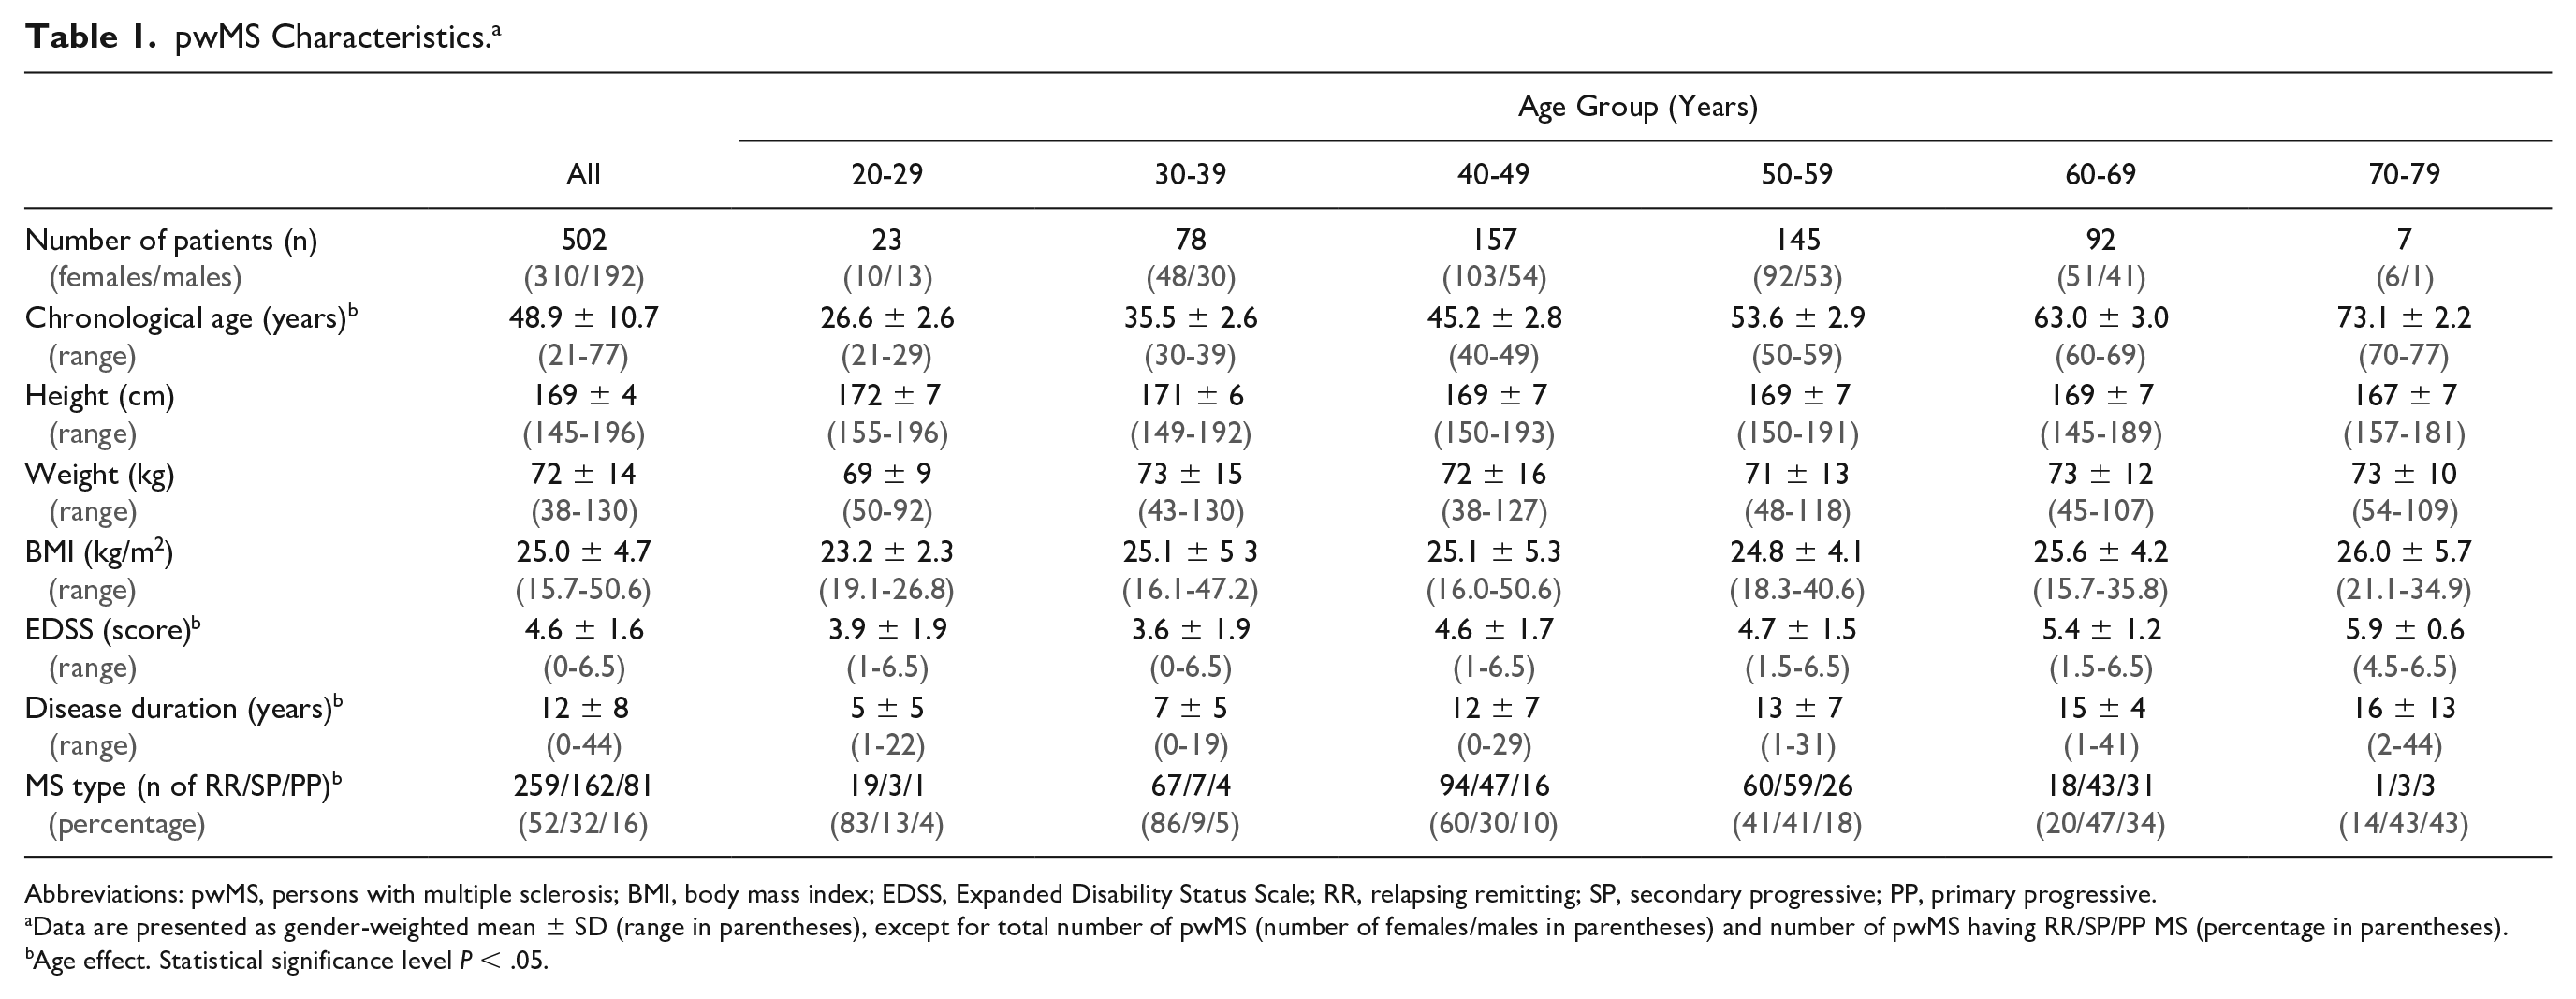
Abbreviations: pwMS, persons with multiple sclerosis; BMI, body mass index; EDSS, Expanded Disability Status Scale; RR, relapsing remitting; SP, secondary progressive; PP, primary progressive.
Data are presented as gender-weighted mean ± SD (range in parentheses), except for total number of pwMS (number of females/males in parentheses) and number of pwMS having RR/SP/PP MS (percentage in parentheses).
Age effect. Statistical significance level P < .05.
Walking Capacity and Ability in pwMS and HC. a
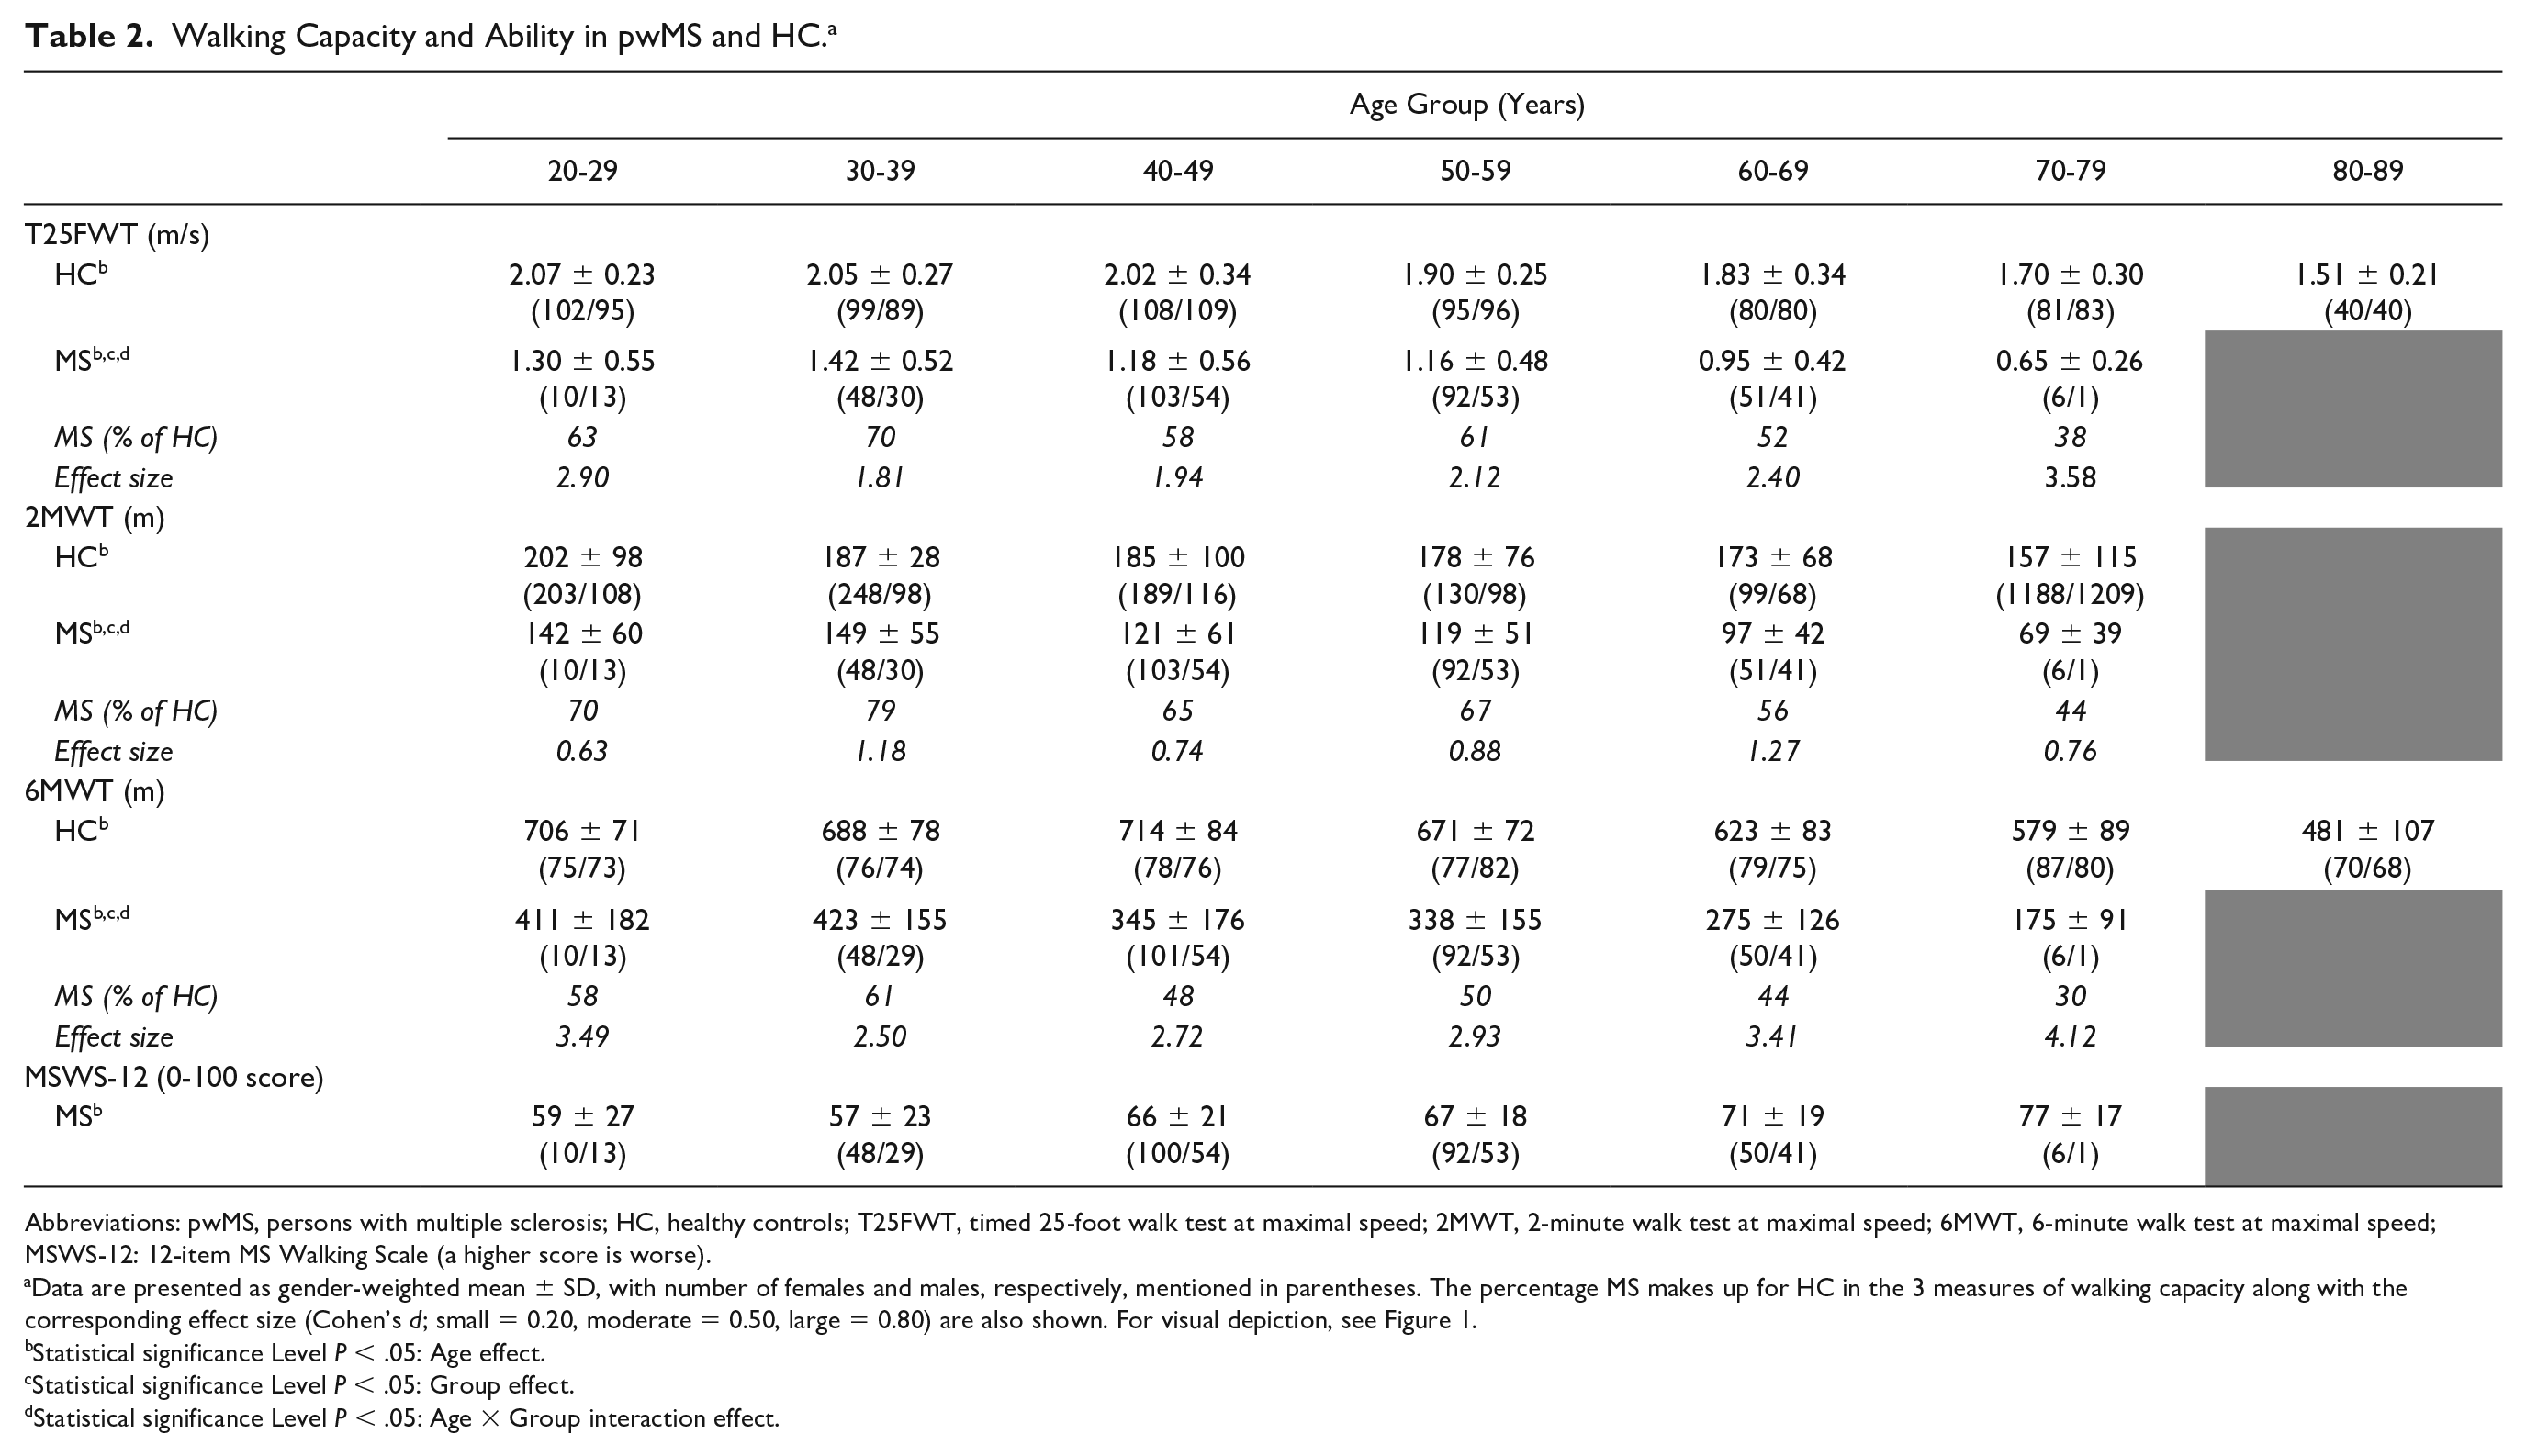
Abbreviations: pwMS, persons with multiple sclerosis; HC, healthy controls; T25FWT, timed 25-foot walk test at maximal speed; 2MWT, 2-minute walk test at maximal speed; 6MWT, 6-minute walk test at maximal speed; MSWS-12: 12-item MS Walking Scale (a higher score is worse).
Data are presented as gender-weighted mean ± SD, with number of females and males, respectively, mentioned in parentheses. The percentage MS makes up for HC in the 3 measures of walking capacity along with the corresponding effect size (Cohen’s d; small = 0.20, moderate = 0.50, large = 0.80) are also shown. For visual depiction, see Figure 1.
Statistical significance Level P < .05: Age effect.
Statistical significance Level P < .05: Group effect.
Statistical significance Level P < .05: Age × Group interaction effect.
Walking Capacity
For all 3 measures of walking capacity, we observed a significant (P < .05) age effect (overall as well as within HC and pwMS, respectively) and group effect (overall as well as within all age groups, respectively) (Table 2, Figure 1). More important, a significant (P < .05) age × group interaction was observed, that is, with an accelerated deterioration of maximal T25FWT, 2MWT, and 6MWT performance observed in pwMS when compared with HC (Table 2, Figure 1). As shown in Table 2 and visualized in Figure 1, the gap (group effect) in walking capacity (average of all three measures) between pwMS and HC was significantly widened across age groups (20-29 years, 64% of HC; 30-39 years, 70% of HC; 40-49 years, 57% of HC; 50-59 years, 59% of HC; 60-69 years, 51% of HC; 70-79 years, 37% of HC).
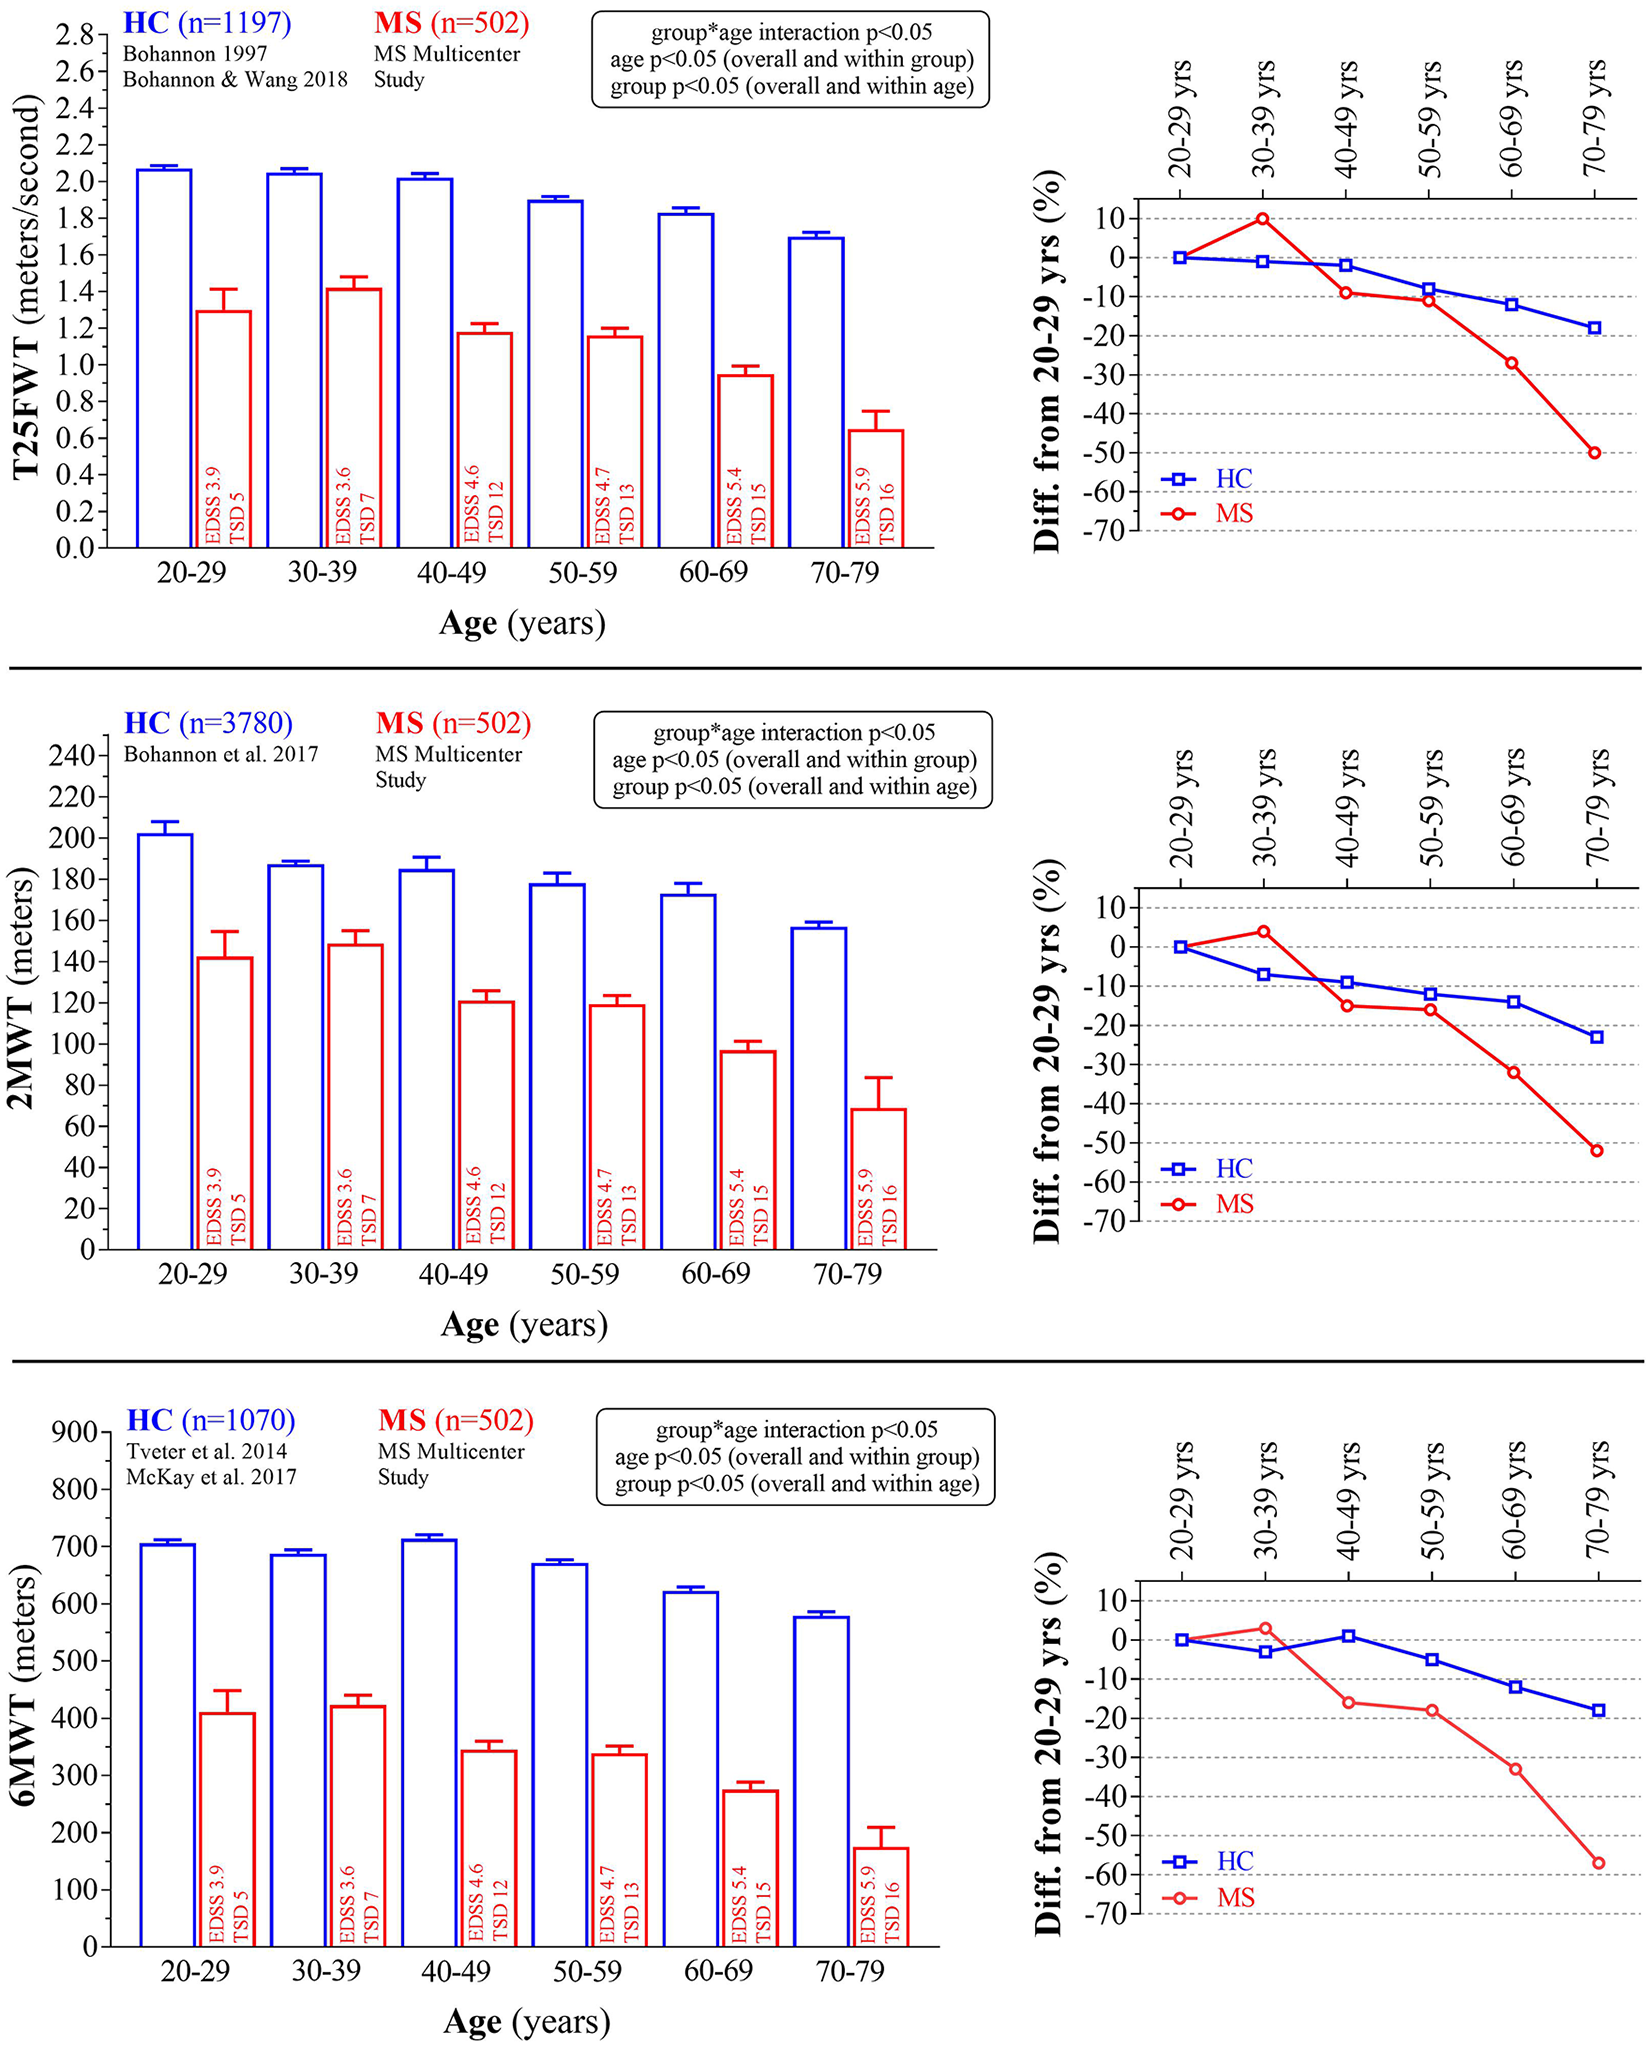
Absolute and relative (to 20-29 years) walking capacity across the adult life span (age groups) in pwMS (red bars and lines) and HC (blue bars and lines, retrieved from published normative data). Information on EDSS score and time since diagnosis (TSD) are displayed for each pwMS age group. For exact values, see Table 2. pwMS, persons with multiple sclerosis; HC, healthy controls; EDSS, Expanded Disability Status Scale; T25FWT, timed maximal 25-foot walk test; 2MWT, 2-minute maximal walk test; 6MWT: 6-minute maximal walk test. Data are presented as gender-weighted mean ± SE.
Prevalence of Dismobility
As visualized in Figure 2, the prevalence of pwMS having dismobility (ie, slow gait speed) corresponded to 33.3% in 20-29 years, 31.5% in 30-39 years, 51.4% in 40-49 years, 59.2% in 50-59 years (vs 26.0% in HC), 75.0% in 60-69 years (vs 38.3% in HC), and 100.0% in 70-79 years (vs 58.6% in HC), when using a usual gait speed cut-point value of <1.0 m/s, and to 19.0% in 20-29 years, 12.3% in 30-39 years, 25.7% in 40-49 years, 23.1% in 50-59 years (vs 0.9% in HC), 33.0% in 60-69 years (vs 5.0% in HC), and 42.9% in 70-79 years (vs 11.4% in HC), when using a usual gait speed cut-point value of <0.6 m/s. Overall, prevalences of dismobility in pwMS exceeded that observed in HC (P < .05, group effect), and increased (P < .05) from 20-39 to 40-59 years, from 40-59 to 60-69 years, and from 60-69 years to 70-79 years in pwMS (age effect).
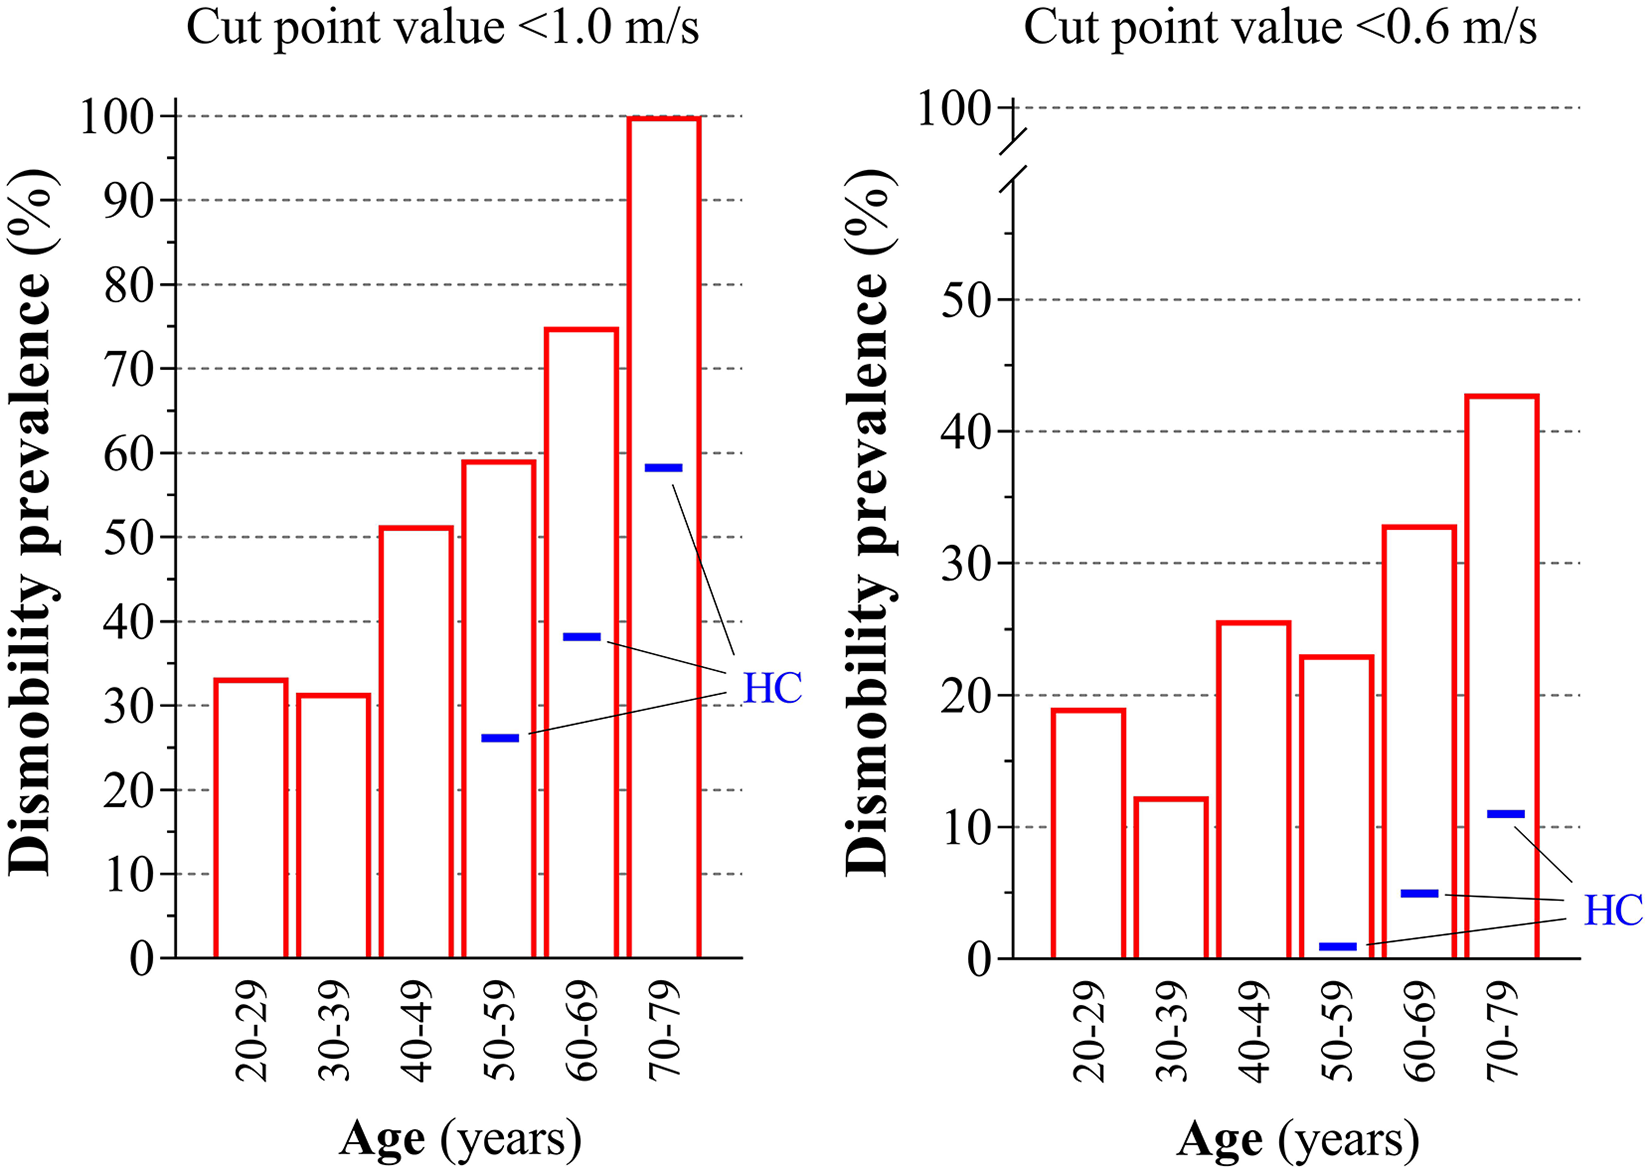
Prevalence of dismobility in persons with multiple sclerosis (pwMS) according to a short distance usual gait speed cut-point value <1.0 m/s and <0.6 m/s, respectively, as proposed by Cummings et al. 20 Usual gait speed data (timed 25-foot walk test, T25FWT [=7.62 m] or 10-m walk test) is available in a subset of pwMS (n = 463, red bars) participating in the study (20-29 years, 1.06 ± 0.46 m/s, n = 10/11 females/males; 30-39 years, 1.11 ± 0.37 m/s, n = 45/28; 40-49 years, 0.93 ± 0.44 m/s, n = 95/49; 50-59 years, 0.90 ± 0.36 m/s, n = 84/46; 60-69 years, 0.78 ± 0.32 m/s, n = 49/39, 70-79 years, 0.56 ± 0.21 m/s, n = 6/1). Data are presented as gender-weighted mean ± SE. The blue thickened lines denote gender-weighted mean values for healthy controls (HC) 50-59 years (n = 599), 60-69 years (n = 625), and 70-79 years (n = 474) (retrieved from published normative data [NHANES], also based on short distance usual gait speed). 20
Discussion
The present study provides novel data, showing that trajectories of walking capacity is nonlinear and accelerated with advanced age in pwMS compared with HC. While the T25FWT, 2MWT, and 6MWT were markedly suppressed in pwMS compared with HC in all age groups, the gap was significantly widened from the fifth decade onward. As a consequence, the prevalence of pwMS having dismobility (ie, having usual gait speeds <0.60 and <1.00 m/s) was markedly elevated in pwMS compared with HC. The deterioration of walking capacity in pwMS across the adult life span was paralleled by patient-reported impact of MS on walking ability.
Inherently, higher age (>45 years) is associated with a higher risk of disability progression. 33 Yet, only 1 study previously has examined how walking capacity changes in pwMS compared with HC across the adult life span. Roy et al 12 reported a steeper linear decline in T25FWT (and in 9-hole peg test) in pwMS compared with HC. If we carry out similar linear trend analyses, a steeper linear decline in T25FWT (and in 2MWT and 6MWT, data not shown) was indeed also observed in pwMS compared with HC (slope steepness −0.13 ± 0.03 vs −0.08 ± 0.01, P < .05; corresponding to absolute declines 0.13 and 0.08 m/s, respectively, in maximal T25FWT gait speed per decade). However, while the data from Roy and colleagues overall correspond with the findings of the present study, presenting and analyzing data according to linear regression models (ie, with linear changes in measures of physical function) may not be ideal in order to capture the nonlinear and accelerated deterioration of physical function (eg, walking capacity) reported to occur in HC from the sixth/seventh decade onward.7-10 This was clearly evident from the gap between pwMS and HC in all 3 measures of walking capacity being widened across age groups, particularly from the fifth decade and onward. As illustrated in Figure 1 (and by data in Table 2), it appears that the trajectory of 6MWT (and partly 2MWT) are slightly more accelerated than the trajectory of T25FWT. This observation thus support the notion that long-distance walk tests—in addition to capturing walking capacity alone—also captures motor fatigability in pwMS.18,19 Indeed, walking-related fatigability has been shown to be much more prevalent in pwMS having higher versus lower EDSS scores, 19 as seen in the age groups 20-39 versus 40-59 versus 60-79 years, respectively.
While no previous studies have reported prevalence of dismobility (ie, mobility limitations according to well-established clinically relevant gait speed cut-point values20,21) in older pwMS, the high numbers we report here, emphasizes the “dismobility-associated” challenges this population is facing. The latter specifically concerns an elevated risk of future disability, morbidity, and mortality.21-23
The pathology of MS likely plays a role in explaining the observed nonlinear and accelerated deterioration of walking capacity with advanced age in pwMS compared with HC, that is, displaying combined or even synergistic deleterious effects of aging and MS, with brain atrophy being an obvious mechanism to look into. A recent retrospective follow-up study reported an acceleration of brain atrophy with advanced age—yet similar trajectories—in pwMS and HC. 34 Of note, pwMS had consistently lower brain volume compared to HC in all age groups examined. 34 The latter appear to fit well with the “brain reserve” theory, that is, with individuals having higher brain volumes reaching critical thresholds associated with physical disability progression (eg, walking capacity) later than individuals having lower brain volumes. 35 This may potentially also be an explanatory factor for the greater deterioration of walking capacity in progressive versus relapse remitting pwMS, 26 as the former has greater annualized brain volume loss compared with the latter. 36 This notion appears well aligned with the observation of a RR-to-SP-to-PP shift when going from younger-to-older age groups in the present study. Future studies should examine these aspects in older pwMS, alongside the influence of lifestyle factors such as physical activity and diet.
A number of methodological considerations of the study deserve mentioning. The main strength is the large overall sample sizes of both pwMS and HC across the adult life span (except for the small number of pwMS in 20-29 and 70-79 years, respectively), along with the comprehensive testing of walking capacity (comprising short and long distances). The main limitation is the cross-sectional study design, which contain several sub-optimal aspects possibly affecting the results and interpretation. First, the comparison of two groups having different life expectancy (6-10 years shorter in pwMS vs HC2,3) introduce bias when comparing fixed age groups. The trajectories of walking capacity had likely been more similar between pwMS and HC, had chronological age been normalized to life expectancy. However, by assuming the life expectancy gap to be 10 years, the reduction in 6MWT from 70-79 to 80-89 years in HC was still smaller than that observed from 60-69 to 70-79 in pwMS (17% vs 32%, respectively, see Table 2). This supports our data interpretation and conclusion. Second, our choice of using normative reference values for HC may limit the direct comparison to the enrolled pwMS (eg, HC were not limited to European participants). This was done to have large HC sample sizes for T25FWT (n = 1197),27,28 2MWT (n = 3780), 29 and 6MWT (n = 1070),30,31 thereby ensuring robust data and broad external validity. Third, the enrolled MS patients (age mean 49.0 years [range 21-77]; EDSS median 5.0 [range 0-6.5]) appear to be more disabled (based on EDSS scores) than that observed in the average population of pwMS,4,37 whereas the opposite seem to be the case for the MS patients enrolled in the studies by Bodling et al 11 (age mean 45.1 years [range 18-74]; EDSS median 3.5 [range 1-8]) 11 and by Roy et al 12 (age mean 45.0 years [range 29-71]; EDSS median 2.5 [range 0-7.5]). 12 Another limitation concerns the fact that the enrolled MS patient had not experienced disease exacerbation (ie, relapse(s)) 1 month prior to assessment of walking capacity. This period may not have been sufficiently long to exclude the possibility that walking capacity in some participants (particularly in younger age groups containing higher proportions of relapse remitting MS patients) may have been affected at the time of assessment, by previous relapsing activity. Consequently, the present findings may wrongly overestimate the difference to HC to some extent when compared to the general population.
In a clinical perspective, understanding trajectories of walking capacity and prevalence of dismobility across the adult lifespan in pwMS is a prerequisite for designing optimal preventive and rehabilitative interventions, as well as the interpretation of the effectiveness hereof. For example, if an intervention can partly reduce deterioration of walking capacity over weeks/months/years, it will (statistically) also reduce the risk of future adverse health outcomes. Since approximately one-third of all pwMS are 60 years or older1,4-6—a number estimated to increase markedly during the coming decades 5 —our interpretation of the present cross-sectional observational study findings point toward an enormous underrecognized current and future challenge for the health care system dealing with older pwMS. Yet, large-scale longitudinal observational studies are clearly warranted in order to further our understanding on how well baseline and/or changes in walking capacity can predict disability/disease progression in older pwMS (at the same time acknowledging the complexity between disability progression and disease worsening/activity 38 ). By assuming that baseline and/or longitudinal changes in walking capacity are a strong predictor of disability progression in pwMS—as has been shown in numerous aging studies20-23—we propose that assessment of walking capacity should be carried out on a regular basis (eg, annually) in older pwMS. The latter would serve as a simple screening tool to estimate risk and health status/prognosis (1) “here-and-now” and/or optimally (2) prospectively. Such information provides an opportunity for health professionals to discuss current health status, future prognosis, and potential treatment options with patients and their families. Ideally, this should be combined with other type of MS patient evaluations such as cognitive function and brain magnetic resonance imaging morphometry (particularly lesion accumulation 39 ), which are also known to be negatively affected early in life and onward deteriorate rapidly.11,34,40
Since older pwMS have few medical treatment opportunities, 41 which is partly caused by the majority having progressive MS (Table 1), nonmedical treatment strategies need to be identified and targeted for this group. Currently, we would recommend physical activity/exercise as the optimal choice, well known to elicit significant and clinically relevant improvements in physical function (eg, walking capacity) without any noticeable side effects. 42 We specifically propose high-intensity resistance training in combination with functional tasks, as this training modality has been proven highly effective in terms of eliciting improvements in walking capacity in younger/middle-aged pwMS43,44 and in older HC. 45 While this proposition may not be viable for those older pwMS that are severely disabled (ie, requiring assistance in ambulation), other modalities of physical activity/exercise appear promising. 46
Conclusion
The present data on walking capacity provide evidence for an accelerated deterioration in pwMS, presumably due to the combined/synergistic deleterious effects of aging and MS. Specifically, trajectories of walking capacity was nonlinear and accelerated in pwMS compared with HC across the adult life span. Furthermore, the prevalence of dismobility (= slow gait speed) was markedly elevated in pwMS compared with HC. Altogether, we interpret the deterioration of walking capacity in pwMS with advanced age as an underrecognized challenge within the MS rehabilitation and research area.
Footnotes
Acknowledgements
Declaration of Conflicting Interests
The author(s) declared the following potential conflicts of interest with respect to the research, authorship, and/or publication of this article: Lars G. Hvid has received travel grants and/or teaching honorary from Biogen and Sanofi Genzyme. Peter Feys serves as an editorial board member of Multiple Sclerosis Journal, a steering committee member of NeuroCompass, has participated and/or received honoraria in scientific meetings of Biogen, EXCEMED, and PARADIGMS, has received a restricted educational grant from Novartis to RIMS. Ilse Baert has received a restricted educational grant from Novartis to RIMS. Alon Kalron has received research support from Biogen and Merck Serono as well as teaching honoraria from Merck Serono. Ulrik Dalgas has received research support, travel grants and/or teaching honorary from Biogen, Merck Serono, Novartis, Bayer Schering and Sanofi Aventis as well as honoraria from serving on scientific meetings of Biogen and Sanofi Genzyme.
Funding
The author(s) disclosed receipt of the following financial support for the research, authorship, and/or publication of this article: This study was partially funded via an unrestricted educational grant from Novartis Pharma AG to Rehabilitation in Multiple Sclerosis, the European network for best practice and research in MS rehabilitation (![]() ).
).