
Abstract
Objective
To compare the effects of high-frequency (10 Hz) versus low-frequency (1 Hz) repetitive Transcranial Magnetic Stimulation (rTMS) on motor recovery and functional reorganization of the cortical motor network during the early phase of stroke.
Methods
Forty-six hospitalized, first-ever ischemic stroke patients in early stage (within two weeks) with upper limb motor deficits were recruited. They were randomly allocated to three groups with 10 Hz ipsilesional rTMS, 1 Hz contralesional rTMS, and sham rTMS of five daily session. All patients underwent motor function (Upper Extremity Fugl–Meyer), neurophysiological and resting-state functional Magnetic Resonance Imaging (fMRI) (rs-fMRI) assessments before and after rTMS intervention. Motor recovery (△Fugl–Meyer Assessment) was defined as motor function changes before and after rTMS intervention. Motor function assessment was reevaluated at time point of three month follow-up.
Results
The two real rTMS groups manifested greater motor improvements than the sham group. The effect sustained for at least 3 months after the end of the treatment sessions. Compared with the sham group, 10 Hz ipsilesional rTMS group presented increased resting-state functional connectivity (FC) between ipsilesional primary motor cortex (M1) and contralesional M1 (P = .007), whereas 1 Hz contralesional rTMS group presented increased FC between contralesional M1 and ipsilesional supplementary motor area (P = .010), which were positively correlated with motor recovery (P < .05).
Conclusion
Beneficial effect of rTMS on motor recovery might be underlaid by increased FC between stimulating site and the remote motor areas, highlighting the motor network reorganization mechanism of rTMS in early post-stroke phase.
Introduction
Stroke is the principal cause of adult long-term disability worldwide, 1 leaving more than 60% of stroke survivors with motor impairment sequelae. 2 Neuroplasticity induced by cortical reorganization is an important factor mediating motor function recovery, especially in the subsacute phase following stroke.3,4 Neuroimaging studies have revealed abnormal connectivity underlying motor deficit after stroke. 5 Therefore, the use of early interventions inducing plasticity to conditioning the pathological motor network configuration is significant for motor recovery from stroke.
Recently developed brain stimulation techniques, such as repetitive transcranial magnetic stimulation (rTMS), can be used to modify cortical excitability, and facilitate functional recovery after stroke in brain plasticity.6,7 Currently, there are two strategies of rTMS: high-frequency rTMS ( ≥ 3 Hz) enhancing cortical excitability and low-frequency rTMS ( < 1 Hz) exerting cortical inhibition. Studies have shown that rTMS on motor cortex could not only modulate local cortical excitability 8 but also increase connectivity to remote motor areas.8,9 Thereby plasticity-inducing rTMS might be useful to regulate motor network connectivity, which has been frequently decreased after stroke,10–12 to enhance motor function recovery.
However, the effects of different frequency rTMS (high-frequency vs low-frequency) on motor network reorganization at early phase of stroke have not been documented, and no evidence from randomized controlled trials with larger samples is available. Furthermore, very limited follow-up data on the long-term effects of rTMS intervention for stroke rehabilitation are available. 13
Therefore, we employed resting-state functional magnetic resonance imaging (rs-fMRI) to investigate whether and how high- and low-frequency rTMS modulate the cortical network connectivity during motor recovery processing in early post-stroke phase. We hypothesized that rTMS intervention of 10 Hz and 1 Hz frequencies in the ipsilesional/contralesional hemispheres, respectively, could be both enhance motor network connectivity underlying cerebral functional reorganization after stroke.
Methods
Patients
Sixty stroke patients with motor deficits were enrolled consecutively from the Department of Neurology, Jinling Hospital, Jiangsu Province, China. Inclusive criteria were: 1) first-ever ischemic stroke; 2) the first month within symptom onset (which was defined as “acute/subacute stroke periods”); 3) stroke lesions located within the middle cerebral artery (MCA) territory verified by MRI; 4) unilateral upper limb motor deficit. Exclusive criteria were: 1) hemorrhagic stroke; 2) having other underlying neurological diseases; 3) severe aphasia or cognitive impairment; 4) medication of antidepressants or benzodiazepines; and 5) having any contraindications to TMS and/or MRI.
This study was performed in accordance with The Code of Ethics of the World Medical Association (Declaration of Helsinki) and approved by the Internal Review Board of Jinling Hospital. All enrolled subjects gave written informed consent. This trial was registered at the Chinese Clinical Trial Registry (ChiCTR-IOR-14005394), and partial results of the program have been published in our previous study.
8
The participants' flowchart is shown in Figure 1. Consolidated standards of reporting trials flow diagram. rTMS, repetitive transcranial magnetic stimulation.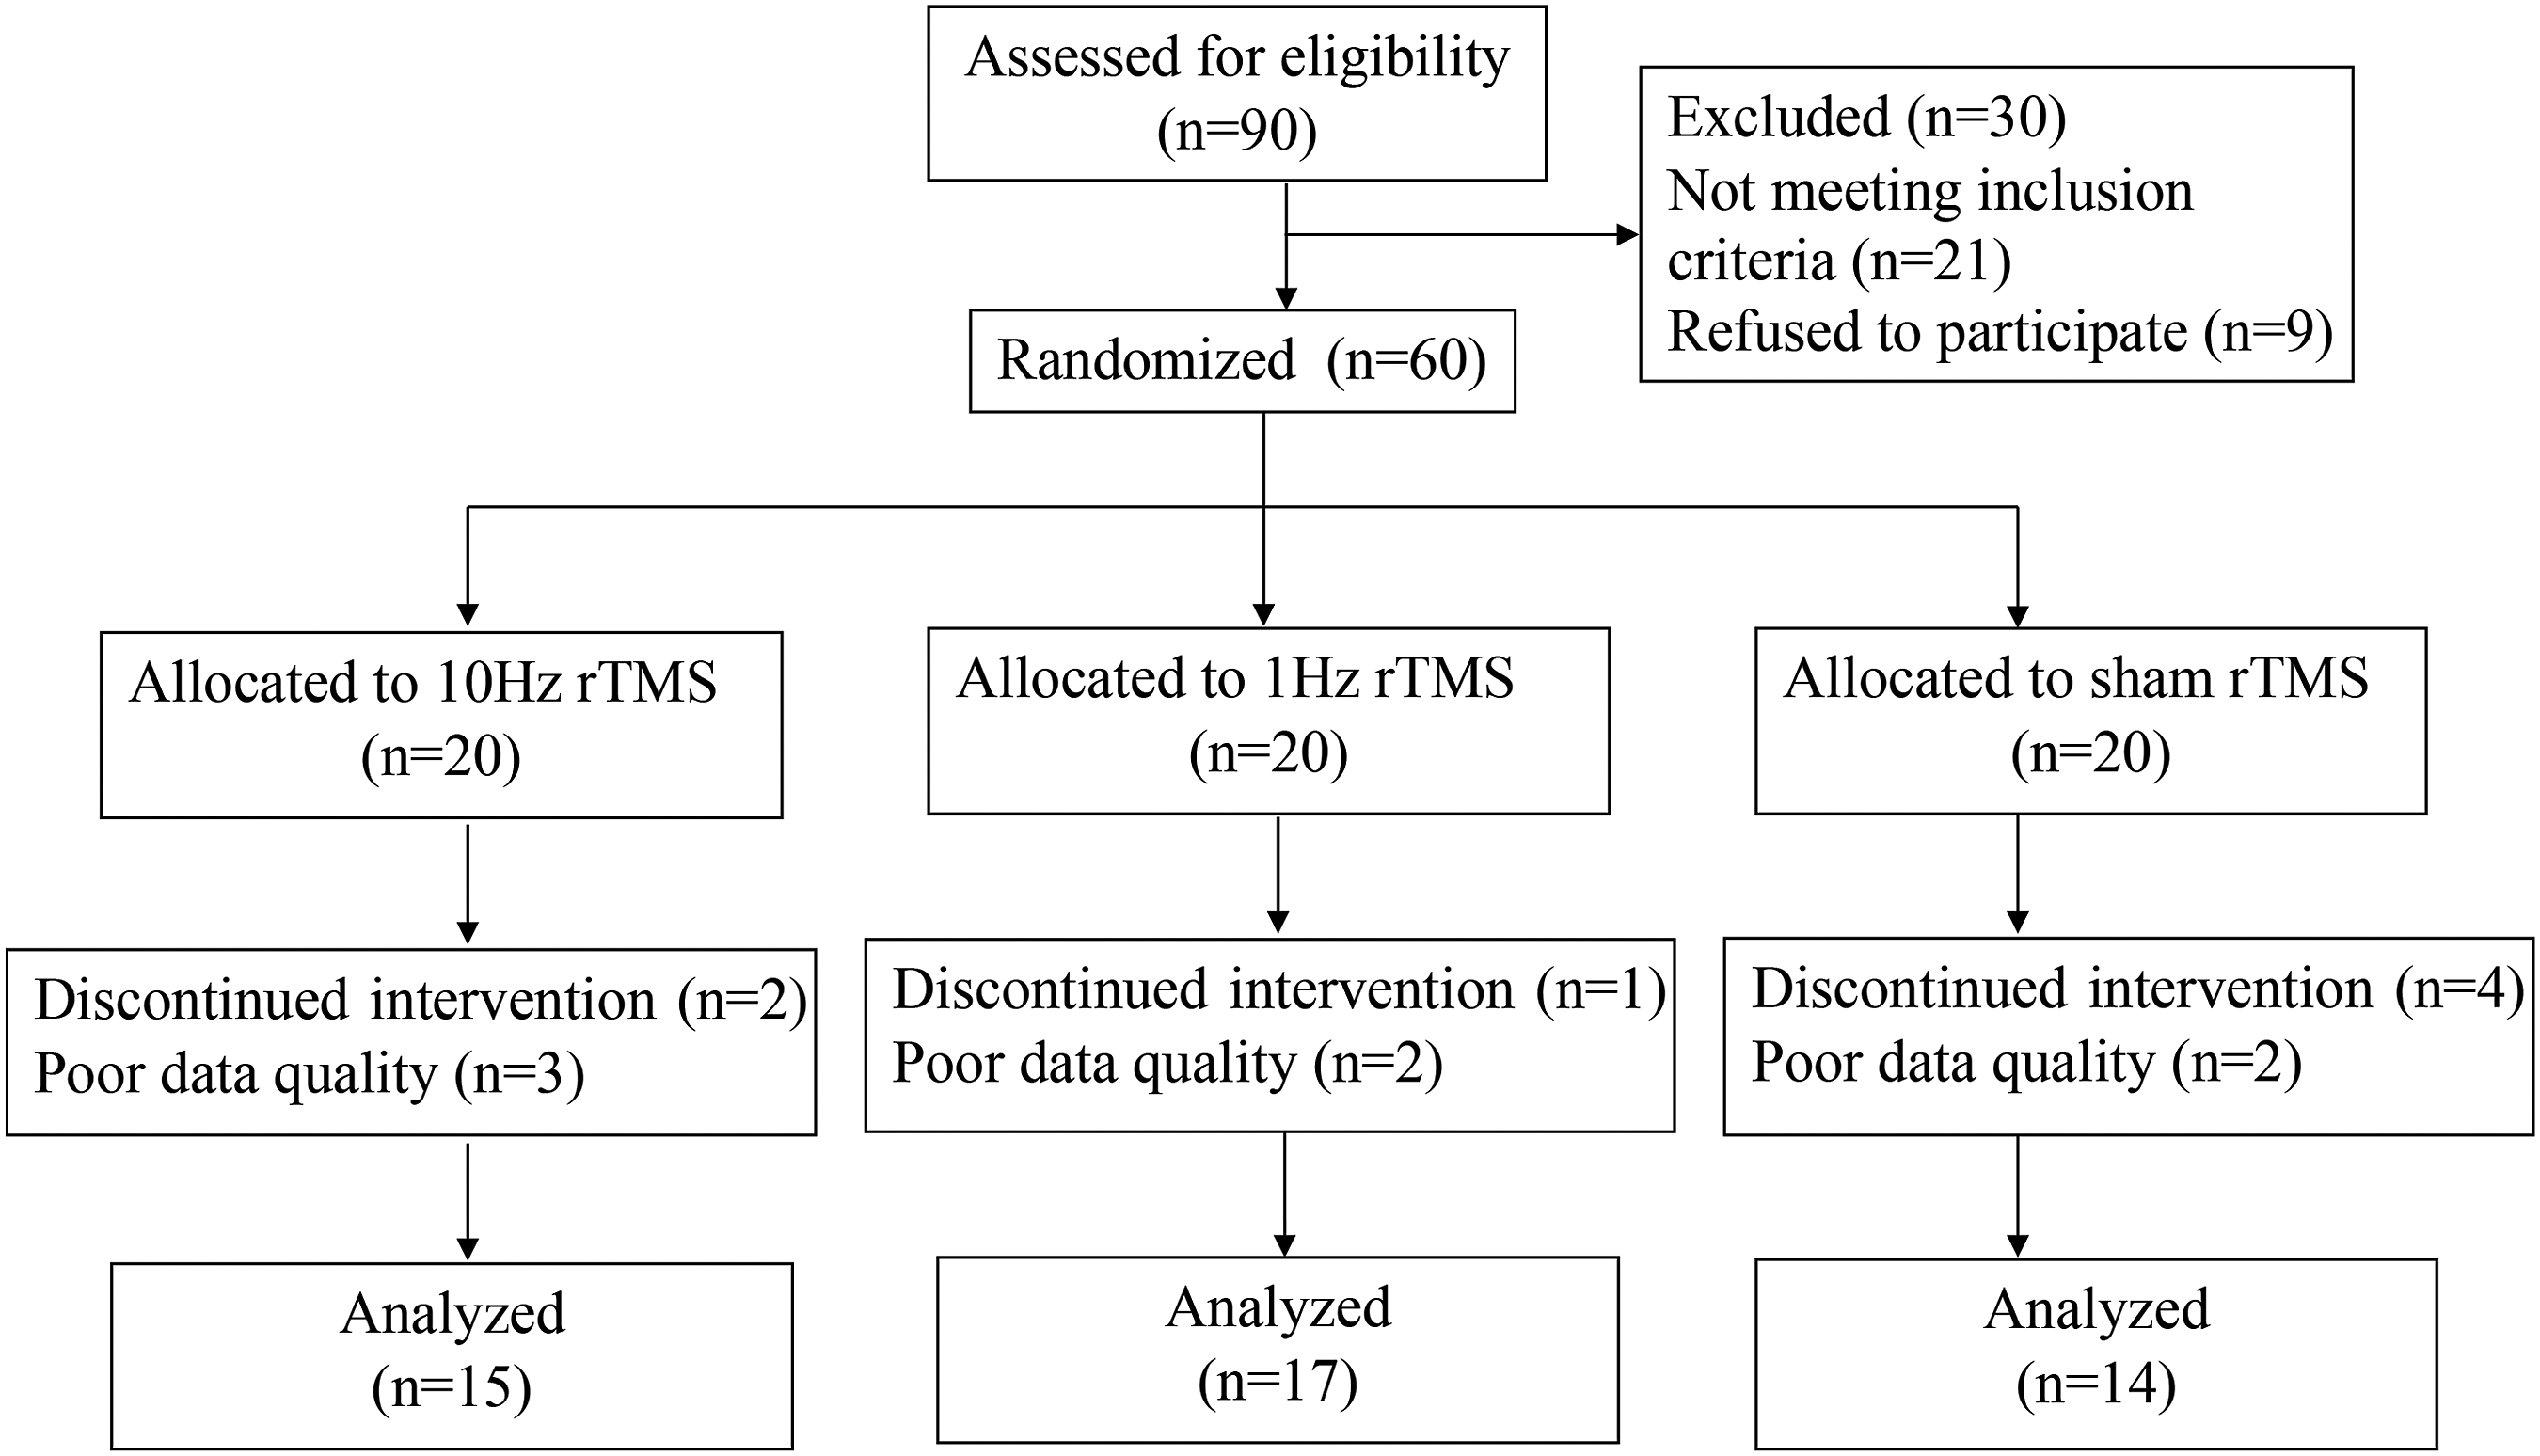
Study Design
The study was designed with a randomized, sham-controlled, double-blinded trail. The enrolled patients were randomly allocated to 1 of either: the high-frequency (HF, 10 Hz), the low-frequency (LF, 1 Hz) or the control (sham) rTMS groups. Treatment allocations were kept in sequentially numbered sealed opaque envelopes and opened only at the time of enrollment. All patients were blinded to treatment allocation. Motor function and resting-state fMRI were assessed at baseline and within 24 hours after completion of the rTMS intervention (post-intervention). Magnetic stimulation was performed by an investigator who was not involved in the clinical assessment, patient follow-up, or data analysis. Clinical measurements were evaluated by an experienced neurologist blinded to patients’ group allocation.
Clinical Assessments
Motor impairment was evaluated using the upper extremity Fugl–Meyer Assessment (FMA) 14 and the Medical Research Council (MRC) scale. 15 The primary outcome was measured using FMA score which ranges from 0 (complete hemiplegia) to a maximum of 66 points (normal motor performance) for the upper extremity. Motor recovery (△FMA) was defined as the difference FMA value before and after rTMS treatment. Stroke severity and activity limitation was determined using the National Institutes of Health Stroke Scale (NIHSS) 16 and Modified Rankin Scale (mRS). 17
Measurement of Cortical Excitability
Motor cortical excitability was evaluated by single pulse TMS in each hemisphere.18,19 Magnetic stimulation was performed using a Magpro 9100 stimulator (MagVenture Company, Farum, Denmark) with a figure-eight coil (outer diameter of 1 wing, 9 cm). We determined the optimal stimulation site (“hot spot”) where the largest motor-evoked potential (MEP) could be consistently elicited over the motor representation of the contralateral abductor pollicis brevis. Once the site was identified, it was marked on the scalp to ensure consistent coil placement. Neurophysiological assessments and subsequent intervention used the same “hot spot” (usually primary motor cortex, M1). Resting motor threshold (rMT) was defined as the minimal stimulus intensity that produced an MEP response of at least 50 μV amplitude with the target muscle at rest in at least 5 of 10 subsequent trials.
rTMS Intervention
The rTMS protocol was performed according to the recommendations of the International Federation of Clinical Neurophysiology. 19 Each patient received rTMS daily for 5 consecutive days. HF-rTMS group patients received rTMS as follows: 10 Hz for 4s per session, with a 40s interval between sessions, 30 sessions per treatment, totaling 1200 pulses at 100% rMT on M1 of the affected hemisphere. LF-rTMS group patients received rTMS as follows: 1 Hz for 120 s per session, with a 40s interval between sessions, 10 sessions per treatment, totaling 1200 pulses at 100% rMT on M1 of the unaffected hemisphere. The sham group received rTMS with the same parameters (noise, time, and frequency) as the 1 Hz rTMS group on M1 of the unaffected hemisphere but with the coil rotated 90° away from the scalp so that no current was induced.
All patients underwent the standardized physiotherapy protocol (1 hour each daily) after rTMS for 5 consecutive days: active and passive motor exercises of the affected extremity, which was conducted by a specialized therapist. Medical therapy consisted of standard anti-platelet, statin, anti-coagulation, and anti-hypertensive treatments.
MRI Data Acquisition
All MRI data were obtained on a 3.0-T whole-body scanner (Discovery MR 750, GE Healthcare, Milwaukee, WI, USA) using a 32-channel phased-array head coil. Resting-state blood oxygenation level dependent activity was obtained by a gradient echo planar imaging sequence with the following parameters: repetitive time = 2000 ms, echo time = 30 ms, Flip angle = 80°, field of view (FOV) = 240 mm, Matrix = 64×64, Slice thickness = 3.2 mm, Slice number = 43, 205 volumes. Participants were instructed to keep their eyes closed, stay as motionless as possible, think of nothing in particular, and not fall asleep. A high-resolution 3D T1-Weighted structural image was acquired in the transverse orientation using a 3D-BRAVO sequence with the following parameters: TR=8.2 ms, TE=3.2 ms, Flip angle=12°, FOV=220 mm 20 mm, Matrix=256×256, Slice thickness = 1.0 mm. Diffusion tensor image data were conducted with a single shot spin echo EPI pulse sequence with following parameters: TR = 5000 ms, TE = 98.8 ms, Flip angle=90°, FOV = 220 mm, Matrix=256×256, Slice thickness = 4 mm, Slice number = 30, 25 uniformly distributed gradient orientations (b = 1000s/mm2).
To prepare MR image data for analysis, images from patients with right-sided lesions were flipped with respect to the mid-sagittal plane, so that the affected hemisphere corresponded to the left hemisphere in all patients.
MRI Data Preprocessing
MRI data preprocessing was conducted using Data Processing Assistant for Resting-State fMRI (DPARSF) (http://rfmri.org/DPARSF). First, slice-timing and realignment was performed. Second, the functional images were co-registered to the individual 3D T1-weighted images. Third, normalized functional images were obtained by applying the deformation field to the co-registered functional images. Fourth, spatial smoothing (FWHM=8 mm) was applied to the normalized functional images. Fifth, eliminate the linear trend, reduce low-frequency drift and high-frequency physiological noise. Finally, sources of spurious variance were removed by linear regression.
Resting-State Functional Connectivity Analysis
Functional Connectivity (FC) analysis was performed using a seed-based voxel-wise correlations approach by the REST toolkit (http://www.restfmri.net). Eight seed regions of interest (ROIs) associated with the motor execution were selected: primary motor area (M1), dorsolateral premotor cortex (PMd), ventrolateral premotor cortex (PMv), and supplementary motor area (SMA) from both hemispheres of each subject.20-23 A 5 mm radius sphere was applied to the ROI extraction. The time series of all voxels in each region of interest were extracted and averaged to obtain a representative time series. We computed Pearson’s correlation coefficients between the time series of all possible pairs of 8 regions, yielding one symmetric correlation matrix for every subject. Correlation coefficients were converted to Fisher’s Z-scores to yield approximately normally distributed data. BrainNet Viewer software (http://www.nitrc.org/projects/bnv) was performed to construct the motor functional network.
Analysis of Structural MRI
Infarct volumes were calculated by manually on the T1-weighted MRI for each slice with MRIcron (http://www.mccauslandcenter.sc.edu/mricro/mricron). The degree of CST damage was assessed by structural integrity of posterior limb of each internal capsule (PLIC), which was quantified by calculating the asymmetry of mean fractional anisotropy (FA) values: FA asymmetry index = (FAunaffected - FAaffected) / (FAunaffected + FAaffected).24,25
Statistics
Statistical analyses were performed using SPSS 22 (IBM Corp. Armonk, NY, USA). The mean values among the groups were compared by either one-way ANOVA for continuous data or the chi-squared test for categorical data. The non-parametric Kruskal–Wallis test was used to compare ranked data among the 3 groups. Treatment effects were evaluated using 2 factor analyses of variance (ANOVA) comparing the within-group factor “time” (2 levels: baseline and post-intervention), the between-group factor “group” (3 levels: HF-rTMS, LF-rTMS, Sham) and “group” × “time” interaction effects on behavioral and FC. Bonferroni method was applied for multiple comparisons (post hoc tests)
The Pearson correlations were used to test the relationship between the motor recovery (△FMA) and changes in connectivity before and after rTMS intervention. The analyses were conducted using a threshold of P < .05.
Results
Demographic and clinical characteristics of all patients in three groups.
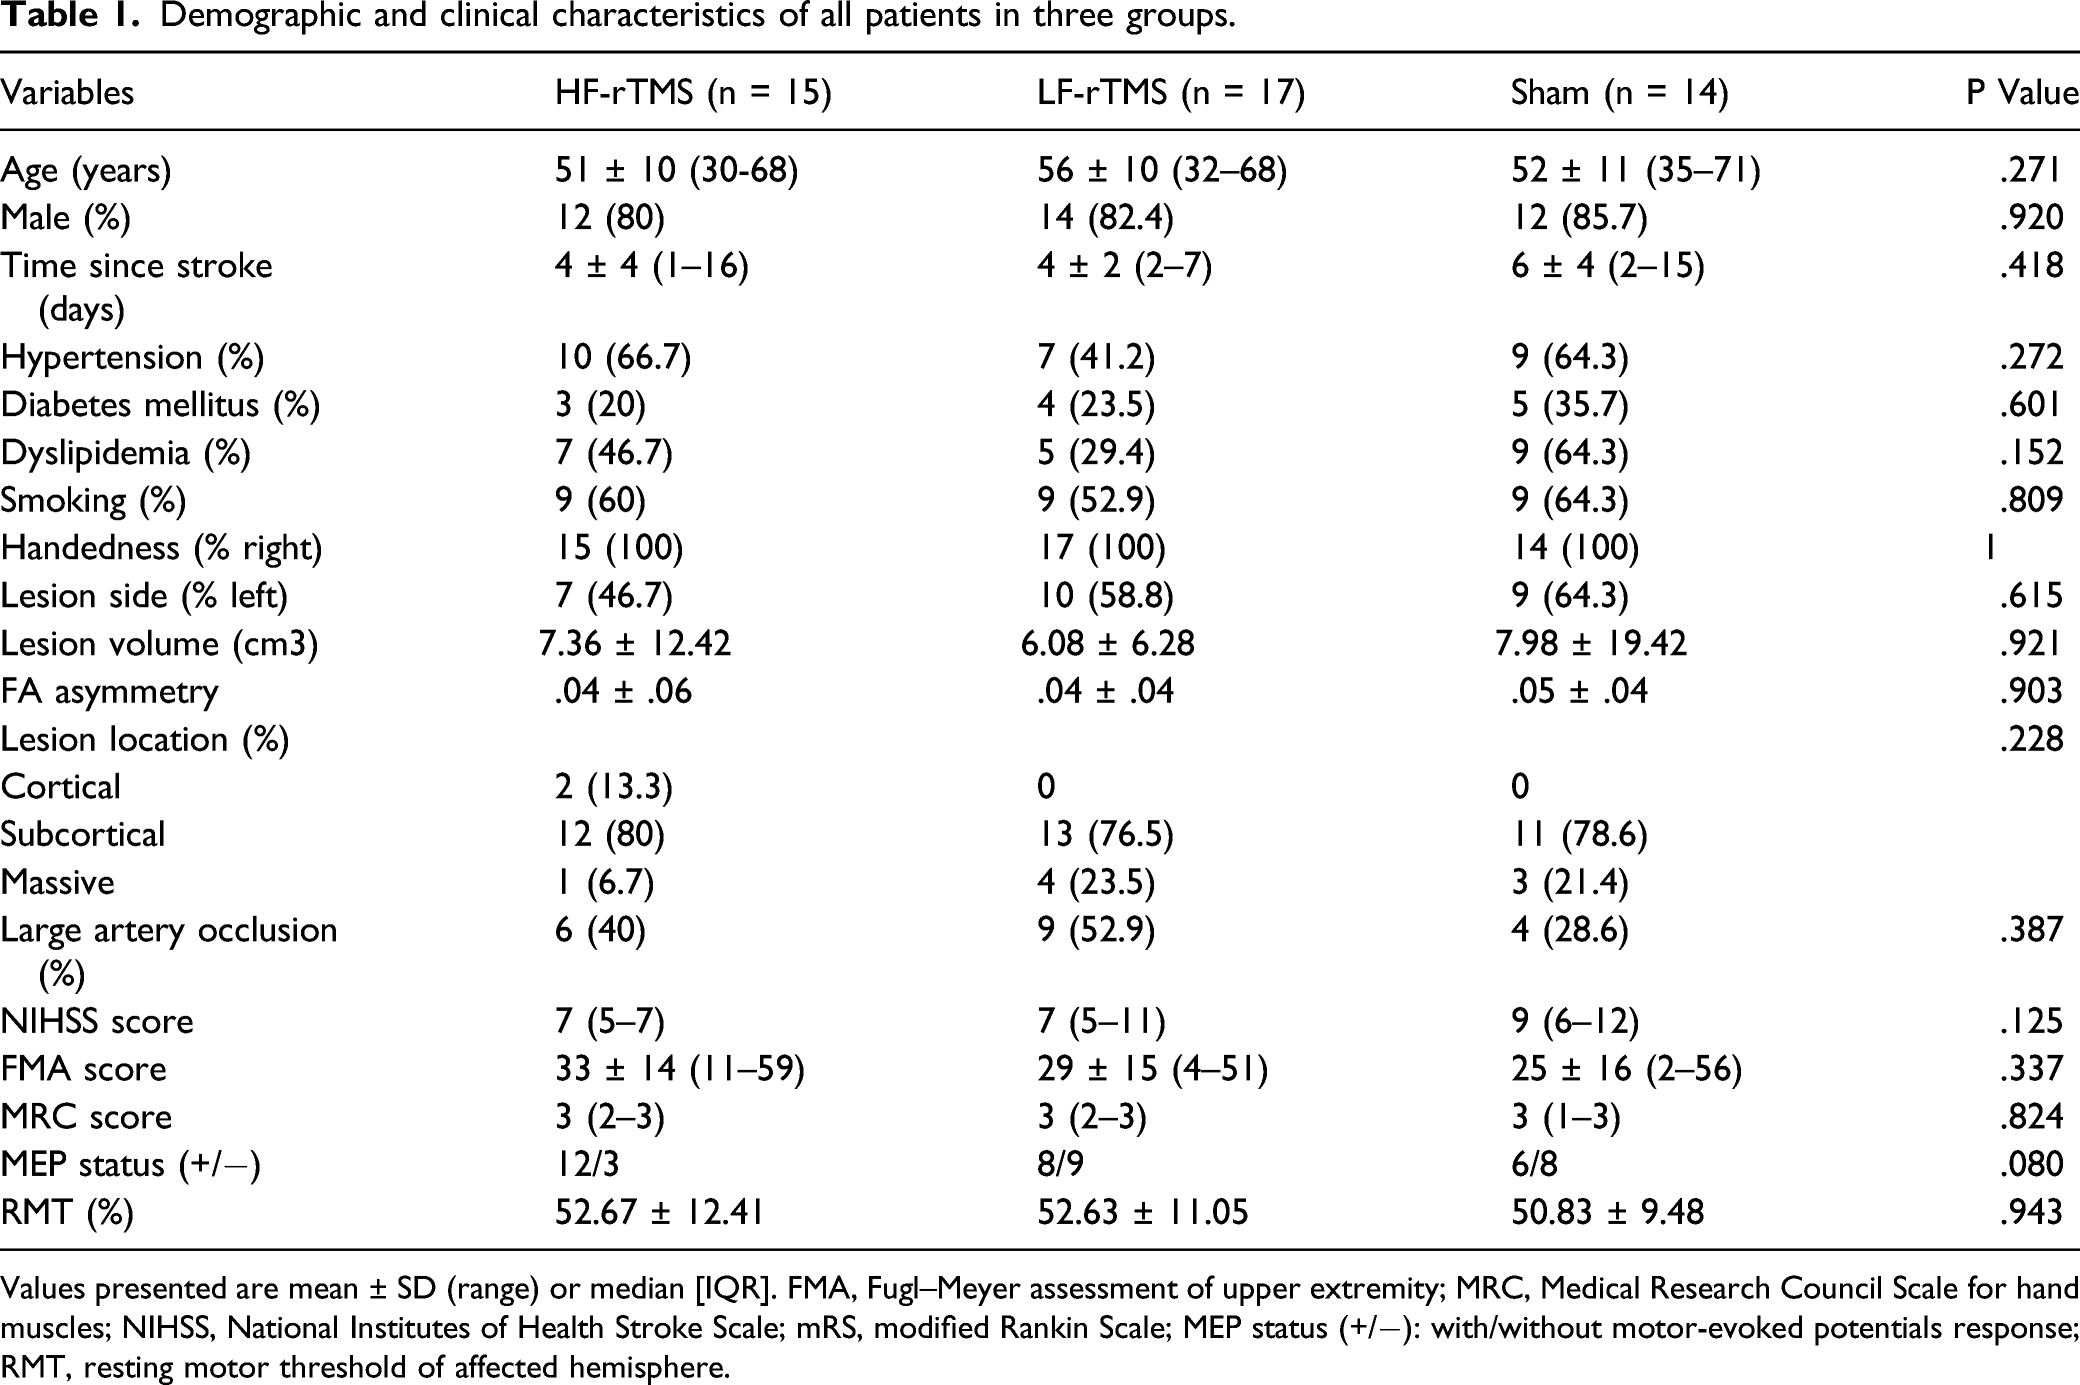
Values presented are mean ± SD (range) or median [IQR]. FMA, Fugl–Meyer assessment of upper extremity; MRC, Medical Research Council Scale for hand muscles; NIHSS, National Institutes of Health Stroke Scale; mRS, modified Rankin Scale; MEP status (+/−): with/without motor-evoked potentials response; RMT, resting motor threshold of affected hemisphere.
Motor Performance
We found a significant interaction between “group” × “time” (F = 4.893, df = 1.528, P= .012) for FMA. Post hoc test revealed that motor improvement was significantly enhanced in both real rTMS groups compared with the sham group (HF-rTMS vs sham, P = .004; LF-rTMS vs sham, P = .022; HF-rTMS vs LF-rTMS, P = .438). Importantly, in the subsample of patients that could be recruited for 3 months follow-up measurements, FMA scores were still significantly higher in real rTMS groups compared with the sham group (HF-rTMS vs sham, P = .015; LF-rTMS vs sham, P = .038; HF-rTMS vs LF-rTMS, P = .668) (Fig.2). Moreover, there were no significant correlations between the baseline FMA and delta-FMA intervention (P < .345, r = .142), between baseline MEPs status and delta-FMA (P = .55, r = .285) and between baseline FA asymmetry and delta-FMA (P = .973, r = −.005) before/after intervention, irrespective of the group. Motor impairment assessments: upper extremity score of Fugl–Meyer assessment score at baseline, post-intervention, and 3 months follow-up among HF-rTMS (red), LF-rTMS (green) and sham (gray) group. Values are mean ± SEM. Both the real rTMS groups had significant improvements in the FMA score compared with the sham group (ANOVA “group × time” interaction: *P = .012). Motor function was still significantly different between groups (ANOVA “group × time” interaction: **P = .001) when adding patients with 3 months follow-up data (n=41). HF, high-frequency; LF, low-frequency; rTMS, repetitive transcranial magnetic stimulation.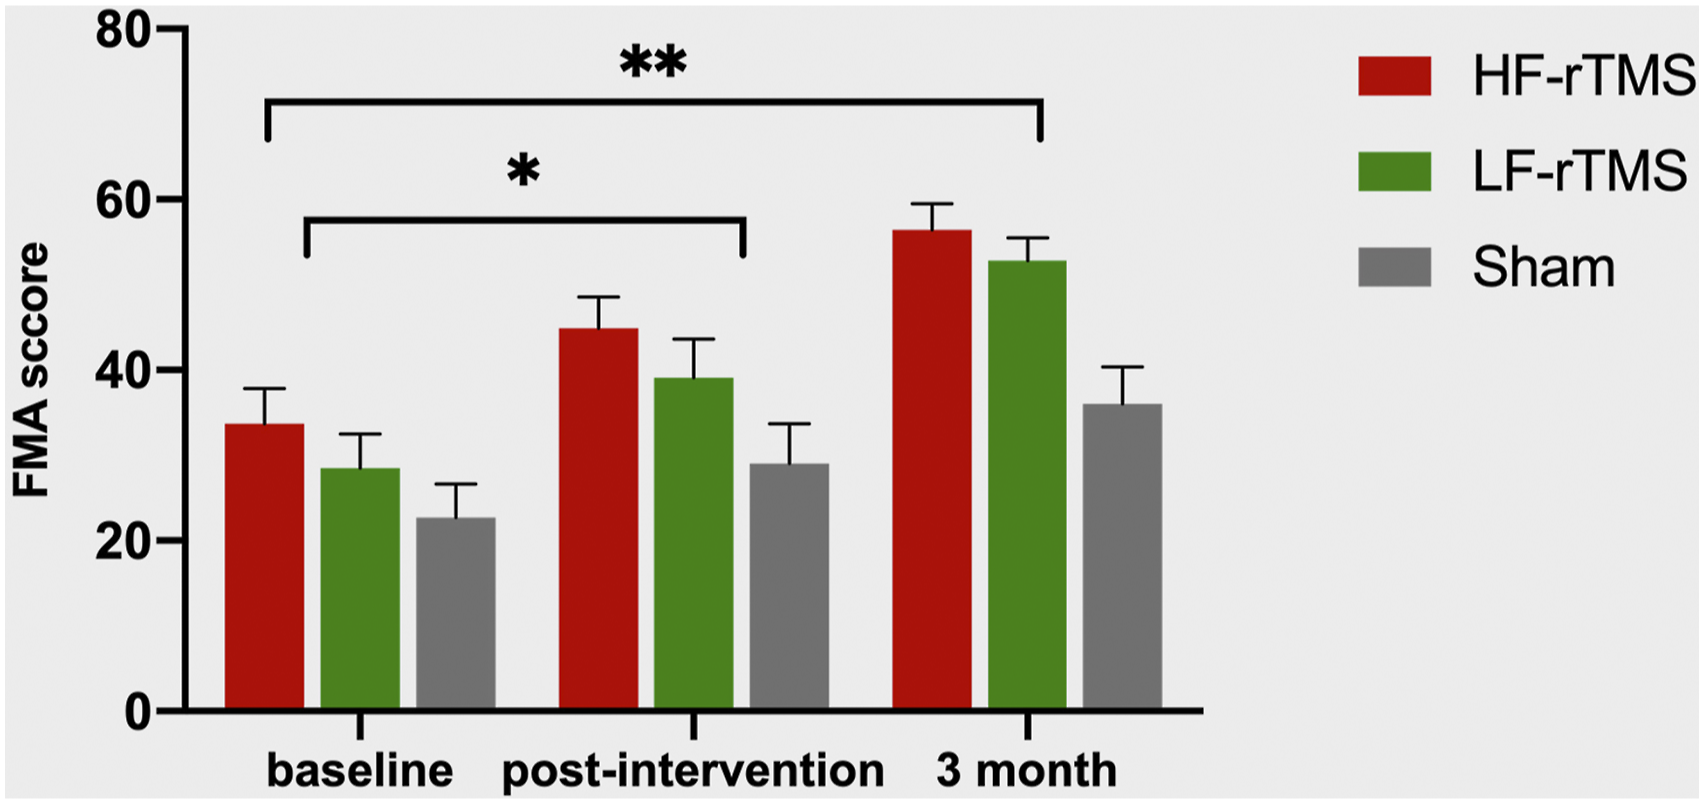
Neurophysiological Measures
Of the 46 patients who completed the intervention, we excluded from the neurophysiological analysis 20 patients who had no evoked response in the affected hemisphere at baseline. There was no significant difference in delta-FMA before/after intervention between the MEPs+ vs the MEPs-patients (P = .055, t = −1.971, F = 44).
Resting-State Functional Connectivity
Compared with the sham group, the HF-rTMS group showed significant increased connectivities in interhemispheric M1-M1 (P = .007), and between ipsilesional PMv and contralesional M1 (P = .023), ipsilesional SMA (P = .034), while the LF-rTMS group revealed significant increased connectivity of the stimulated region (contralesional M1) with ipsilesional SMA (P =.010). HF-rTMS group had a significantly increased connectivity between ipsilesional M1 and contralesional M1, compared with the LF-rTMS group (P = .036). (Fig.3). Comparison of the changes in FC from baseline to post-intervention among the three groups. (A) Increased FC displayed after between-group comparison. The significant connections are displayed with red lines. The left side of the images refers to the ipsilesional hemisphere. (B) HF-rTMS group showed significant increased FC in interhemispheric M1-M1 (P = .007), ipsilesional PMv-contralesional M1 (P = .023) and ipsilesional PMv-SMA (P = .034), while LF-rTMS group revealed significant increased FC in contralesional M1-ipsilesional SMA (P =.010), compared with the sham group. HF-rTMS group had a significantly increased FC in interhemispheric M1, compared with the LF-rTMS group (P = .036). (a) * represent HF vs LF, ** represent HF vs sham; (b) * represent HF vs sham; (c) * represent LF vs sham; (d) *represent HF vs sham. P < .05 (adjusted for multiple comparisons by the Bonferroni method). HF, high-frequency; LF, low-frequency; rTMS, repetitive transcranial magnetic stimulation; FC, functional connectivity.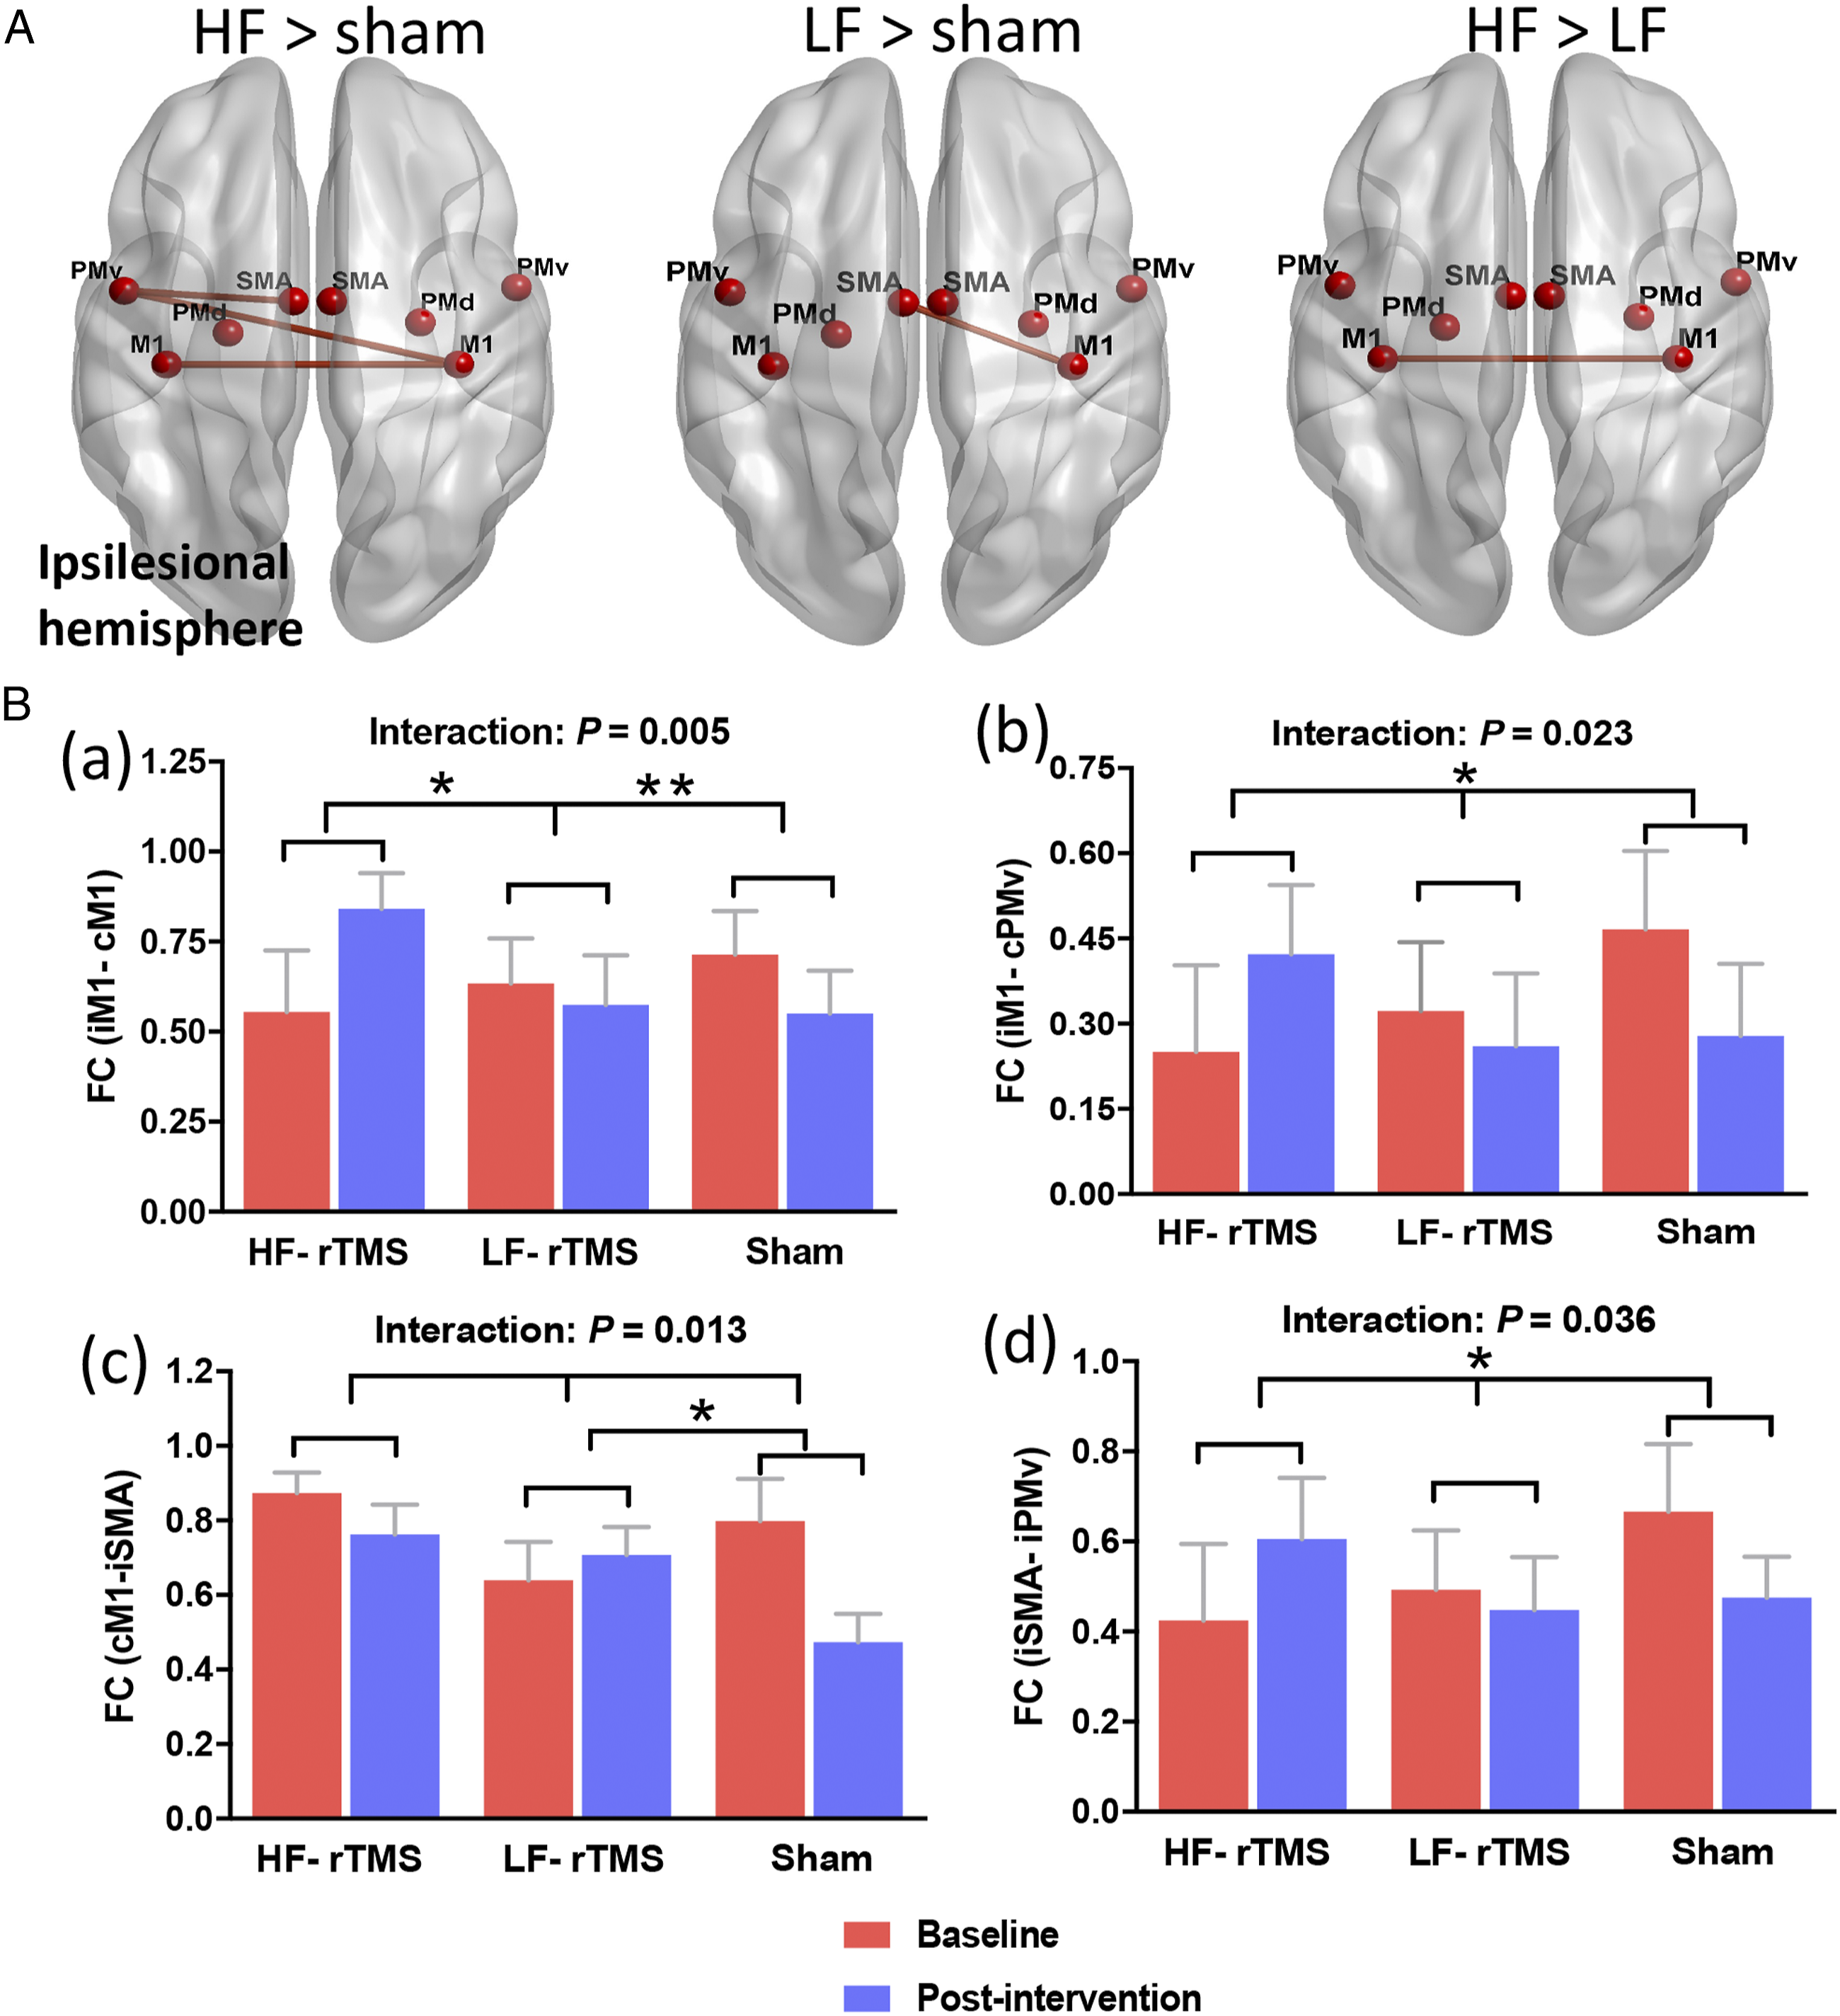
Correlation Between the Network Reorganization and Motor Recovery
The HF-rTMS group showed significant positive correlations between motor recovery and connectivity changes of the stimulated region (ipsilesional M1) with contralesional M1 (r = .623, P = .013) and ipsilesional SMA (r = .543, P = .036), while the LF-rTMS group revealed a significant positive correlation between motor recovery and connectivity changes of the stimulated region (contralesional M1) with ipsilesional SMA (r = .559, P = .020) (Fig.4). No significant correlation between motor recovery and function connectivity was detected in the sham group. Correlation between the changes of FC and motor recovery (△FMA). HF-rTMS group showed significant positive correlations between motor recovery and FC changes of the ipsilesional M1 with contralesional M1 (r = .623, P = .013) and ipsilesional SMA (r = .543, P = .036), while LF-rTMS group revealed a significant positive correlation between motor recovery and FC changes of the contralesional M1 with ipsilesional SMA (r = .559, P = .020). HF, high-frequency; LF, low-frequency; rTMS, repetitive transcranial magnetic stimulation; FC, functional connectivity; FMA, Fugl–Meyer Assessment.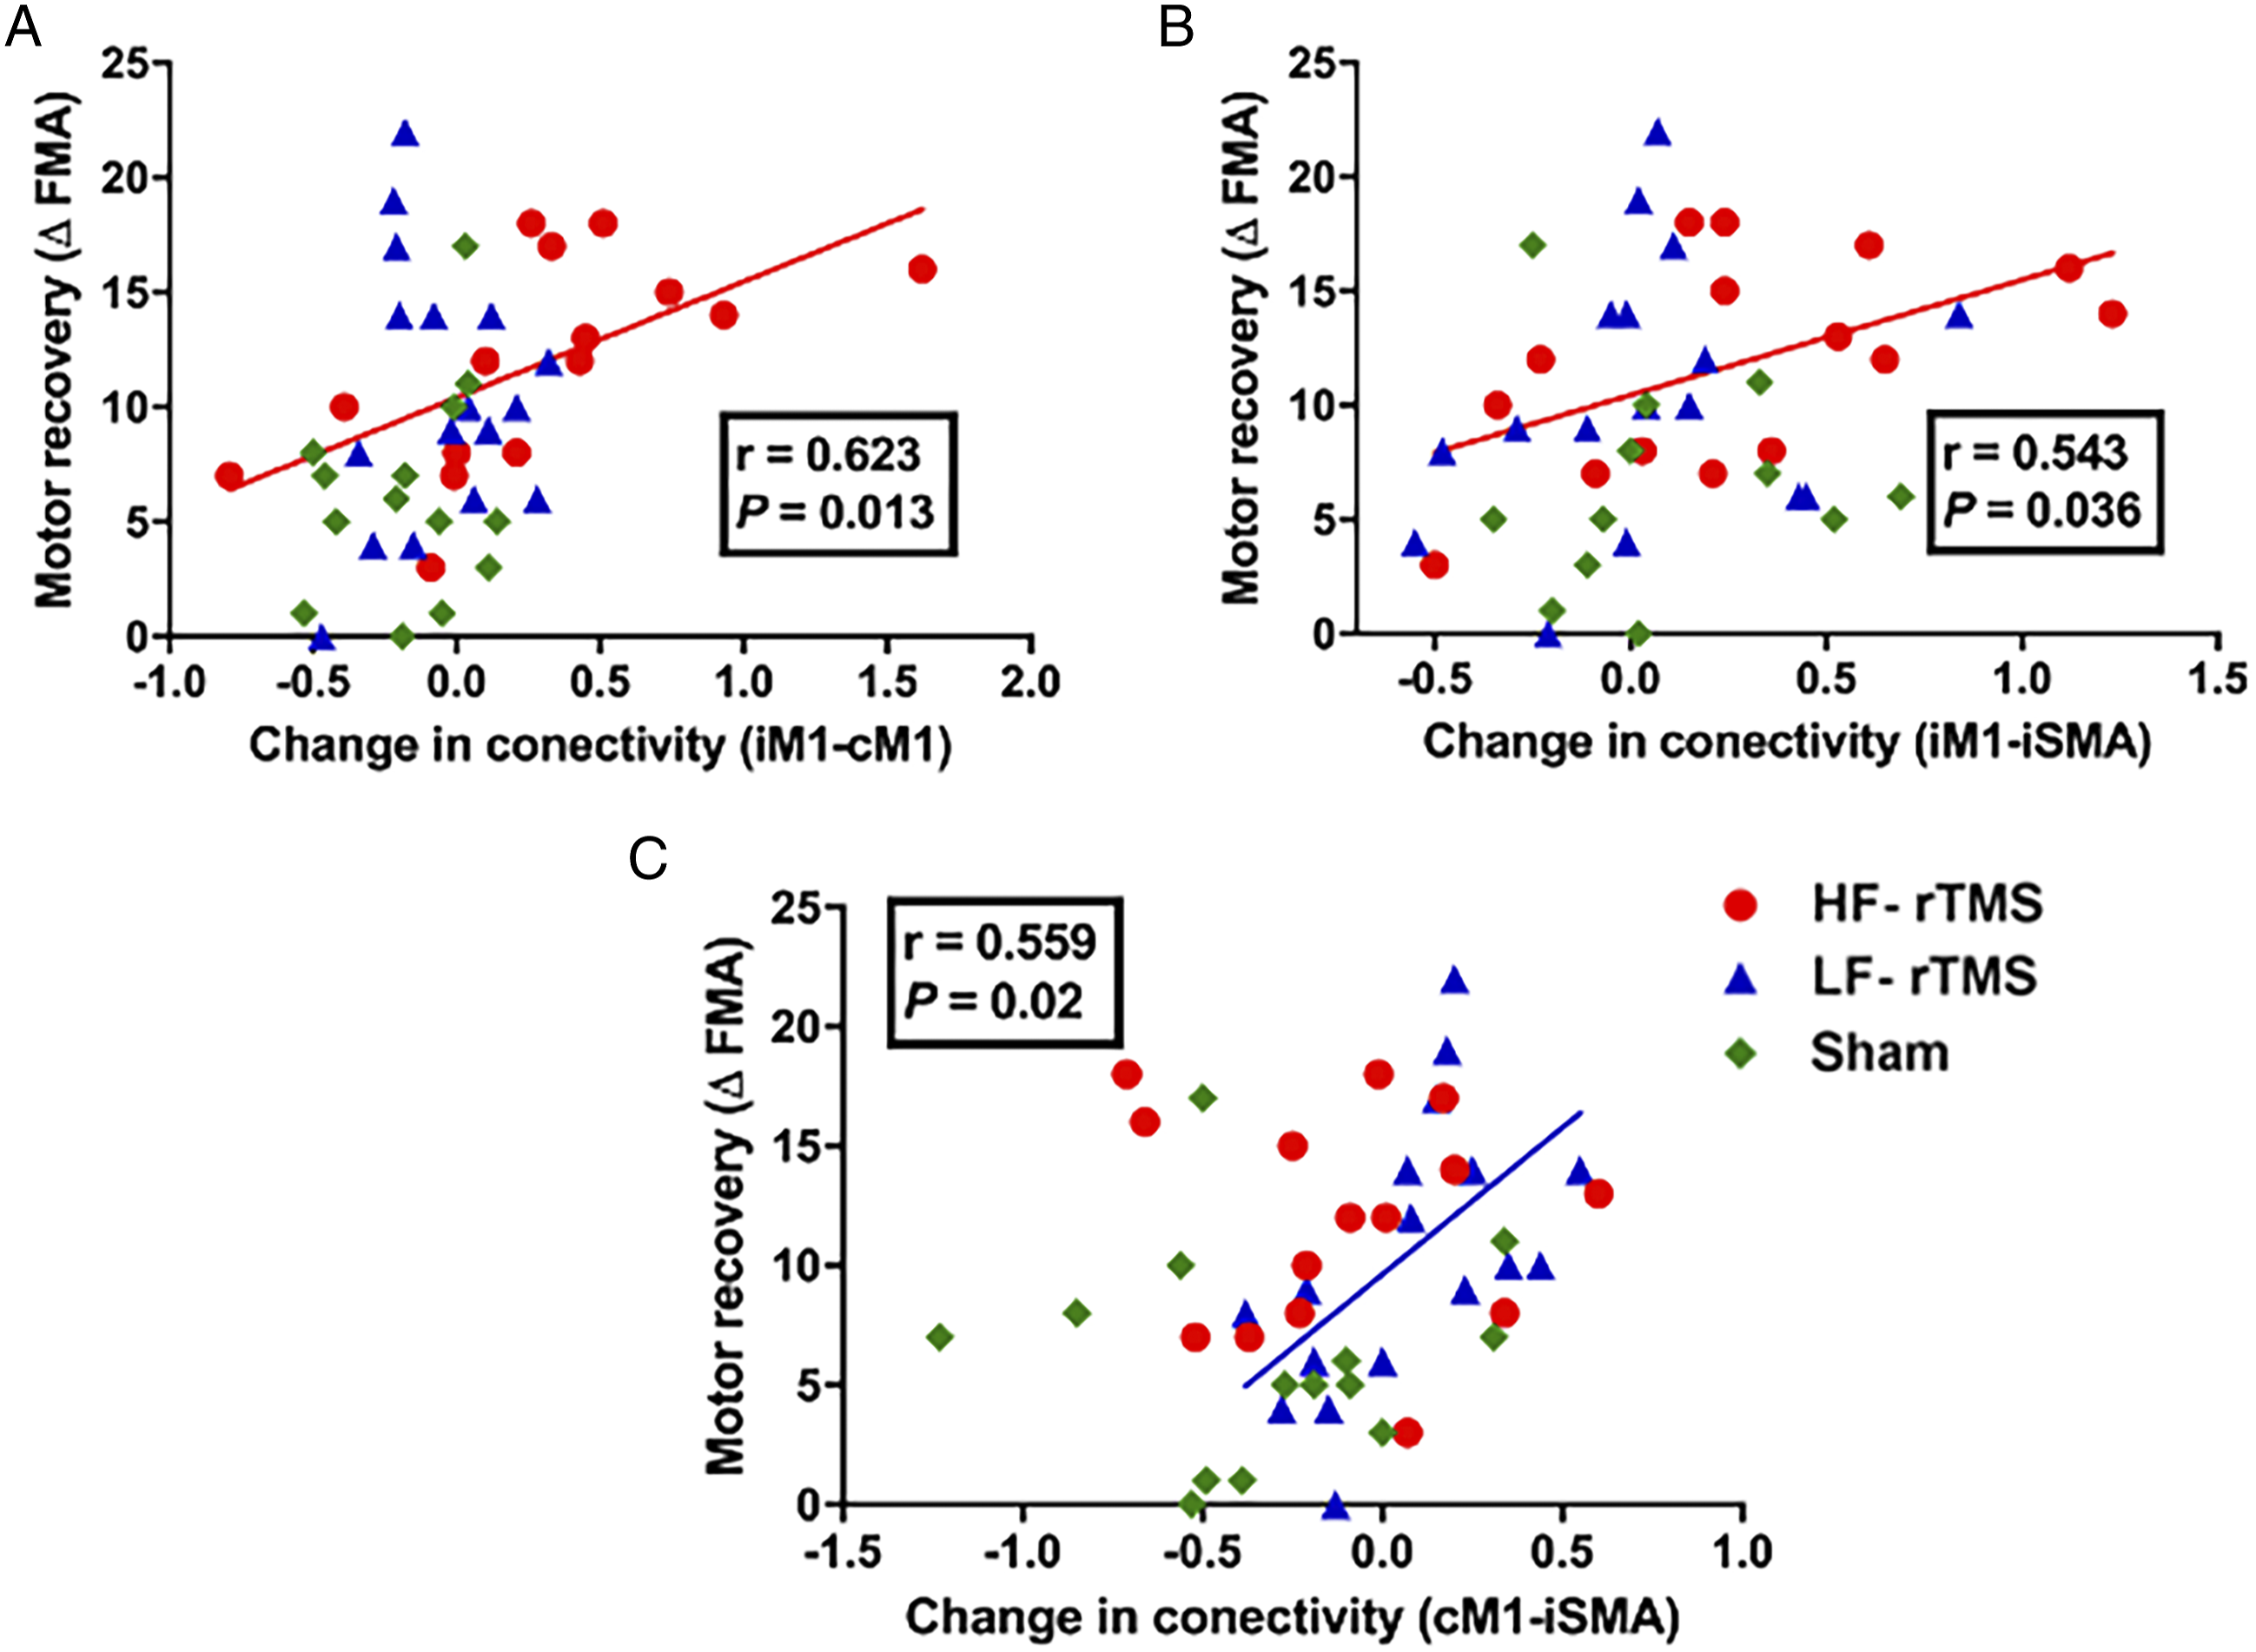
Furthermore, the baseline FC of ipsilesional M1 with contralesional M1 (r = −.619, P = .014) and ipsilesional SMA (r = −.588, P = .021) significantly negatively correlated with motor recovery in the HF-rTMS groups. There was no significant correlation between the baseline FC of motor regions with motor recovery in LF-rTMS and sham groups (P > .05). The findings suggested that lower baseline FC of the stimulated region with the 2 motor areas predicted better treatment response to HF-TMS intervention.
Discussion
In this study, we found that both excitatory and inhibitory rTMS enhanced significant motor improvements compared with sham stimulation during the early phase of stroke. The increases in FC between the stimulated site and other motor regions induced by real rTMS interventions were associated with better motor recovery. Baseline FC in interhemispheric M1 and ipsilesional M1-SMA may predict the beneficial effect of high-frequency rTMS on improving motor function after stroke. Most importantly, the effects of rTMS persisted beyond the intervention up to at least 3 months.
We for the first time used a randomized, sham-controlled experimental design to reveal the different efficacy of high- and low-frequency rTMS on motor network connectivity with a larger sample of stroke patients. We found excitatory rTMS over the ipsilesional M1 enhanced intra- and interhemispheric RSFC, whereas inhibitory rTMS over contralesional M1 induced an increase in interhemispheric RSFC, plausibly facilitating motor function recovery after stroke. The present findings furtherly confirmed and expanded that rTMS might not only modulate local cortical plasticity but also regulate particular brain network of the motor system in stroke patients.13,26
For the neurophysiological measures, we found that MEP (+) might be a potentially predictive biomarker for favorable motor functional outcome. The finding was in line with previous study indicated that the absence of MEP early after stroke onset is associated with poorer motor recovery. 27 However, we did not find the baseline FMA, the degree of CST damage (FA asymmetry) could predict the motor recovery at the early stage of stroke.
Most importantly, our results showed the positive correlations between the connectivity changes of the stimulated region (M1) with intra/interhemispheric motor areas and better motor recovery in stroke patients. A number of studies demonstrated that motor network resting-state connectivity progressively decreases within the first few weeks after stroke.11,12 Higher levels of motor cortical connectivity was associated with better motor recovery after stroke. Therefore, increasing motor network connectivity in early phase of stroke might be particularly effective to enhance motor recovery. A potential mechanism underlying rTMS effect lies in the induction of motor cortical plasticity, which might concurrently increase functional connectivity between the stimulated M1 and remote motor areas 12 Therefore, our study demonstrated that adding rTMS to physiotherapy in recovering stroke patients seems to enhancement with motor network connectivity, possibly reflecting early functional reorganization of neural network after stroke.
Meanwhile, the current study gave a good indication that increased FC of ipsilesional/contralesional M1 could be served as a therapeutic target of motor rehabilitative therapy for stroke patients. 28 Moreover, we also found that baseline FC pattern (FC of ispilesional M1 with other motor areas) in stroke is predictive of beneficial treatment response to HF-rTMS. Given this, it may indicate that identifying patients suitable for rTMS intervention could base on individual characteristics of motor network connectivity after stroke.
There were some limitations to our study. First, the small sample size in our study was not sufficient enough to compare the neurophysiological measures, such as RMT, MEP latency and amplitude. Second, considering motor function recovery is thought to rely mainly on motor cortex reorganizations, we did not assess the cross-modal plasticity 29 in stroke patients. Third, our study could not provide the long-term effect ( > 3 month follow-ups) of rTMS on the functional reorganization evaluated by rs-fMRI in stroke patients. Future longitudinal research should further explore the dynamic functional reorganization mechanism of rTMS-induced motor function recovery.
Conclusion
This study demonstrated that the beneficial effect of rTMS on motor recovery correlated with the increase of FC between the stimulation site with remote motor areas detected by rs-fMRI, possibly reflecting the mechanism of motor network reorganization by rTMS in early post-stroke phase. Importantly, FC data from early post-stroke patients may predict the individual response to rTMS treatment. Our study shed light on the mechanism of action of rTMS intervention and provides vital value guidance in clinical application of rTMS in the early post-stroke phase.
Footnotes
Declaration of conflicting interests
The author(s) declared no potential conflicts of interest with respect to the research, authorship, and/or publication of this article.
Funding
The author(s) disclosed receipt of the following financial support for the research, authorship, and/or publication of this articleThis work was supported by grants from the National Key R&D Program of China (2017YFC1307900), National Natural Science Foundation of China (no. 81870946, 81701299, 81771424, 81901218) and Key R&D Program of Jiangsu Province (BE2020697).