
Abstract
Background. Resting brain activity can be modulated by motor tasks to adapt to function. In multiple sclerosis (MS) patients, altered resting-state functional connectivity (RS-FC) has been reported and associated with impaired function and disability; little is known on how RS-FC is modulated by a simple repetitive motor task. Objective. To assess changes in RS-FC in early relapsing-remitting MS (RRMS) patients associated with repetitive thumb flexions (RTFs). Methods. A total of 20 right-handed patients with early RRMS and 14 healthy controls underwent a resting functional magnetic resonance imaging (fMRI) scan, before and after 25 minutes of alternate 30-s blocks of right RTF and rest. Dual-regression analysis of resting fMRI data followed the independent component analysis. Individual spatial maps of coherence between brain areas for 2 networks of interest, sensorimotor and cerebellar, were compared at the group level and correlated with measures of both clinical impairment and brain damage. Results. Significant RTF-induced differences in RS-FC were observed between groups in the cerebellar network because of increased RS-FC in patients but not in controls. In the sensorimotor network, the RS-FC after RTF increased in both groups, with no significant between-group differences. The sensorimotor and the cerebellar RS-FC were intercorrelated only in patients and only after the RTF. The sensorimotor RS-FC increase in patients correlated with structural MRI alterations. Conclusions. Our study unmasked RS-FC changes of motor-related networks occurring after a simple repetitive motor task in early RRMS patients only. Evaluation of altered RSN dynamics might prove useful for anticipating neuroplasticity and for MRI-informed neurorehabilitation.
Introduction
Functional magnetic resonance imaging (fMRI) studies during the performance of a motor task have repeatedly reported that patients with multiple sclerosis (MS) show an enlargement of cortical activation, which even involves areas that are not generally activated in healthy individuals.1-4 This finding has been interpreted as an adaptive mechanism of neuroplasticity finalized to maintain a normal function despite the brain tissue damage.
Neuroplasticity can be modulated by motor performance, as demonstrated both by experimental studies 5 and by studies on humans with neurological diseases.6-8 In fact, the possibility of facilitating cortical reorganization in the motor network through motor performance represents the neurobiological basis of rehabilitative programs after brain damage.
In MS, few studies have addressed the issue of task-related fMRI changes induced by a simple motor training, and those available have produced discordant results.9,10 Morgen et al 10 reported that after a motor training consisting of repetitive finger tapping, unlike healthy individuals, MS patients did not exhibit task-specific reductions in motor activation, whereas Mancini et al 9 showed that after a similar motor task, activation reduction in motor areas was the same in both healthy individuals and MS patients.
fMRI during the resting state (RS fMRI) is a more recent method enabling us to investigate the resting brain’s spontaneous neuronal activity, organized to form specific functional resting-state networks (RSNs). Spontaneous neuronal activity is identified by slow fluctuations of the BOLD signal and is visualized by spatial maps of correlations of the signal’s time courses within anatomically separate brain regions, to represent the brain’s resting-state functional connectivity (RS-FC). 11
RS fMRI, with respect to task-related fMRI, has the advantage of not being influenced by the task performance, which may differ between patients and healthy controls. Various RSNs have been identified so far12,13 by their correspondence to brain areas evidenced in task-related fMRI11,13—that is, the sensorimotor (SMN) and the cerebellar (CBN) RSNs correspond to areas activated during motor task performance. Baseline alterations of various RSNs,14-16 including motor-related RSN,15,17,18 have been reported in MS patients; however, RS-FC after a simple motor task has never been investigated in this disease.
The resting-state activity is the expression of a peculiar functional state of the brain, fluctuating with intrinsic activity but also modifiable on functional request. 19 Experience, learning, and disease can modify persistently the RSNs,19-21 reflecting neuroplastic changes. On the other hand, a simple voluntary behavior or stimulus, that is, a simple hand movement, may reveal subtle and transient changes in the range, spatial distribution, or other aspects of resting-state fluctuations. 20 Overall, the manipulation of the resting state to characterize its dynamics might be a valid way to investigate functional connectivity alterations in patients. Resting-state reactivity is presumably a functional substrate for intervention, which should be able to produce more profound neuroplastic changes. In this view, basal resting-state reactivity could reveal the potential for experience-dependent plasticity, thus representing a target for neurorehabilitation or even a marker of its success.
Against this background, we decided to investigate changes in spontaneous neuronal activity within the sensorimotor and cerebellar RSNs induced by an elementary hand movement. Because movement can influence cortical reorganization by unmasking and enhancing connections between motor neurons,22,23 we hypothesized that a simple motor task could modify RS-FC in MS within RSNs related to the motor function.
Materials and Methods
Participants
We studied patients with a diagnosis of relapsing-remitting MS (RRMS) 24 recruited in the outpatient clinic at the Sant’Andrea Hospital, Sapienza University of Rome. Study data were collected as part of a wider study, aiming to assess the effect of interferon-β in modulating brain plasticity in MS. Inclusion criteria were as follows: age between 18 and 60 years; right-handedness; mild disability, as assessed by the Expanded Disability Status Scale 25 (EDSS score ≤ 3.0); and naïve to disease-modifying therapy. Exclusion criteria were as follows: severe fatigue, as assessed by the Fatigue Severity Scale 26 (score > 4); depression, as assessed by the Beck Depression Index 27 (score > 9); clinical relapse in the previous 2 months; steroid treatment in the previous 2 months; systemic diseases, such as cardiovascular, pulmonary, or autoimmune pathologies; psychiatric disorders; history of seizures; and contraindications to MRI.
We collected demographic and clinical data in all the study participants. MS patients underwent a neurological examination, assessing their EDSS score in the phase of recruitment. We also recruited right-handed healthy subjects (HS), matched for age and sex. During the visit for the scanning session, before entering the scanner, we obtained the Multiple Sclerosis Functional Composite 28 score that includes 9-Hole Peg Test (9HPT) for dominant (9HPT-DH) and nondominant hands (9HPT-NDH), the 25-feet walk, and the Paced Auditory Serial Addition Test for both patients and controls. For the purpose of this study, only the 9HPT-DH and 9HPT-NDH were used in the analysis.
The study was approved by the Ethical Committee of Sapienza University of Rome and Policlinico Umberto I, and written informed consent was obtained from each participant before any study procedure.
MRI Acquisition
Images were acquired with a Siemens Magnetom Verio 3 Tesla scanner. All acquisitions took place between 14.00 and 19.00
A Siemens 12-channel head coil, designed for parallel imaging (GRAPPA), was used for signal reception. Slice orientation parallel to the subcallosal line was ensured by acquiring a multiplanar T1-weighted localizer at the beginning of each MRI scan. All individuals underwent BOLD single-shot echo-planar imaging in a resting condition in 2 runs, before and after the 25-minute task and the simultaneous structural sequence acquisition.
BOLD acquisition parameters were as follows: TR = 3000 ms; TE = 30 ms; flip angle = 89°, 64 × 64 matrix; 50 contiguous axial slices 3 mm thick; 140 volumes; acquisition time = 7 minutes, 11 s. During the scan, an operator (NP) was visually controlling the correct execution of RTF from the scanner’s console room. During the 25-minute task, the following sequences were acquired for all individuals:
High-resolution 3D, T1-weighted (3DT1) MPRAGE sequence (repetition time [TR] = 1900 ms; echo time [TE] = 2.93 ms; flip angle = 9°; field of view [FOV] = 260 mm; matrix = 256 × 256; 176 sagittal slices 1 mm thick; no gap), acquired twice consecutively
Dual turbo spin-echo, proton density (PD) and T2-weighted images (TR = 3320 ms; TE1 = 10 ms; TE2 = 103 ms; FOV = 220 mm; matrix = 384 × 384; 25 axial slices 4 mm thick; 30% gap)
Diffusion tensor imaging (DTI) acquired with a single-shot echo-planar spin-echo sequence with 30 directions (TR = 12 200 ms; TE = 94 ms; FOV = 192 mm; matrix = 96 × 96; b = 0 and 1000 s/mm2; 72 axial slices 2 mm thick; no gap)
Patients only underwent a T1-weighted spin echo sequence acquisition after administration of gadolinium-based contrast agent (TR = 550 ms; TE = 9.8 ms; FOV = 240 mm; matrix = 320 × 320; 25 axial slices 4 mm thick; 30% gap) at the end of the session.
Resting-State Imaging Analysis
Single-patient preprocessing was carried out using FEAT v.5.98, part of FSL v4.1.9 (FMRIB’s Software Library, www.fmrib.ox.ac.uk/fsl) on 136 RS BOLD volumes for each individual after having removed the first 4 volumes of the sequence to obtain a more steady resting state. We applied motion correction using MCFLIRT, 29 a tool for rigid body transformation. We also removed non–brain substance using BET. 30 Spatial smoothing was also used with a 5-mm FWHM (full width at half maximum) Gaussian kernel. Gross signal drifts (caused by scanner instabilities or systemic physiological fluctuations) were attenuated by applying high-pass filtering cutoff, set at 100 s. At this stage, we also applied registration, carried out using FLIRT, based on linear affine registration 29 to the high-resolution 3DT1 image (which is obtained by swapping the 2 consecutively acquired 3DT1 images from the sagittal to the axial plane, thereby averaging them). Concomitantly we applied nonlinear registration of the 3DT1 to standard brain space images (MNI152, 2 mm brain) using the FMRIB’s Nonlinear Image Registration Tool at a warp resolution of 10 mm.
An independent-component analysis (ICA) 31 of preprocessed RS data, of both RS runs for both MS patients and HS, was carried out using MELODIC, part of FSL. 12 Preprocessed RS data, containing 136 time points for each individual, were temporally concatenated across individuals in order to create a single 4D data set. The number of components was fixed to 25 based on an initial analysis of the population using model order estimation. The individual-dependent effect sizes identified in the initial analysis suggested that 25 components were significantly nonzero on average. RSNs of interest covered the entire brain and were selected by expert visual inspection (NP, PP, FT) against a set of previously defined maps.12,13
Out of 25 components resulting from ICA analysis, 16 components were discarded because they mainly reflected motion artifacts or BOLD signal drift. A total of 9 components were identified as RSNs—namely, the visual cortex, default mode network (DMN), SMN, auditory, right and left frontoparietal, cerebellar, ventral-dorsal attention, and executive function. For the purpose of this study, we focused on the CBN and SMN because we hypothesized that a motor task would have an influence on them.
Then, for each run of each individual, the dual regression approach was used to identify, within each individual’s RS BOLD data set, individual-specific temporal dynamics and spatial maps that are associated with group IC maps of the CBN and SMN. This involves (1) using the full set of group-ICA spatial maps in a linear model fit (spatial regression) against the separate fMRI data sets, resulting in matrices describing temporal dynamics for each component for each individual and (2) using these individual-specific time course matrices in a linear model fit (temporal regression) against the associated fMRI data set to estimate individual-specific spatial maps. Partial correlation coefficients were calculated from the spatial maps output from the General Linear Model (GLM) as a measure of coherence of a voxel’s time course with the RSN. These partial correlation coefficients were converted to Z-values using a Fisher z-transformation. Finally, the different component maps were collected across individuals into single 4D files (one per original ICA map, with the fourth dimension being individual ID).
A voxelwise GLM to assess group differences was applied to the spatial FC maps using permutation-based nonparametric testing (5000 permutations), 32 with cluster-based thresholding (clusters determined by Z >2.3) and a family-wise error (FWE)-corrected cluster significance threshold of P < .05 applied to the suprathreshold clusters to account for multiple (voxelwise) comparisons across the RSNs used in this study. This resulted in spatial FC maps characterizing between-run and between-group differences. Clinical parameters (9HPT) and radiological variables (T2 lesion volume [LV]) were entered into 1-sample models as covariates of interest to evaluate correlations of the RS-FC with the motor performance and brain structural parameters. Anatomical localization of significant clusters was established using the Harvard-Oxford Structural Atlas, the Juelich Histological Atlas, and the Oxford Thalamic Connectivity Probability Atlas included in FSL (http://www.fmrib.ox.ac.uk/fsl/data/atlas-descriptions.html).
Finally, parameter estimates, as expressed by Z values in individual RS maps, within a group mask of each of the 2 RSNs, were used to obtain plots of the 2 runs in each group and to correlate RS connectivity with both clinical (9HPT) and structural MRI (lesion burden and DTI parameters) variables.
Structural Imaging Analysis
PD/T2 and post-contrast T1-weighted images were visually inspected to evaluate the presence of hyperintense lesions and disease activity, respectively. We used the PD images to calculate LV using a semiautomated technique with the Jim 5.0 software (Xinapse System, Leicester, UK; http://www.xinapse.com). LV values were obtained by a trained operator (NP) and reported in cubic millimeters. We double checked lesions on T2-weighted images to increase the confidence level in lesion identification.
To account for cortical atrophy in patients, we also calculated the peripheral gray matter volumes from 3DT1 images in both patients and HS using SienaX v2.6, part of FSL. 33 We first stripped non–brain tissue and then used the brain and skull images to estimate the scaling between the individual’s image and standard space. We then ran tissue segmentation to estimate the volume of brain tissue and multiplied this by the estimated scaling factor to reduce head-size-related variability between individuals.
DTI Analysis
The images obtained were processed using the FMRIB’s Diffusion Toolbox FDT v2.0, part of FSL. 34 Individual volume images were concatenated in a unique 4D volume and processed with eddy current correction and automatic brain extraction. Subsequently, DTIFIT, part of FMRIB’s Diffusion Toolbox (http://www.fmrib.ox.ac.uk/fsl/fdt), was used to fit a diffusion tensor model at each voxel and generate maps of fractional anisotropy (FA), mean diffusivity, and axial and radial diffusivity for all individuals. FA maps were fed into the Tract-Based Spatial Statistic (TBSS) tool, also part of the FSL. The FA maps of all individuals were aligned into a common space by nonlinear registration and averaged to obtain a mean FA skeleton, onto which each individual’s aligned FA maps were projected. A voxelwise cross-subject statistical analysis was then performed to compare MS patients and HS and identify the relationship between FA and mean z-values of SMN and CBN in all individuals. Differences in FA between patients and HS were assessed by using randomize, with the unpaired t test, corrected for multiple comparisons. The relationships between FA and functional data in patients were investigated by linear regression: mean z-values of SMN and CBN (baseline and RTF increase) were entered separately in the 1-sample t test as variables of interest. The number of permutations was 5000. The resulting statistical maps threshold was set at P <.05, with FWE correction for multiple comparisons. Significant white matter (WM) tracts were localized by using WM Atlas in FSL.
We finally used the FA and mean diffusivity maps of every individual to obtain an individual mean value for each parameter within the resulting skeleton; these values were then entered in a nonparametric group comparison (Mann-Whitney U test).
Statistics
Differences in demographics and DTI measures between groups were assessed by the Mann-Whitney U test. Within-group changes in RS parameter estimates before and after the motor task were tested by the Wilcoxon rank-sum test. Finally, correlations between RS parameter estimates and clinical/radiological variables were assessed by Spearman rank correlation. The statistical threshold was set at P < .05.
Results
Demographic, Clinical, and MRI Characteristics
We studied 20 MS patients and 14 controls, after having excluded 2 RRMS patients because of low quality of fMRI images. Demographic, clinical, and radiological characteristics of the individuals studied are shown in Table 1. Patients showed a significantly poorer performance in both 9HPT-DH and 9HPT-NDH with respect to controls. Mean FA and mean diffusivity values within the TBSS skeleton were not different between the 2 groups. No significant cortical grey matter (GM) volume decreases were observed in RRMS with respect to HS. TBSS analysis revealed lower FA in patients than in HS, located in the body and splenium of the corpus callosum, inferior longitudinal fasciculus bilaterally (mainly left sided), and left-superior longitudinal fasciculus (Figure 1A).
Demographic and Clinical/Radiological Characteristics of 14 Healthy Individuals and 20 Patients With Early MS Enrolled in the Study.
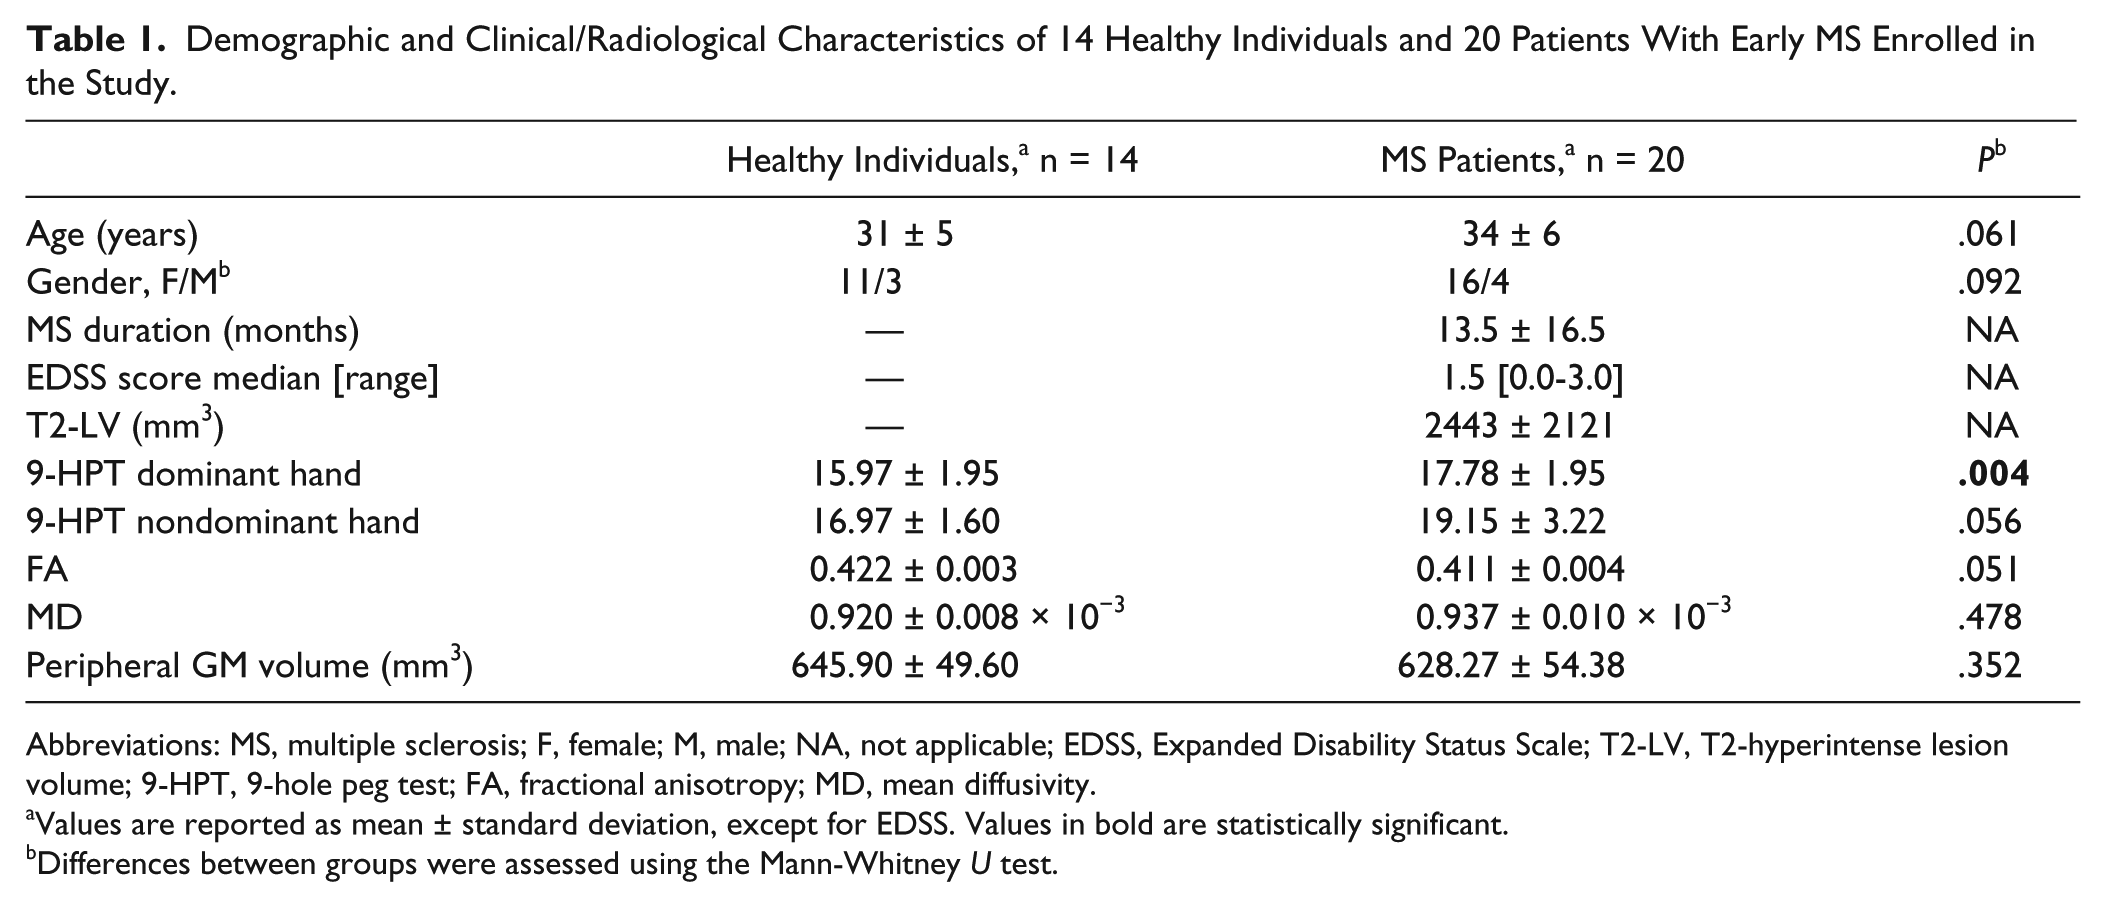
Abbreviations: MS, multiple sclerosis; F, female; M, male; NA, not applicable; EDSS, Expanded Disability Status Scale; T2-LV, T2-hyperintense lesion volume; 9-HPT, 9-hole peg test; FA, fractional anisotropy; MD, mean diffusivity.
Values are reported as mean ± standard deviation, except for EDSS. Values in bold are statistically significant.
Differences between groups were assessed using the Mann-Whitney U test.
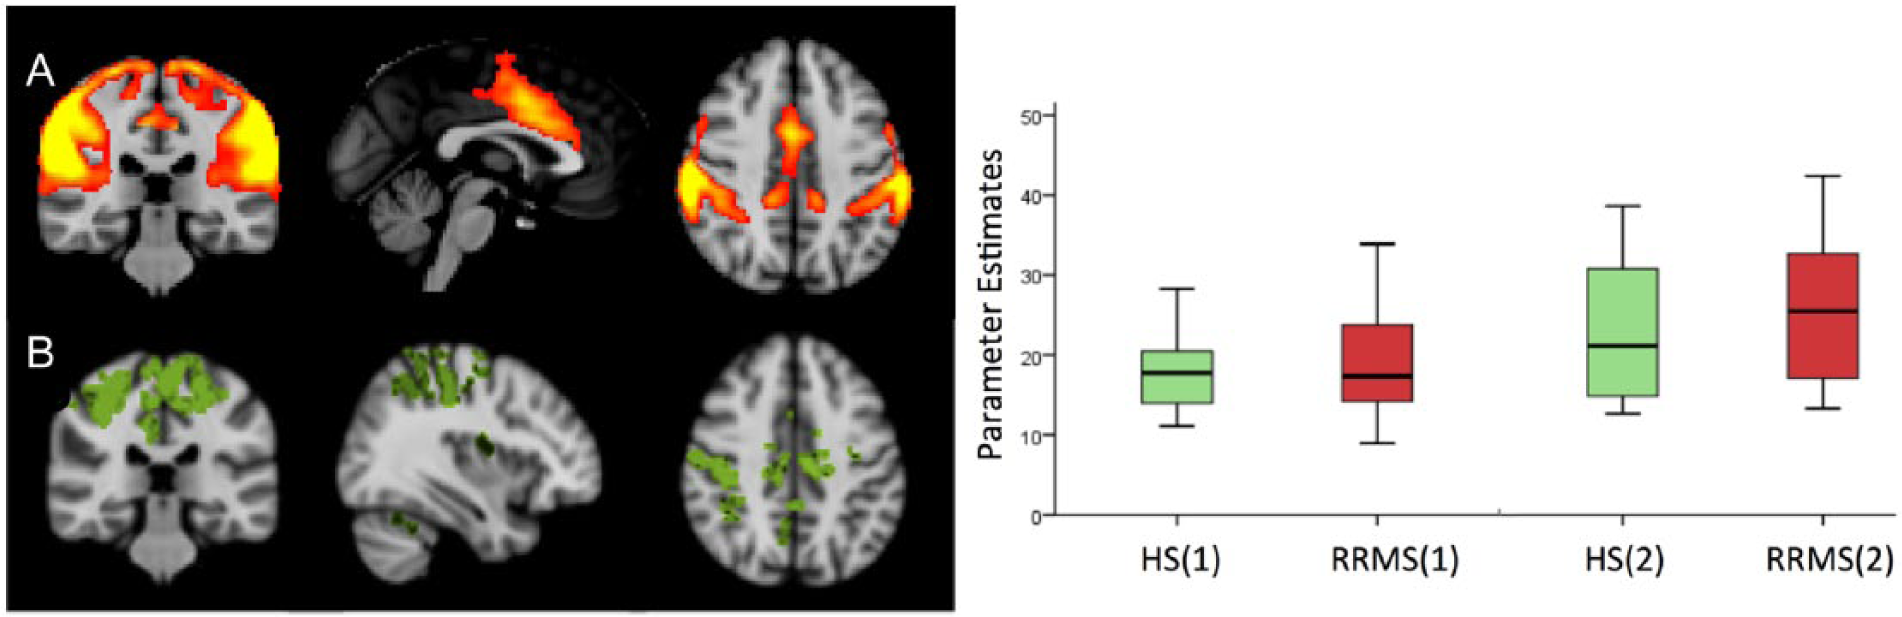
A. The ICA component corresponding to the SMN, obtained from all individuals/runs. B. Areas of significant RS-FC post-RTF increase in HS, located in the right postcentral gyrus and bilaterally in the anterior cingulate cortex, supplementary motor area, and precuneusa. In the plot: parameter estimates of RS-FC at pre-RTF and post-RTF in both groups. The post-RTF increase in the SMN connectivity was statistically significant in both groups (P < .05, by Wilcoxon rank-sum test).
Resting-State FC
At pre-RTF there were no significant differences in RS-FC in either the SMN or in the CBN between patients and HS. Patients showed significantly greater RS-FC than HS in the auditory and visual RSNs. In the SMN, HS showed a significant post-RTF increase in RS-FC, located in the right postcentral gyrus and bilaterally in the anterior cingulate cortex, supplementary motor area, and precuneus (P < .05 FWE corrected; Figure 2B). No significant post-RTF changes were observed in RRMS at this level of significance; however, analysis of parameter estimates showed a significant post-RTF increase in both groups, with no significant between-group differences (Figure 2).
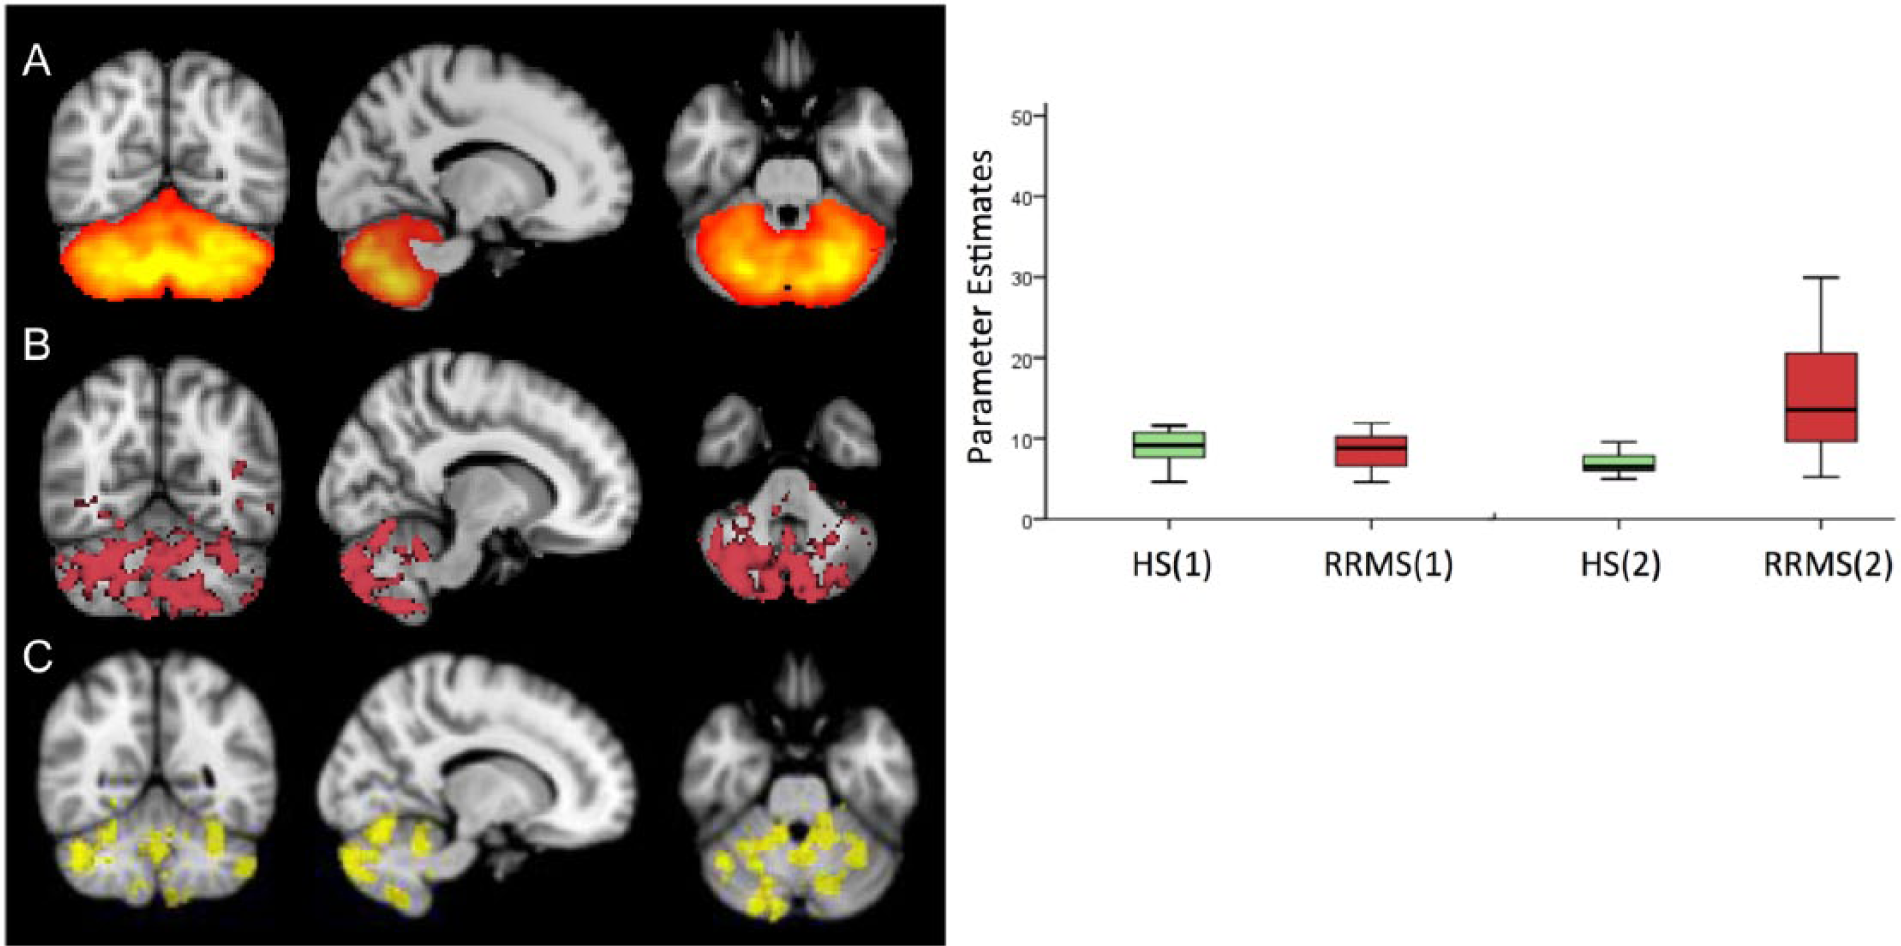
A. The ICA component corresponding to the CBN, obtained from all individuals/runs. B. Areas of significant RS-FC post-RTF increase in RRMS, diffusely involving the cerebelluma C. Areas of significant differences (RRMS > HS) in RS-FC post-RTF increase, involving crus I/II, hemispheric lobules VI, VIIb, and IX, bilaterally)a. In the plot: parameter estimates of RS-FC at pre-RTF and post-RTF in both groups. The post-RTF increase in the CBN connectivity was statistically significant in RRMS but not in HS. (P < .05, by Wilcoxon rank-sum test).
In the CBN, HS did not show any significant post-RTF RS-FC change, whereas RRMS showed a significant post-RTF RS-FC increase diffusely involving the cerebellum (Figure 3B). The between-group analysis (RRMS vs HS) showed that the post-RTF increase in RS-FC was significantly greater in RRMS than in HS in crus I/II, hemispheric lobules VI, VIIb, and IX, bilaterally (P < .05 FWE corrected; Figure 3C).
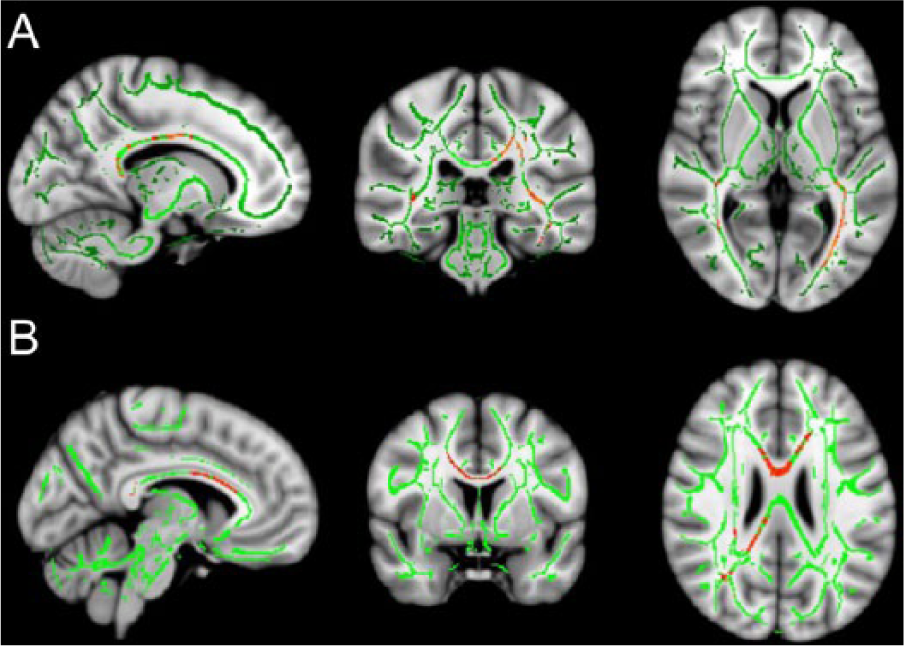
TBSS analysis: (A) lower FA (red) in RRMS patients than in HS within the FA skeleton (green), located in the body and splenium of the corpus callosum, inferior longitudinal fasciculus bilaterally (mainly left-sided), and left superior longitudinal fasciculus; (B) significant direct correlation (red) between FA values and post-RTF increase in SMN, mainly involving the corpus callosum in patients (P < .05).
In the remaining 7 RSNs, no significant post-RTF RS-FC changes were observed in the DMN and visual network either in HS or in RRMS. A significant post-RTF increase of RS-FC was found in the auditory, right and left frontoparietal, ventral-dorsal attention, and executive function only in RRMS, with no significant between-group differences. A significant correlation between the RS-FC in CBN and SMN was found only after the RTF and only in patients (rs = 0.743; P = .0002; Table 2).
Mean Z Values in the Cerebellar and Sensorimotor RSNs’ Connectivity Maps in Healthy Individuals and Patients With Early MS, and Correlation Coefficients. a
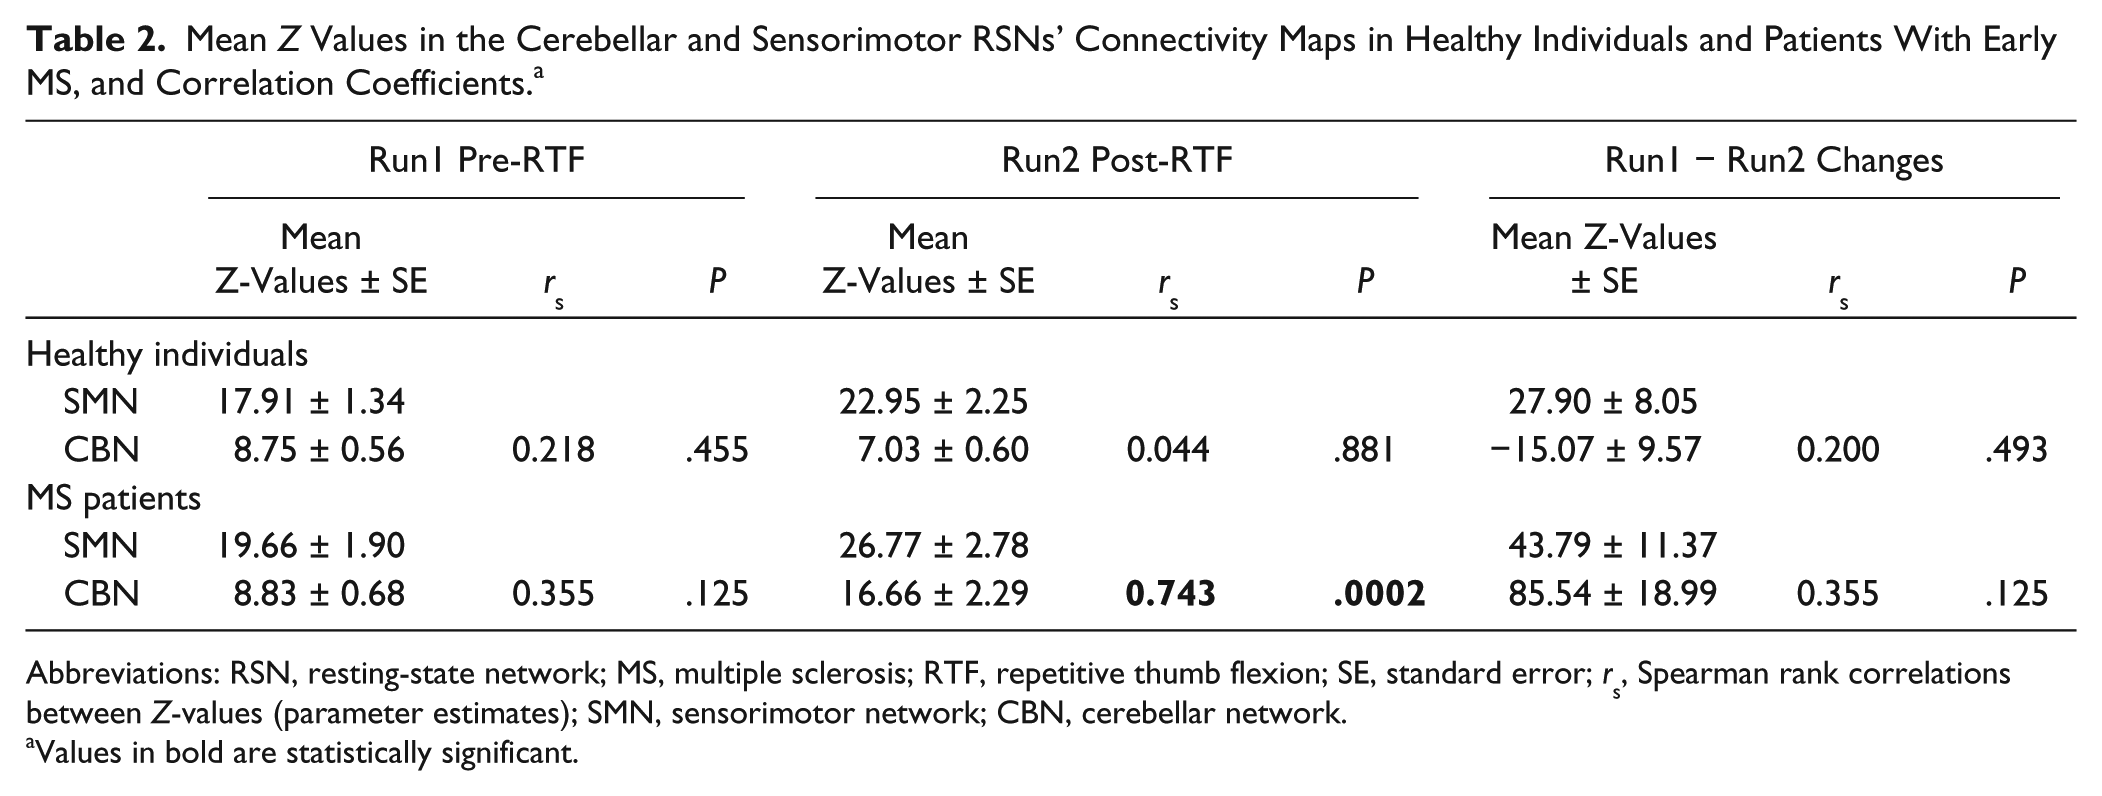
Abbreviations: RSN, resting-state network; MS, multiple sclerosis; RTF, repetitive thumb flexion; SE, standard error; rs, Spearman rank correlations between Z-values (parameter estimates); SMN, sensorimotor network; CBN, cerebellar network.
Values in bold are statistically significant.
The post-RTF increase of RS-FC in CBN and SMN did not significantly correlate with the performance at 9HPT in either group. A significant inverse correlation was found between the post-RTF increase of RS-FC in the SMN and T2-LV (rs = −0.588; P = .006; Figure 4).
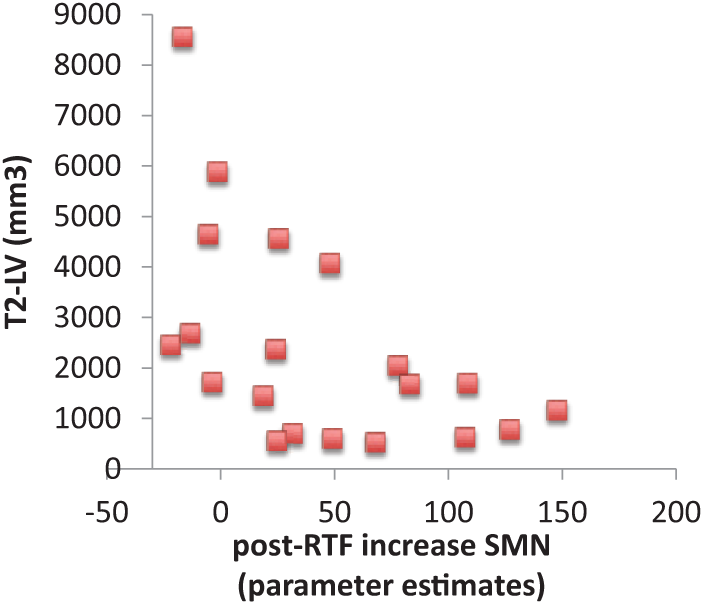
Correlations of SMN parameter estimates with structural damage in RRMS, as assessed by T2-LV (rs = −0.59; P = .006, Spearman rank correlation).
TBSS analysis revealed a significant direct correlation between FA values and post-RTF increase in SMN, mainly involving the corpus callosum (Figure 1B). No significant correlations were found between post-RTF increase of RS-FC in the remaining RSNs and clinical/radiological variables.
Discussion
Our study shows that, although there are no pretraining RS-FC differences between controls and early MS patients in the SMN and the CBN, differences become manifest after a simple repetitive motor task. Whereas the SMN showed a trend for a post-RTF FC increase in both groups (statistically significant only in HS), the CBN FC significantly increased only in RRMS.
The cerebellum acts by refining the rate, rhythm, and force of motor actions. 35 A simple hand movement, as that constituting our 25-minute motor task, may require more cerebellar participation and control in patients than in HS. In other words, greater cerebellar neuron synchronization should be required to reach automaticity (ie, to permit rapid, coordinated, and rhythmic movements). In fact, after the motor task, patients showed a significant correlation between RS-FC of the SMN and CBN, suggestive of an emergent internetwork synchronization. This interpretation is also supported by the fact that cerebellar areas of significant post-RTF increase in patients are those that have been described as functionally implied in motor control.36,37
Task-induced FC increase within the SMN observed in HS should represent a short-term adaptation of this network to repetitive movements. 9 In patients, the post-RTF increase in the same RSN correlated negatively with the structural damage, as assessed by measures of LV and FA. This finding suggests that short-term adaptation to repetitive movements is compromised in patients with a more severe structural damage as a result of anatomical disconnections, especially with the corpus callosum involvement, which suggests transhemispheric disruption. 38
Albert et al, 21 in a study on healthy people, reported that a visuomotor training, but not simple motor performance, can modulate the resting activity in the cerebellar and frontoparietal networks. Accordingly, in our study, healthy controls did not show post-RTF modulations in the cerebellum. Furthermore, Albert et al hypothesized that the CBN identification after task, but not at pretraining, was a result of its activation by learning. The CBN has been recently identified as a distinct RSN, 13 and in fact, it was present in both patients and controls at pretraining in our study.
The effects of a simple motor task, similar to ours, in MS patients have been so far reported only in task-related fMRI studies.9,10 Morgen et al 10 showed that, unlike healthy individuals, MS patients did not show any decrease in motor activation in the contralateral primary motor and parietal cortices after the motor training. They interpreted the cortical activation decrease in the primary motor cortex in healthy individuals as an adaption to a more automated, simple hand movement that did not occur in patients. Instead, in a multicentric study, Mancini et al 9 showed that motor task induces a progressive cerebral activation decrease in areas of the sensorimotor system in both healthy individuals and MS patients, without any difference between groups, suggesting that the physiological process of short-term adaptation to a simple motor task is preserved in MS. Our study adds another piece of information to the knowledge of the effects that a simple repetitive motor task induces in the brain, by showing the differences between MS patients and healthy controls in 2 motor-related RSNs and pointing to the cerebellar network as functionally relevant.
Our study presents some methodological limitations. First, we did not account for muscle fatigue, which, according to Peltier et al, 39 can induce decreased interhemispheric FC between the primary motor areas. However, the alternation of rest and RTF periods should have limited this effect.
Second, RS fMRI in an eyes-open condition could have influenced RS-FC in posterior areas, especially in the DMN and visual cortex.40,41 However, there is no evidence for an influence of the eyes-open condition in motor-related RSNs. Vice versa, it presents the advantage to limit saccadic eye movements and to control wakefulness.
A RSN is a fluctuating status of the resting brain, which may be modified by external stimuli as well as behavioral and mental activity. 19 Our study shows that diffuse brain damage and the consequent disconnection between cerebral areas can alter the functional adaptation of brain resting activity to a simple repetitive motor task in specific networks and their interplay.
Our results also show a way to unveil subtle, subclinical functional connectivity alterations occurring in the motor function–related RSNs, in the early phases of MS. Such changes can be unmasked by a simple motor task that “stresses” connectivity modifications, expressed in both within- and between-network response. In a rehabilitation setting, the resting-state MRI response to a standardized, simple task could provide a dynamic evaluation of baseline brain network efficiency and, thus, a biomarker for an MRI-informed intervention. Still, there is much to be discovered on physiological mechanisms of network integration with overall brain function and their impact on specific functions, especially in dynamic settings.
Footnotes
Acknowledgements
The authors wish to thank Dr Luca Prosperini for his advice and elucidations on clinical parameters and Mr Maurizio Carmellini for the precious support in acquiring the MRI data.
Declaration of Conflicting Interests
The authors declared no potential conflicts of interest with respect to the research, authorship, and/or publication of this article.
Funding
The authors disclosed receipt of the following financial support for the research, authorship, and/or publication of this article: The study was supported by a grant from Merck Serono Switzerland and by the Du Pre’ Grant from the MS International Federation (VT) and partly by a grant from FISM (Italian Federation of Multiple Sclerosis) n. 2012/R/12 (PP). Prof. Carlo Pozzilli also received consulting and lecture fees from Sanofi-Aventis, Biogen Idec, Bayer Schering, Merck-Serono, and Novartis; he also received research funding from Sanofi-Aventis, Merck Serono, and Bayer Schering.