
Abstract
Background. Prognostic measures of long-term motor recovery are important in patients with stroke presenting with severe hemiplegia. Objective. We aimed to investigate whether initial power spectral density (PSD) analysis of resting-state functional magnetic resonance (fMRI) data can provide a sensitive prognostic predictor in patients with subacute stroke with severe hand disability. Methods. Twelve patients with good recovery, 14 patients with poor recovery, and 12 healthy subjects were included. PSD analysis was performed using resting-state fMRI data. Contralesional and ipsilesional PSD in the motor cortex were measured. Pearson correlation analysis was performed to assess a possible association between the difference in ipsilesional versus contralesional PSD and motor outcomes. A receiver operating characteristic (ROC) curve was constructed to estimate the discriminative value of the difference between the ipsilesional PSD and the contralesional PSD for good versus poor recovery. Results. There were no differences in PSD between the contralesional and ipsilesional hemispheres in the good recovery group (P = .77). In contrast, there were significant differences in PSD between the 2 hemispheres in the poor recovery group (P = .07). The difference in PSD between the 2 hemispheres had a positive correlation with post Brunnstrom stage scores. ROC analysis showed that the difference in PSD between the 2 hemispheres was sensitive in discriminating good versus poor recovery. Conclusion. The present study suggests that PSD in the motor cortex may be a sensitive predictor of late-onset motor recovery following stroke.
Keywords
Introduction
Functions affected by paralysis are restored immediately after stroke.1,2 More than 90% of this recovery usually occurs within 3 months of stroke. However, functional recovery may continue until several years later through patient effort and rehabilitation. Even though it is rare, a small number of patients with stroke with severe hemiplegia have shown late-onset motor recovery of the upper limb. The prognosis for motor recovery of the arm and the hand is known to be poor, and most upper-limb motor recovery occurs relatively early (within 3-4 weeks after the onset of stroke).3-5 Therefore, it is important to decide how long rehabilitation treatment for upper-limb recovery should be continued. As a result, many studies have attempted to find strong predictive measures reflecting functional long-term motor recovery to help patients with stroke presenting with severe hemiplegia.
Several functional magnetic resonance imaging (fMRI) studies, including resting-state fMRI studies, have been performed to find objective measures of motor recovery in patients with stroke.6-11 Functional connectivity (FC) analysis uses resting-state fMRI data to map the spatial distribution of the temporal correlations of spontaneous fluctuations of the blood oxygenation level–dependent (BOLD) signal across the brain.12-14 From FC analysis, stroke patients with motor deficit showed initial decrease of FC value in interhemispheric motor cortex (M1) and increase of FC between ipsilesional M1 and ipsilesional secondary motor area.15-18 Power spectral density (PSD) analysis is another approach to study the frequency distribution of signal variance in BOLD time series. PSD may also be used as a measure of regional intrinsic neuronal activity at resting state.19-21 There have been resting-state fMRI studies using PSD analysis in animal stroke models.22,23 These animal studies suggested that PSD may have potential for estimating viability and prognosis of acute stroke. A human study using PSD analysis demonstrated that PSD has a potential to estimate the viability of ischemic brain tissue after stroke. 24
In the current study, we aimed to investigate whether differences in PSD between ipsilesional M1 and contralesional M1 may reflect motor recovery in patients with subacute stroke. In particular, we aimed to determine whether initial PSD measurements are useful predictors of prognosis in patients with subacute stroke with severe hand disability.
Methods
Participants
Twenty-six patients with first-time stroke and 12 healthy controls were enrolled in the study. The candidates were identified at the stroke inpatient service at Kyoungpook National University Hospital. Experiments were conducted with the written consent of each participant and were approved by the Institutional Review Board of Kyungpook National University Hospital.
The inclusion criteria were (a) first-onset unilateral ischemic infarction affecting the middle cerebral artery territory, (b) age >18 years, (c) 3 weeks after stroke onset, and (d) no current hand function. At the time of enrollment, none of the patients was able to move his or her hand at all (Brunnstrom stage 1 [flaccidity or absence of active finger movement] and no motor-evoked potential in the affected hand). The demographic, clinical, and lesion characteristics for all patients are summarized in Table 1. At 6 months after stroke, a second hand function assessment was performed using the Brunnstrom staging system. The exclusion criteria were severe prior stroke history; medical illness; psychological disease, such as dementia, schizophrenia, and bipolar disorder; and contraindication for fMRI.
Demographic, Clinical, and Lesion Characteristics of the Stroke Patients Included.
Abbreviations: HD, handedness; BS, Brunnstrom stage; MCA, middle cerebral artery; R, right; L, left; BG, basal ganglia; CR, corona radiata; SD, standard deviation.
Twelve patients with good recovery after stroke (4 men and 8 women; age, 60.4 ± 15.1 years), 14 patients with poor recovery after stroke (8 men and 6 women; age, 63.2 ± 8.8 years), and 12 healthy subjects (4 men and 8 women; age, 60.3 ± 7.2 years) were included in this study. There were no sex (P = .358) or age (P = 0.731) differences between the groups. All patients underwent resting-state fMRI about one month (26.1 ± 7.9 days) after the onset of the stroke.
Motor Performance Measurement
Clinical parameters of hand recovery were measured 3 weeks and 6 months after stroke. Patients were divided into the good or poor recovery groups, based on Brunnstrom stage, 6 months after the onset of the stroke. Patients with Brunnstrom stage 4 (lateral prehension with release by thumb movement or semivoluntary finger extension of small range of motion) or 5 (palmar prehension or cylindrical/spherical grasp with limited function or voluntary mass finger extension of variable range) were considered to have good recovery, while those with Brunnstrom stage 1 or 2 (synergic finger flexion beginning) or 3 (maximal synergy pattern) were considered to have poor recovery.
fMRI Data Acquisition
The fMRI experiments were performed using a 3.0 T GE Signa Exite (Milwaukee, WI, USA) scanner. Resting-state and motor task fMRI data from the subjects were used to define the location of the M1 area.
To obtain resting-state fMRI data, the participants were instructed to close their eyes during scanning without falling asleep. The echo planar imaging (EPI) sequence was used for BOLD data acquisition, using the following parameters: echo time (TE) = 30 ms, repetition time (TR) = 2000 ms, flip angle (FA) = 90°, field of view (FOV) = 22 cm, acquisition matrix = 64 × 64, and 4 mm thickness with no gap. The total scan time, including a dummy scan with 6 volumes, was 8 minutes 12 seconds.
Participants performed a motor task paradigm during scanning to define the location of a region if interest (ROI) delimiting the M1 area. This motor task consisted of 3 active periods and 3 resting periods. The active periods were alternated with the resting periods, and each period lasted 30 seconds. The participants were instructed to perform repetitive flexion and extension of the right finger during the first scan and the same task with the left finger during the second scan. Although the repetitive hand movements were self-paced by the patients during the active movement condition, there was a training session to keep the frequency of the repetitive hand movement at 1 Hz before the fMRI session. The beginning and the end of each period were cued using a light touch on the hand. The hand that the participant was unable to move underwent passive movement with the help of an assistant researcher. For passive movement, the frequency of the repetitive hand movement was approximately 1 Hz. In the motor task fMRI, the EPI sequence was used for data acquisition. The following parameters were used: TE = 40 ms, TR = 3000 ms, FA = 90°, FOV = 21 cm, acquisition matrix = 64 × 64, and 4 mm thickness with no gap. The total scan time was 4 minutes 12 seconds, including 4 dummy scan volumes. For structural reference, anatomical T1-weighted images were obtained using a 3-dimensional fast spoiled gradient echo sequence with the following parameters: TE = 3 ms, TR = 7.8 ms, FA = 20°, FOV = 21 cm, acquisition matrix = 256 × 256, 1.3 mm thickness with no gap.
Lesion Volumes
T1-weighted images were co-registered and normalized to the T1-weighted template included in the statistical parametric mapping (SPM) 12 software package. Preprocessed T1-weighted images were used as references for masking the area of the stroke lesion. The lesions were manually drawn by a physician specialized in stroke assessment who was blinded to the purpose of the study. Voxels used for masking lesions on each subject were counted to calculate the volume of the lesion. There were no significant differences in lesions’ volume between the good recovery group (47.81 ± 59.7 cm3) and the poor recovery group (116.7 ± 138.2 cm3) (P = .193).
PSD Analysis
Preprocessing and statistical analyses of the resting fMRI and motor task fMRI were performed using the SPM12 (http://www.fil.ion.ucl.ac.uk/spm/). The images were initially preprocessed by using slice timing correction (to account for the image acquisition delay between slices), followed by realignment and unwarping (to correct for head motion and distortion based on the first image and to obtain a translation parameter). The functional images were then co-registered to the structural to improve normalization. The images were normalized to a Montreal Neurological Institute template, and spatial smoothing was performed using an 8-mm full width at half maximum Gaussian kernel.
To define the M1 ROI in each patient, the preprocessed motor task data were subjected to a first-level analysis of individual active maps using a general linear model. A boxcar function for neural activity was convolved using a hemodynamic response function. The SPM{t}s activation map was generated for each subject. The contrast map was constructed by subtracting the data for periods of active task performance from those for periods of rest. The SPM{t}s map threshold was set at P < .05 and the cluster size was set to 32. In contrast, M1 ROI coordinates in the control group were defined by using the known coordinates of the M1, as described in the literature. 25 The selected M1 coordinates were used to define the ROI as a sphere with a radius of 5 mm for each participant using MarsBaR (http://marsbar.sourceforge.net). ROIs for the supplementary motor area (SMA) and the premotor area were also defined using a similar procedure.
PSD analysis was performed on the preprocessed resting fMRI data using a previously reported method implemented in Matlab. 19 To remove head motion artefacts at each voxel, the general linear model with weighted least squares in the SPM toolbox was used with a translation parameter obtained from the realignment and unwarping step. Detrending was performed in Matlab to remove the linear trends at each voxel. The PSD of the BOLD signal in the 4D resting fMRI was calculated in a voxel-wise manner using the Welch’s method. According to Nyquist theory, the total frequency range is 0-0.25Hz when TR is 2 seconds (= 2-second sampling intervals). At each voxel, the PSD of the low-frequency band (0.01-0.1 Hz), which is the frequency used in many rs-fMRI analyses was normalized using the following equation 19 :
The PSD value was extracted from the M1 ROI as defined for each subject, for subsequent statistical analysis.
Denoised resting fMRI data was also used to obtain the functional connectivity (FC) score. An individual FC score, reflecting connectivity between contralesional and ipsilesional M1 areas in the low-frequency band (0.01-0.1 Hz), was obtained from the first step of the analysis pipeline implemented in the functional connectivity toolbox (CONN, web.mit.edu/swg/software.htm).
Statistical Analysis
All statistical analyses were performed using SPSS software version 20 (SPSS, Inc, Armonk, NY, USA). A significance level of P < .05 was used. Paired t tests were used to find significant differences between contralesional and ipsilesional PSD in each subject from the good recovery group, poor recovery group, and healthy group. Mann-Whitney test, which is nonparametric test, was used to test for statistical difference in lesion volumes between groups. Pearson correlation coefficients for the difference in PSD between the ipsilesional and contralesional hemispheres and the Brunnstrom stage score were calculated. Pearson correlation analysis was also performed to evaluate the relationship among PSD values, recovery, and lesion volumes. In addition, Pearson correlation coefficients for simple correlation analysis was calculated between contralesional PSD – ipsilesional PSD and the FC score. Then, a multiple linear regression analysis was used to investigate the relationships between contralesional PSD – ipsilesional PSD and FC score in a simple regression model. In this model, the FC score was input as a dependent variable, and contralesional PSD – ipsilesional PSD was input as independent variable. The validity of the model was defined for P < .05.
A receiver operating characteristic (ROC) curve was constructed and the area under the curve (AUC) calculated to estimate the value of the difference in PSD between the ipsilesional and contralesional hemispheres allowing to discriminate between the good and poor recovery groups. To obtain the optimal cutoff value, the distance between the point (sensitivity = 1, specificity = 1) and any point on the ROC curve was calculated.
Results
PSD
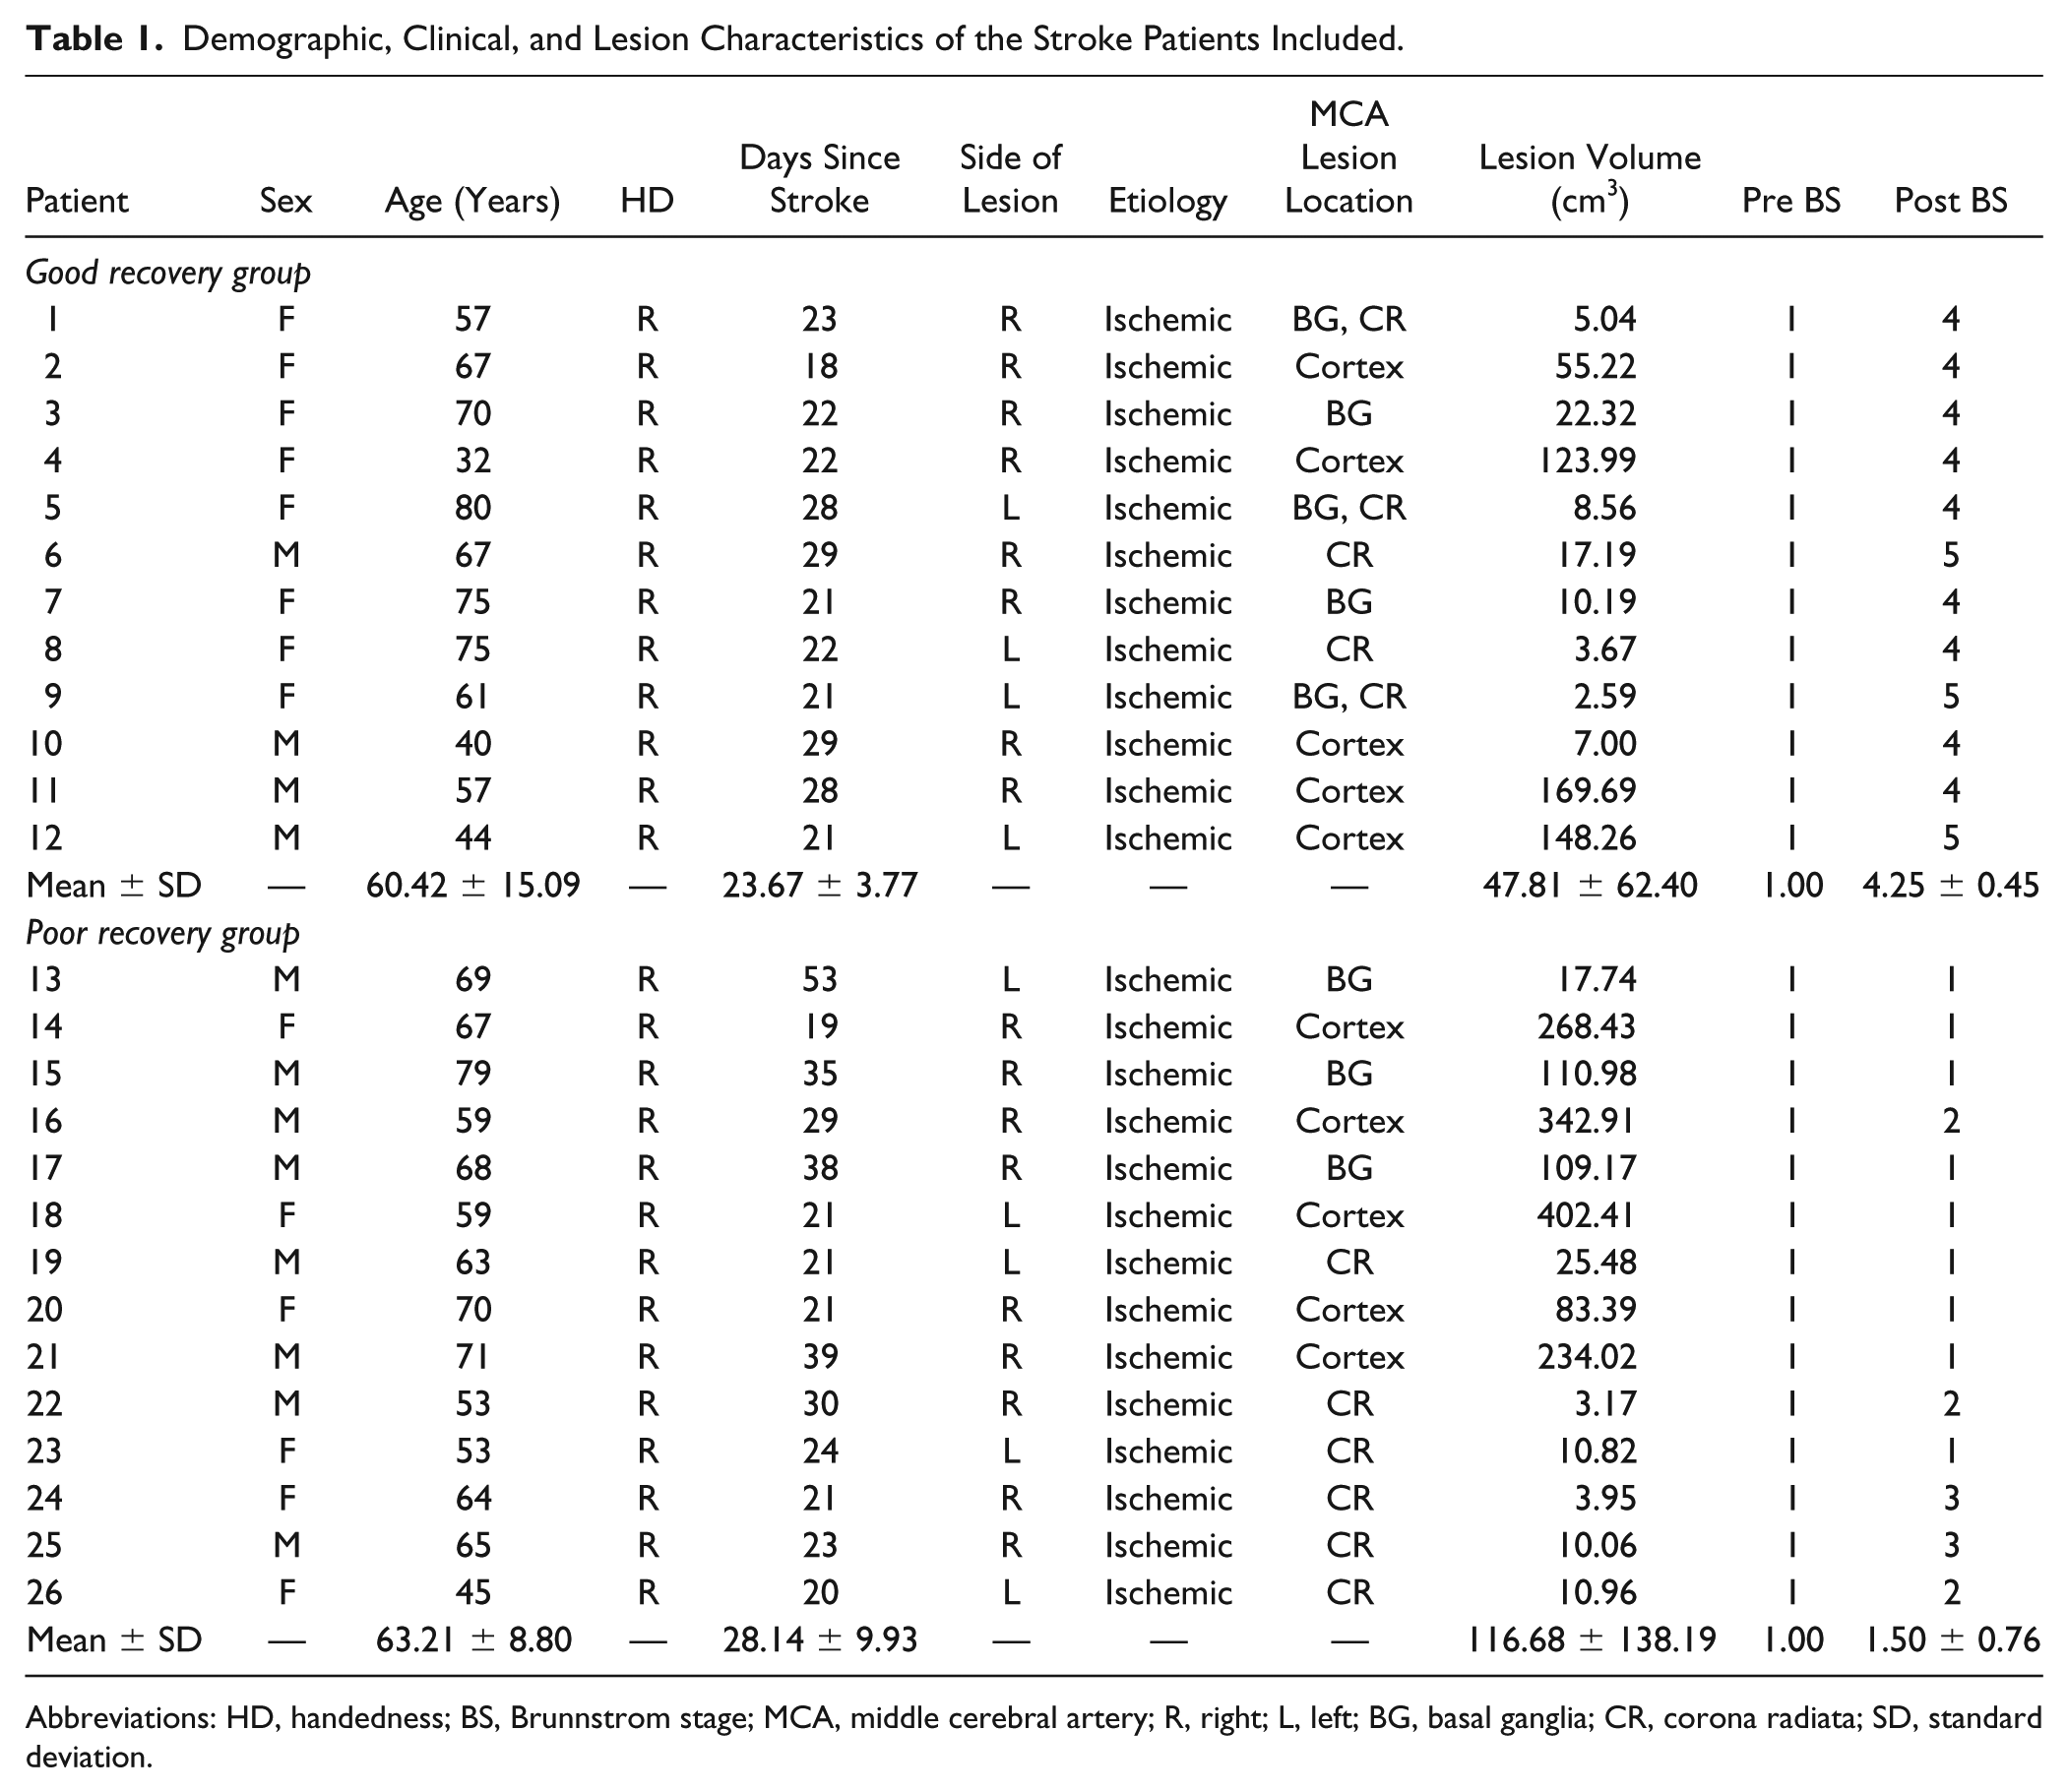
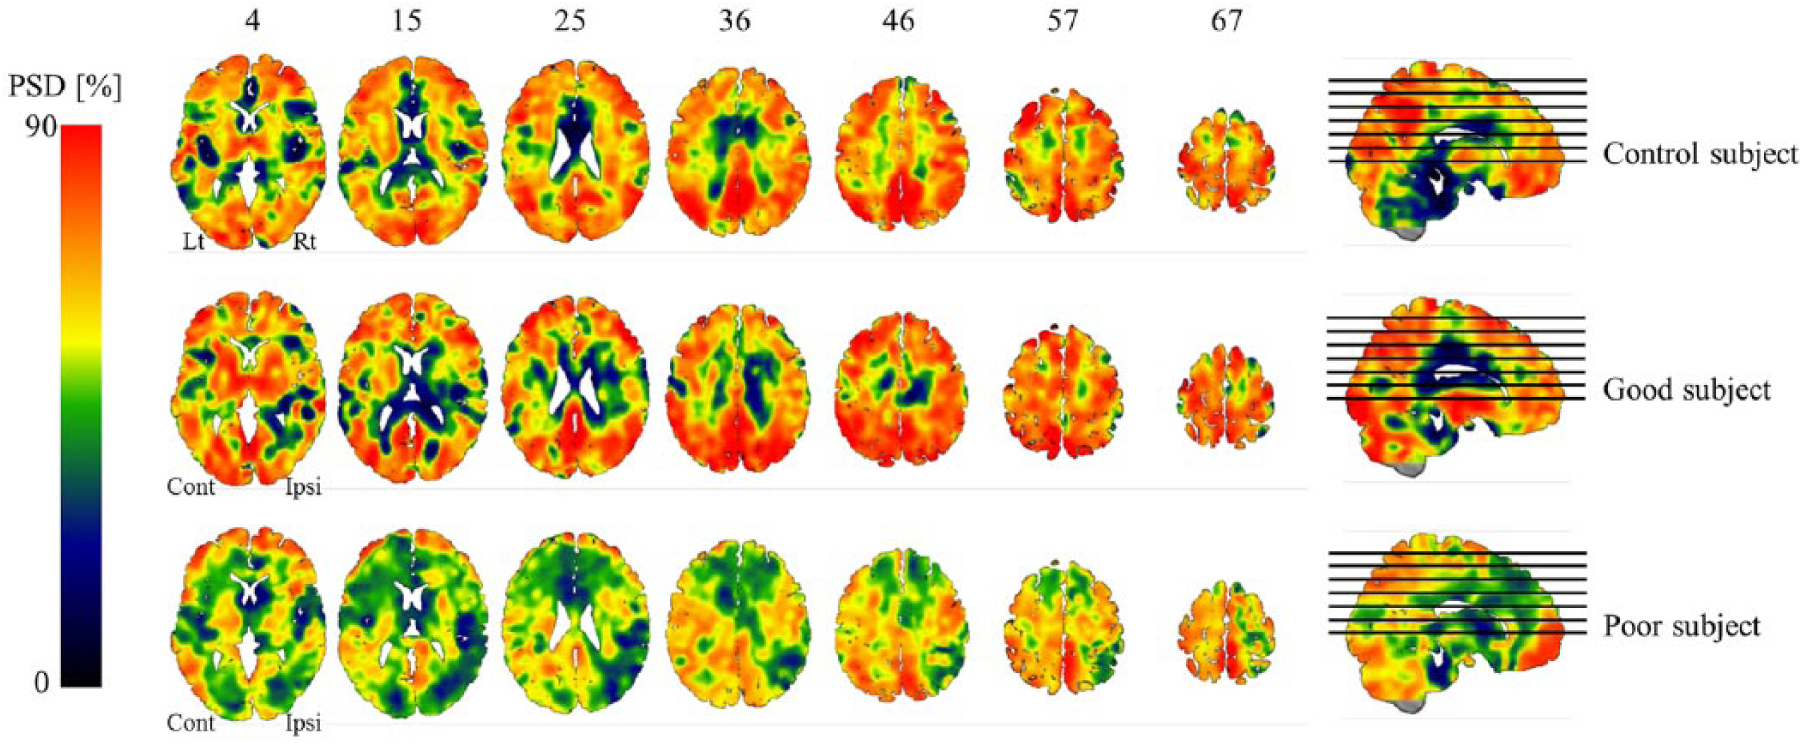
The PSD maps of a representative subject from each group are shown in Figure 1. For the M1 area, the contralesional and ipsilesional PSDs in the good recovery group were 73.91% ± 11.38% and 72.99% ± 10.65%, respectively. There was no significant difference between contralesional and ipsilesional PSDs (P = .770). Likewise, in the healthy group, there was no difference between left (78.11% ± 11.67%) and right hemisphere PSDs (76.55% ± 11.03%) (P = .348). In contrast, there was a statistically significant difference in PSD between the contralesional and ipsilesional hemispheres in the poor recovery group (72.44% ± 14.10% vs 82.03% ± 8.25%, respectively; P = .007) (Figure 2). For the SMA (Figure 3A), the contralesional and ipsilesional PSDs in the good recovery group were 65.69% ± 12.87% and 68.01% ± 10.96%, respectively. The contralesional and ipsilesional PSDs in the poor recovery group were 68.03% ± 9.82% and 72.41% ± 11.48%, respectively. There was no significant difference in these metrics either in the good recovery group (P = .327) or in the poor recovery group (P = .080). For the premotor area (Figure 3B), there was no difference between the contralesional (70.01% ± 11.78%) and ipsilesional PSDs (71.22% ± 7.96%) in the good recovery group (P = .658). Likewise, in the poor recovery group, there was no difference between contralesional (73.82% ± 12.21%) and ipsilesional PSDs (76.19% ± 10.30%) (P = .114).
Power spectral density (PSD) maps of a representative subject in each group (poor recovery, good recovery, and control). Lt, left hemisphere; Rt, right hemisphere; Cont, contralesional; Ipsi, ipsilesional.
Comparison of ipsilesional and contralesional power spectral densities (PSDs) in the good and poor recovery groups – in the control group comparisons between the left and right hemispheres are presented. Lt, left hemisphere; Rt, right hemisphere; Cont, contralesional; Ipsi, ipsilesional.
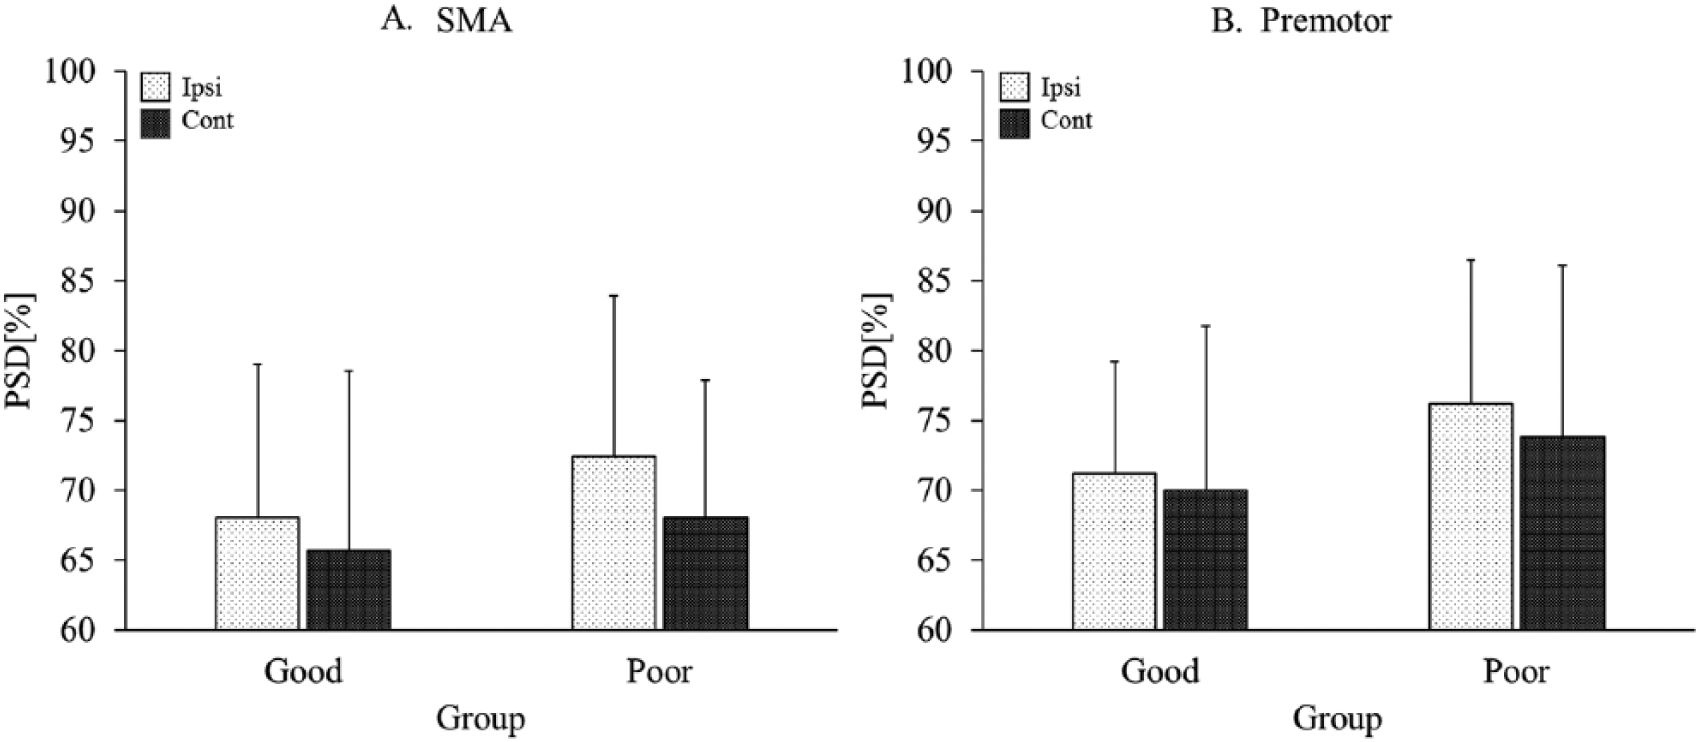
Comparison of ipsilesional and contralesional power spectral densities (PSDs) in the (A) supplementary motor area (SMA) and (B) premotor areas for each of the good and poor recovery groups. In the SMA, there was no significant difference either in the good (P = .327) or in the poor recovery groups (P = .080). In the premotor area, there was no difference either in the good (P = .658) or in the poor recovery groups (P = .114). Cont, contralesional; Ipsi, ipsilesional.
Correlation and ROC analyses
The difference in PSD between the contralesional and ipsilesional hemispheres in the M1 area was found to correlate positively with the post–Brunnstrom stage scores (r = 0.536, P = .005, Figure 4A). There was no correlation between the contralesional PSD – ipsilesional PSD indexes and the FC scores (r = 0.123, P = .462). In the linear regression analysis, R2, which is the proportion of variance in the dependent variable explained by the independent variable, was 0.015. It had a statistical meaning of the regression results (F = 0.554, P = .462). The contralesional PSD – ipsilesional PSD index was a poor predictor of the FC score (t = 0.744, P = .462). The difference in PSD between the contralesional and ipsilesional hemispheres had high sensitivity in the ROC analysis for discriminating between the good recovery and poor recovery groups (P = .035, Figure 4B). The AUC was 0.744. This AUC value is in the fair discrimination range. 10 The optimal cutoff value was −7.48%. This cutoff value provided the best combination of sensitivity (71.0%) and specificity (64.3%). The correlations between PSD values, recovery, and lesion volume are summarized in Table 2.
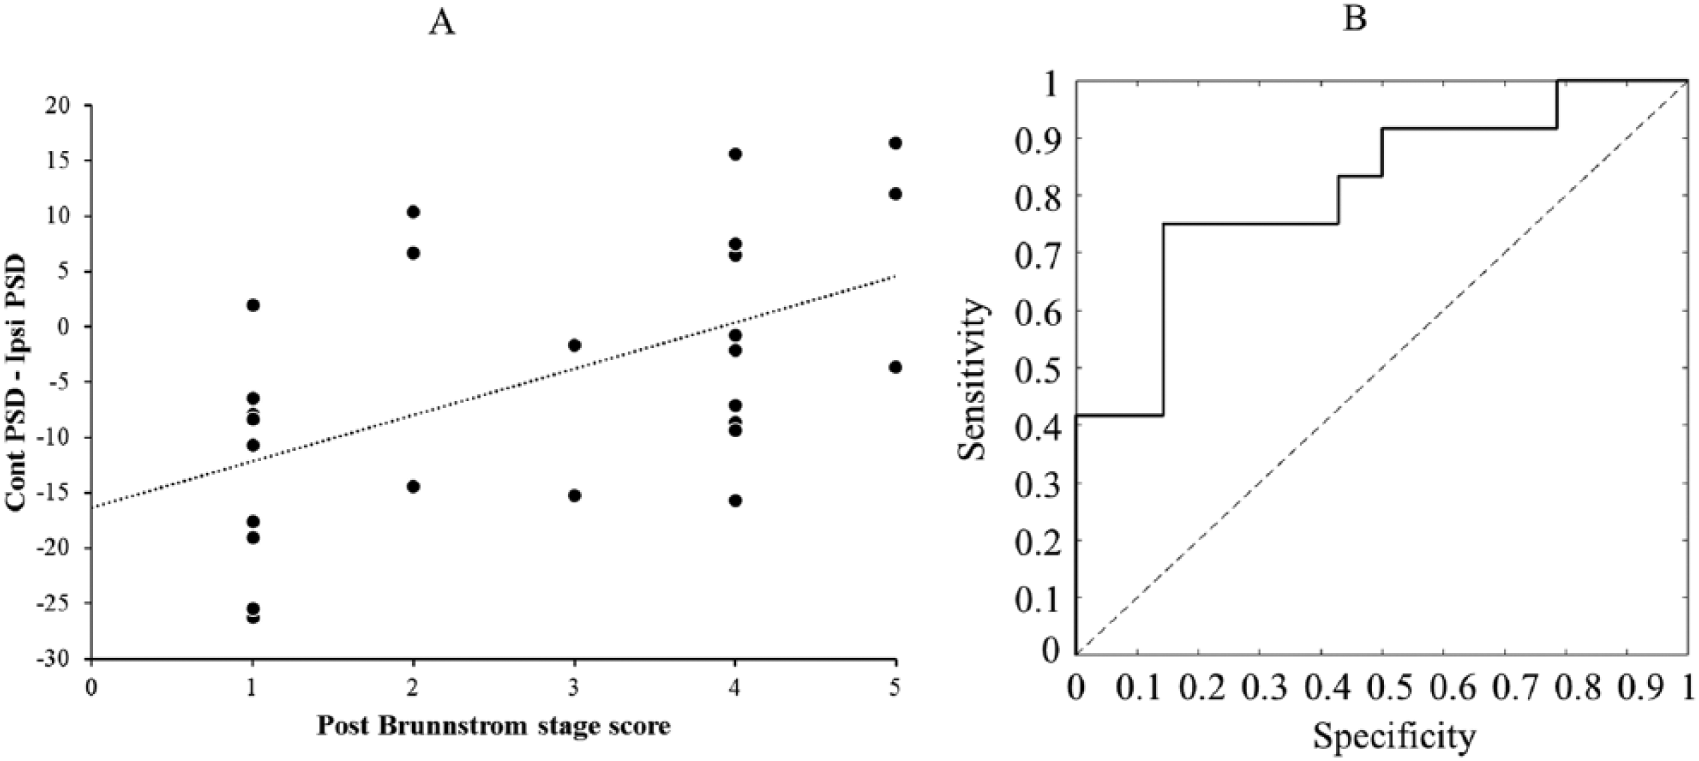
(A) Correlation between the interhemispheric power spectral density (PSD) difference and motor outcomes (r = 0.536, P = .005). (B) Receiver operating characteristic (ROC) analysis showed a combination of sensitivity (71.0%) and specificity (64.3%). Cont, contralesional; Ipsi, ipsilesional.
Correlation Between Each Parameter.
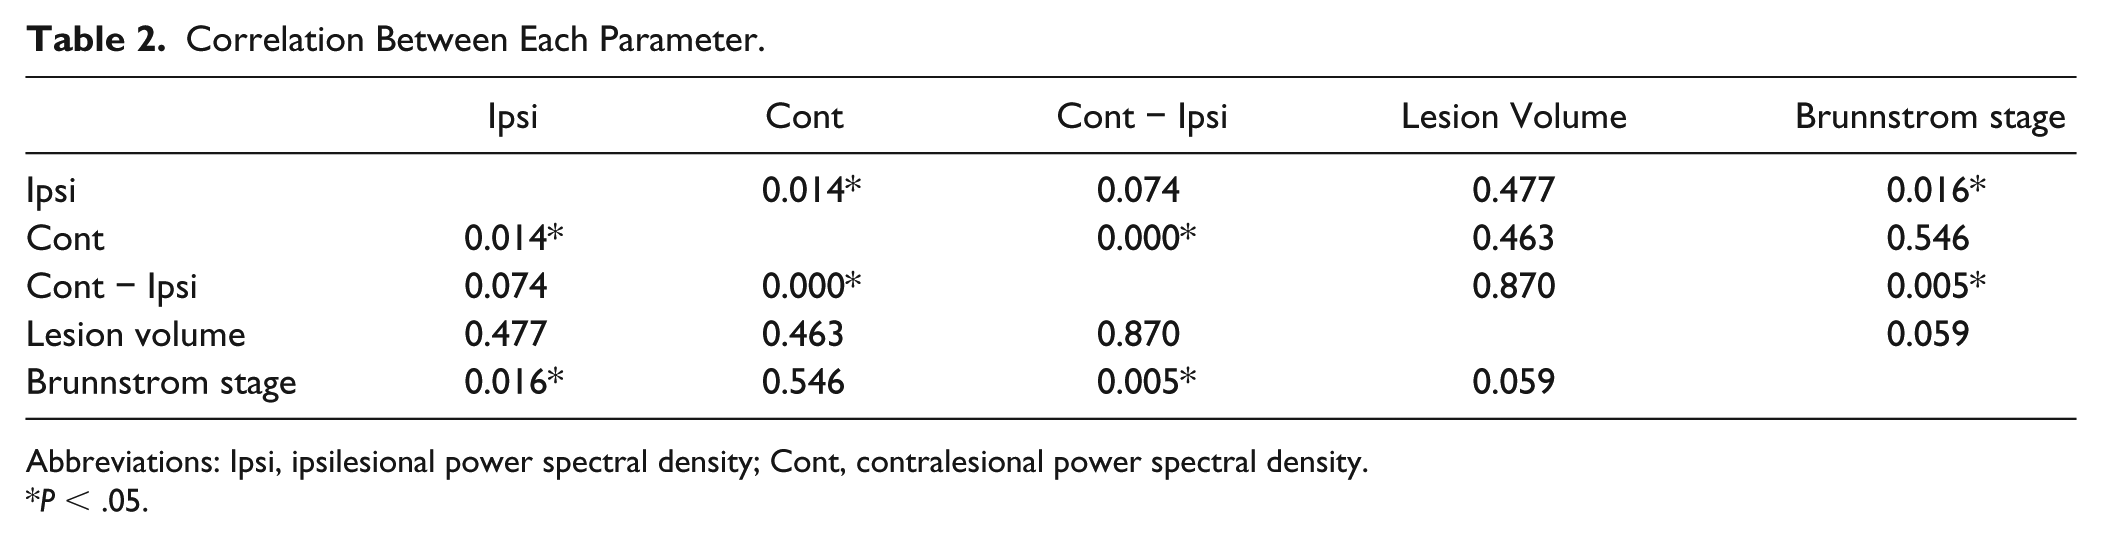
Abbreviations: Ipsi, ipsilesional power spectral density; Cont, contralesional power spectral density.
P < .05.
Discussion
In this study, we found a significant difference in PSD between the contralesional and ipsilesional hemispheres in the primary motor cortex (M1) in the poor recovery group, while no such difference could be observed in the good recovery group or in healthy controls, when right and left hemispheres were compared. Specifically, in the poor recovery group, PSD was much higher in the ipsilesional M1 than in the contralesional M1. In contrast, there was no significant difference of PSD between the contralesional M1 and the ipsilesional M1 in the good recovery group and between left hemisphere and right hemisphere in the healthy controls. Furthermore, we found a correlation between PSD and motor performance, indicating that a decrease in ipsilesional PSD was associated with motor improvements across all patients in both groups. Although the exact mechanism underlying this observation is not yet fully understood, several recent studies have shown that PSD in resting-state fMRI is strongly associated with spontaneous neural activity of the brain at rest.19,20 Based on our findings, we suggest that PSD in the motor cortex may be a sensitive predictor of late-onset motor recovery following stroke.
Several electroencephalography (EEG) and mangetoencephalography (MEG) studies demonstrated that stroke patients with poor outcomes have persistent, increased low-frequency oscillations at the acute and early/late subacute stages, suggesting predominant inhibitory mechanisms in the perilesional cortex.25-29 These EEG and MEG studies found that perilesional tissue can produce an abnormally large amount of high amplitude slow-wave activity. The presence of increased slow-wave activity is one potential indicator of cortical dysfunction in perilesional tissue associated with the long-term effects of stroke. Our findings in this study seem consistent with EEG and MEG studies since we found that ipsilesional PSD in the primary motor cortex was increased when compared with contralesional PSD in the poor recovery group. In addition, although we related the increase in PSD in the ipsilesional cortex to the resting-state spontaneous activity, there might be other possibilities. For example, the previous findings from EEG/MEG studies showed that the low frequency shifting in that signal, which is dominated by a highly periodic low-frequency oscillation (spectral slowing), can be related with poorer outcome of stroke recovery. Therefore, further studies investigating the possibility of a spectral slowing in PSD are warranted.
Based on these previous electrophysiological observations, one possible interpretation of our findings is that the high PSD in ipsilesional M1 reflects dysfunction in ipsilesional M1 regions in the poor recovery group. This interpretation is in line with the previous EEG/MEG findings in the extent that increased low frequency activity is one potential indicator of cortical dysfunction in perilesional tissue associated with stroke. Therefore, motor impairment after stroke is associated with dysfunction in the ipsilesional motor area. Another possible interpretation would be that the significant difference in PSD between the contralesional and ipsilesional M1 regions, particularly the high ipsilesional PSD in the poor recovery group, reflects unbalance in neural activity between M1 regions. Considering that coordinated neural activity is important for motor recovery,30,31 our results suggest that unbalanced PSD in patients with poor recovery may have a negative effect on motor recovery. Here, it is worth to note that the balance in PSD between the contralesional and ipsilesional M1 may not reflect the full interhemispheric interaction. By definition, FC is measured between two brain structures and thus reflects the interhemispheric interaction. Since we could not observe any significant correlation between PSD and FC scores in both M1 regions, we hypothesize that the difference in PSD did not reflect the interhemispheric interaction between the contralesional and ipsilesional M1 regions. However, this does not mean that FC may not be a good prognostic index for stroke patients.
FC analysis using resting-state fMRI demonstrated that the FC between the contralesional and ipsilesional M1 initially decreased in patients with stroke presenting with motor impairment and then increased during motor recovery.32,33 Therefore, FC parameters seem to reflect motor improvement at some extent. These findings suggest that FC may be a good prognostic indicator for motor recovery. Therefore, both PSD and FC parameters may constitute good prognostic indicators for motor recovery after stroke. However, they provide different information. While PSD seems to provide information on the amplitude of local spontaneous neural activity, FC provides information on the interhemispheric coordination of this activity. It would be also interesting to see if PSD measure informs motor activation from the active motor task. However, in the current study, the passive motor task was performed with affected hand and thus it would be difficult to see the possible association between PSD measure from the resting-state fMRI and motor activation from the active motor fMRI.
Conclusions
In contrast to patients with good recovery, those with poor recovery had significant higher PSD in the ipsilesional M1 and higher interhemispheric differences in PSD between ipsilesional and contralesional M1. Furthermore, high ipsilesional PSD was correlated with poorer motor improvement. The present study is the first to demonstrate that PSD amplitude of resting-state spontaneous BOLD fluctuations in the motor network may be a sensitive predictor of late-onset motor recovery after stroke.
Footnotes
Declaration of Conflicting Interests
The authors declared no potential conflicts of interest with respect to the research, authorship, and/or publication of this article.
Funding
The authors disclosed receipt of the following financial support for the research, authorship, and/or publication of this article: This work was supported by a Biomedical Research Institute Grant, Kyungpook National University Hospital (2016).