
Abstract
Background
Rehabilitation following traumatic brain injury (TBI) significantly improves outcomes; yet TBI heterogeneity raises the need for molecular evidence of brain recovery processes to better track patient progress, evaluate therapeutic efficacy, and provide prognostication.
Objective
Here, we assessed whether the trajectory of TBI-responsive peptides secreted into urine can produce a predictive model of functional recovery during TBI rehabilitation.
Methods
The multivariate urinary peptidome of 12 individuals with TBI was examined using quantitative peptidomics. Measures were assessed upon admission and discharge from inpatient rehabilitation. A combination of Pavlidis template matching and partial least-squares discriminant analysis was used to build models on Disability Rating Scale (DRS) and Functional Independence Measure (FIM) scores, with participants bifurcated into more or less functional improvement groups.
Results
The produced models exhibited high sensitivity and specificity with the area under the receiver operator curve being 0.99 for DRS- and 0.95 for FIM-based models using the top 20 discriminant peptides. Predictive ability for each model was assessed using robust leave-one-out cross-validation with Q2 statistics of 0.64 (P = .00012) and 0.62 (P = .011) for DRS- and FIM-based models, respectively, both with a high predictive accuracy of 0.875. Identified peptides that discriminated improved functional recovery reflected heightened neuroplasticity and synaptic refinement and diminished cell death and neuroinflammation, consistent with postacute TBI pathobiology.
Conclusions
Produced models of urine-based peptide measures reflective of ongoing recovery pathobiology can inform on rehabilitation progress after TBI, warranting further study to assess refined stratification across a larger population and efficacy in assessing therapeutic interventions.
Keywords
Introduction
Moderate to severe traumatic brain injury (TBI) remains a significant cause of chronic disease with profound functional impacts on quality of life and the need for specialized rehabilitation. Patients with TBI are vulnerable to a multitude of postacute morbidities, including cognitive deficits, motor issues, posttraumatic epilepsy, psychiatric conditions, and neurodegenerative disease, with an estimated 5.3 million Americans living with long-term disability.1,2 Brain injury rehabilitation, beginning with inpatient interventions, provides a recovery process for improved cognitive, psychosocial, and motor functioning.3-5 Current inpatient TBI rehabilitation models assess patient recovery using neurofunctional tests, patient questionnaires, and global scales. 6 Although this toolkit is highly impactful, 7 the addition of pathobiology-based biomarker feedback on patient recovery would be advantageous in optimizing interventions and prognostication. 8 Indeed, optimizing individualized dose, intensity, and timing of therapy remains one of the greatest challenges for practitioners that could benefit from effective TBI rehabilitation molecular diagnostics.9,10
Omic mass spectrometry provides a biomarker discovery platform to address diagnostic and prognostic requirements in TBI rehabilitation by measuring peripheral products of ongoing molecular processes in an untargeted manner.11-13 The multivariate, quantifiable output promises a greater degree of pathophysiological-relevant information than presently attained via clinical variables alone, which in combination, would provide more robust, individualized data for injury assessment, monitoring interventions, and prognosticating outcomes within a rehabilomics research model. 8 Yet the application of omic mass spectrometry to TBI diagnostics has largely been limited to studying the acute-phase response.12,14 TBI pathophysiology underlying secondary sequelae continues to evolve in the postacute period, 8 warranting discrete biomarker assays to inform on patient progress during rehabilitation and portend future recovery. 11
Previously, we published on the discovery of endogenous, TBI-relevant peptides excreted into the urine and proposed their utility for biomarker development during inpatient rehabilitation. 15 In our initial report, we utilized an untargeted data-independent mass spectrometry approach to discern peptidomic features that effectively differentiated patients on the brain injury rehabilitation unit from age- and sex-matched non-TBI patients. Selective peptide identification, furthermore, established pathobiological relevance for the measured TBI urinary signature with ongoing neuroplastic processes. The present study moves this work forward and addresses a key limitation of the prior work by incorporating repeated measures during inpatient rehabilitation, focusing on the interplay between multivariate peptide trajectories in the urine of patients in brain injury rehabilitation and functional change measured via common Disability Rating Scale (DRS) and Functional Independence Measure (FIM) assessment tools.16-18 Resulting putative biomarker models were further assessed for their potential to predict functional recovery 1 year out from TBI. Findings here offer a foundation for the utility of urine-based peptidomic biomarkers as objective biokinetic measures of neurorepair processes that can aid intervention assessment and recovery monitoring during inpatient brain injury rehabilitation.
Methods
Participant Recruitment and Functional Testing
A total of 12 patients with moderate-severe TBI (initial Glasgow Coma Scale score ≤12) were enrolled within 48 hours of admission to the inpatient Brain Injury Rehabilitation Unit with written consent under approval from the Virginia Commonwealth University Institutional Review Board. Admission occurred at a mean of 19 ± 4 days postinjury based on standards of care for demonstrating readiness, with required medical stability and capacity to progress in an acute rehabilitation program. Participants were excluded if they had noncranial bone fracture, renal dysfunction at the time of admission to the rehabilitation unit, or a positive history of previous brain injury or neurological disease. A summary of participant information is provided in Table 1. Urine specimens were collected and processed as described below to provide a trajectory assessment across inpatient rehabilitation. The target study size was adjusted for use with repeated measures based on prior peptidomic mass spectrometric median variance among patients with TBI, correcting the significance level to a 5% false discovery rate using the Bejamini-Yekutieli method in order to achieve the goal of detecting a 2-fold change at 80% power. Participant DRS and FIM scores were obtained on admission to rehabilitation, at discharge from rehabilitation, and then at 1 year after injury as part of the Virginia Commonwealth University Traumatic Brain Injury Model Systems study.19,20 DRS and FIM were selected as well-documented and effective indicators of participant function established for use in brain injury rehabilitation.17,21 Urine specimens were also collected and analyzed for 8 age- (26 ± 4.9) and sex-matched non-TBI control participants, as described previously, 15 which provided baseline measures for comparison with peptide features selected in the built peptidomic models.
TBI Participant Demographics.
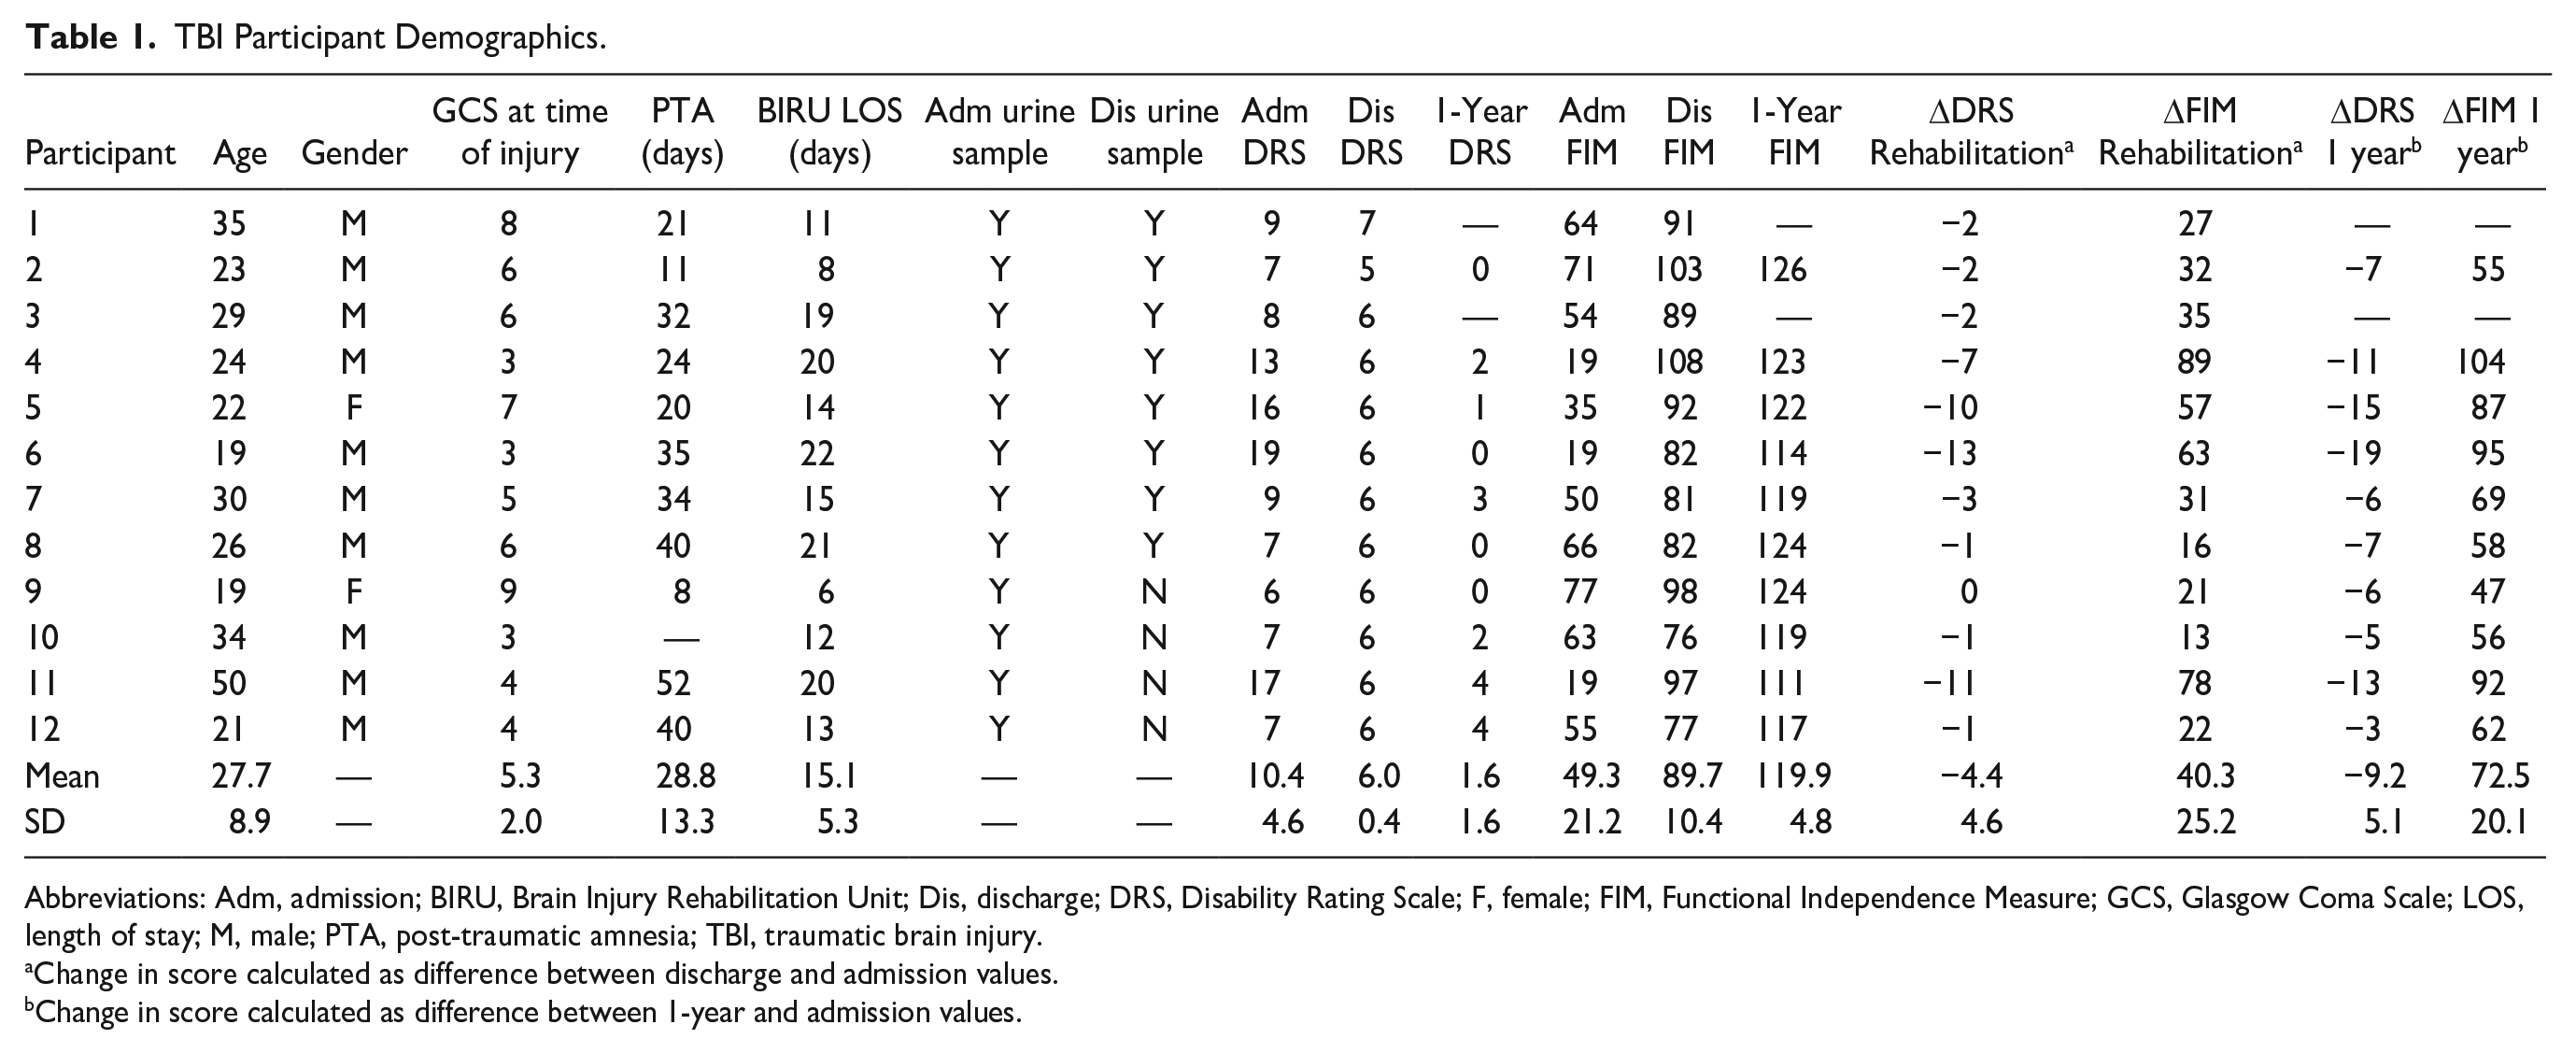
Abbreviations: Adm, admission; BIRU, Brain Injury Rehabilitation Unit; Dis, discharge; DRS, Disability Rating Scale; F, female; FIM, Functional Independence Measure; GCS, Glasgow Coma Scale; LOS, length of stay; M, male; PTA, post-traumatic amnesia; TBI, traumatic brain injury.
Change in score calculated as difference between discharge and admission values.
Change in score calculated as difference between 1-year and admission values.
Urine Collection and Processing
Urine peptides were evaluated at admission and then again at discharge from inpatient rehabilitation. Each time point involved collection of 3 separate samples over a 48-hour window with responses summated to minimize the influence of diurnal variability. The 2 sampling periods were separated by an average 15.1 ± 5.3 days of in-patient neurorehabilitative care. Urine specimens were collected midstream and processed as described previously. 15 Briefly, samples were acquired, time stamped, and stored at 4 °C for a full 24 hours to normalize oxidative aging of the samples. Afterward, samples were centrifuged at 1500g and 4 °C for 15 minutes and aliquoted for long-term storage at −80 °C. One aliquot was used for osmolarity determination, with a second aliquot load standardized to 130 mOsm/kg with mass spectrometry-grade water. Balanced specimens (100 µL) were clarified with 0.1-µm pore Ultrafree-MC units (Millipore, Billerica, MA) with the filtrate transferred to autosampler vials for mass spectrometric analysis.
Mass Spectrometry and Data Processing
Untargeted data-independent mass spectrometry was performed on the urine specimens as previously published. 15 Balanced samples were sequentially injected (8 µL on column) and separated using a NanoAcquity ultrahigh performance liquid chromatography system (Waters, Milford, MA) in an interspersed order to minimize systematic bias. Per injection, the sample was trap captured on a Symmetry C18 column (Waters) to desalt and concentrate the organic content. Peptides were then gradient eluted and separated in 60 minutes via an HSS T3 75 µm i d capillary column (Waters), with contaminating lipid content retained on the trap column and later flushed to waste. The column eluent was electrosprayed into a hybrid ion mobility/tandem mass spectrometer (Synapt G2Si HDMS, Waters) operating in a data-independent analysis mode using ion mobility–directed fragmentation (UDMSe). 22 All sample processing and analysis was performed within a climate-controlled clean room to minimize contamination and analytical variance.
UDMSe data were peak picked to retain precursor and product ions above 150 and 20 ion counts, respectively, using Apex3D under Waters PLGS software v 3.0.3. Data were then deisotoped, charge-state collapsed, and deconvoluted to pair product ions with precursors using the Peptide3D function with a MH+ cutoff of 800 to focus on peptide measures apart from small-molecule metabolites. Spectra for 3 replicate samples over each 48-hour window were merged using the MergeFraction function, producing an average signal intensity for admission and discharge time points that accounted for diurnal variance. The resulting spectra were then ion aligned across participants using the composite accurate mass (±12 ppm), retention time (±1 minute), and drift time (±4 time bins) measures in Isoquant v1.5. 22 Data were filtered to remove nonrobust (<80% replication) ion measures, with intensity values median centered to account for load variability. Imputation was then performed in situations where left-censored data appeared consistently across replicates per time point, using a Gaussian distribution of random-generated values having the mean and median variance observed at the limit of quantification across the data set. Finally, data were normalized using a log(2) transformation.
Statistical Analysis and Model Building
The TBI-responsive urinary peptidome was described previously and involved assessing significantly increased ion measures reproduced across participants with TBI assessed on admission to brain injury rehabilitation relative to nontraumatized matched controls. 15 Extending beyond this prior work, analysis here focused on biokinetics within the TBI-responsive urinary peptidome to provide a functionally relevant diagnostic trajectory across inpatient rehabilitation. Intensity change (Δ) between admission and discharge was computed as the log(2) difference for each of the TBI-responsive ion measures, providing a measure of peptide trajectory across inpatient rehabilitation, with a negative value reflecting a decrease between the 2 time points.
Model building began with feature reduction using a Pavlidis template matching procedure (Multiple Experiment Viewer v4.9) between the urine peptide trajectory data and participant function trajectories measured as the difference (Δ) between discharge and admission DRS and FIM scores. Note that functional gains during rehabilitation were indicated by a negative ΔDRS or a positive ΔFIM value. The analysis resolved peptide measures that significantly correlated (Pearson R > 0.80; q < 0.10) with either ΔDRS or ΔFIM values across participants (n = 5). The robustness of Pavlidis feature reduction was validated against random correlation (n = 15 random-generated templates) using the 1-sample z-test.
Model refinement and testing was then performed using the Metaboanalyst v4.0 biomarker analysis toolkit for omics data sets, 23 using additional participants not involved in Pavlidis variable reduction (n = 8). Two-component partial least-squares discriminant analysis (PLS-DA) was performed on DRS and FIM correlated features, with mean Δlog(2) intensity imputation. DRS and FIM models were refined to include the most predictive features based on variable importance in projection (VIP) scores at a recommended cutoff (>1.0). 24 Model cross-validation was then performed using the robust leave-one-out procedure for an unbiased assessment (accuracy, R2, and Q2) of the generalized predictive capability of the assay without sacrificing sample size. 25 The models were further scrutinized via principle component analysis (PCA), an orthogonal validation shown effective in avoiding errant overfitting of PLS-DA results. 26 Refined models were then assessed using receiver operating characteristic curves for PLS-DA classification using a feature ranking method with 2 latent variables. Diagnostic clinical performance was then assessed using predicted class probability plots, with participants binarily divided into groups of more or less functional gain over inpatient rehabilitation using ΔDRS or ΔFIM values. Finally, the refined models were piloted for their capacity in predicting functional improvement out 1 year from the TBI, calculated as the difference in DRS and FIM scores from inpatient rehabilitation to 1 year after injury for 6 participants retained in the TBI Model Systems study.
Urinary Peptide Sequence Identification
Sequence search analysis was performed on tandem mass spectra corresponding to the selected peptide features. Spectral data were assessed against a human Swissprot database (downloaded from Uniprot.org on March 2018) in PLGS/Endogeseq software using no enzyme specificity for endogenous peptide measures. Precursor and product mass tolerances were set to 6 and 12 ppm, respectively, and methionine was considered as the only variable modification. The random-decoy database method was used to control the false-positive identification rate to 10% as is reliable for high-resolution mass spectral measures. 27 Additionally, sequences were accepted only if reproducibly identified across a minimum of 3 biological replicates.
Results
Functionally Responsive Urinary Peptides Across Inpatient Rehabilitation
Building biomarker models to monitor recovery during TBI rehabilitation required a priori metrics to select functionally-relevant factors. In this study, we used the well-characterized DRS and FIM assessment tools. While the tools overlapped in functional aspects being assessed, they were not entirely the same, and had markedly different scale ranges. 17 This was reflected by the significant (P < .001), though not parallel (R = 0.841), correlation in assessed participant performance over inpatient rehabilitation (Supplementary Material Table 1). Absent a gold standard scale, we thus developed urinary peptide models discretely against DRS and FIM score trajectories for a more comprehensive evaluation. TBI responsive peptides were reduced via Pavlidis template matching to those urinary products that tracked with participant functional performance across inpatient rehabilitation (R > 0.80; q < 0.10). Analysis revealed 99 and 84 factors correlating with DRS and FIM functional performance, respectively (Supplementary Material Table 2). Interestingly, functionally correlated peptide measures exclusively exhibited a declining concentration across inpatient rehabilitation, related to diminishing peptide byproduct formation during recovery from TBI. To assess the robustness of these findings, feature correlation was assessed against random templates using 1-sample location testing, with matched results found to be significant (P < .001) for DRS and FIM models (Supplementary Material Table 1). Overall, 33 peptides overlapped between DRS and FIM model features, with the remainder independently correlative with either scale, denoting distinctions between the 2 scales.
Model Refinement With PLS-DA: Prioritization of Discriminant Features
Applying the above Pavlidis procedure removed noncorrelated factors that could contribute to overly complex, erroneous models. 26 This step was an important prerequisite for effective model refinement with PLS-DA, a robust discriminant tool ideally suited to omic data sets, where the number of latent variables exceeds the number of samples. 28 Participants were first divided into more (>10%) and less (≤10%) improved cohorts based on their change in DRS or FIM scores across inpatient rehabilitation. Then, the supervised PLS-DA algorithm composed which latent peptide variables provided the greatest distance between cohorts, with effective group differentiation illustrated for DRS (Figure 1A) and FIM (Figure 2A) projections. Participants were well resolved into 2 groups, with tight, nonoverlapped 95% CIs. The first component (y-axis) predominantly provided group classification, accounting for approximately 40% of the variance in ΔDRS and ΔFIM values. Furthermore, PLS-DA coefficients could be used to rank the importance of each peptide variable onto the resultant projection (VIP), an effective feature selection method for model refinement. 29 The analysis prioritized 30 of 99 and 22 of 84 peptides with VIP scores >1.0 for DRS-based (Figure 1B) and FIM-based (Figure 2B) projections, respectively. Detailed ion information; admission, discharge, and non-TBI control participant intensity quantities; and statistical testing results for each of these VIP peptides are provided in Supplementary Material Table 3 for the DRS Model and Supplementary Material Table 4 for the FIM Model. These tables additionally include fragmentation product ion data that in combination with the accurate peptide mass measure provides highly selective qualification of each peptide feature to allow subsequent detection of these features across laboratories. Plotting the top 5 VIP peptide features for DRS-based (Figure 1C) and FIM-based (Figure 2C) features, we observe that each peptide exhibits a greater change in intensity between admission and discharge evaluation times for participants exhibiting a greater improvement in functional score than for those exhibiting a lesser improvement across the same time period. Moreover, the top 5 VIP features were graphed as fold change from observed levels in non-TBI control participants, which illustrates how these peptides are distinctly upregulated across TBI participants at admission to rehabilitation, with improvement toward baseline control measures during inpatient rehabilitation.
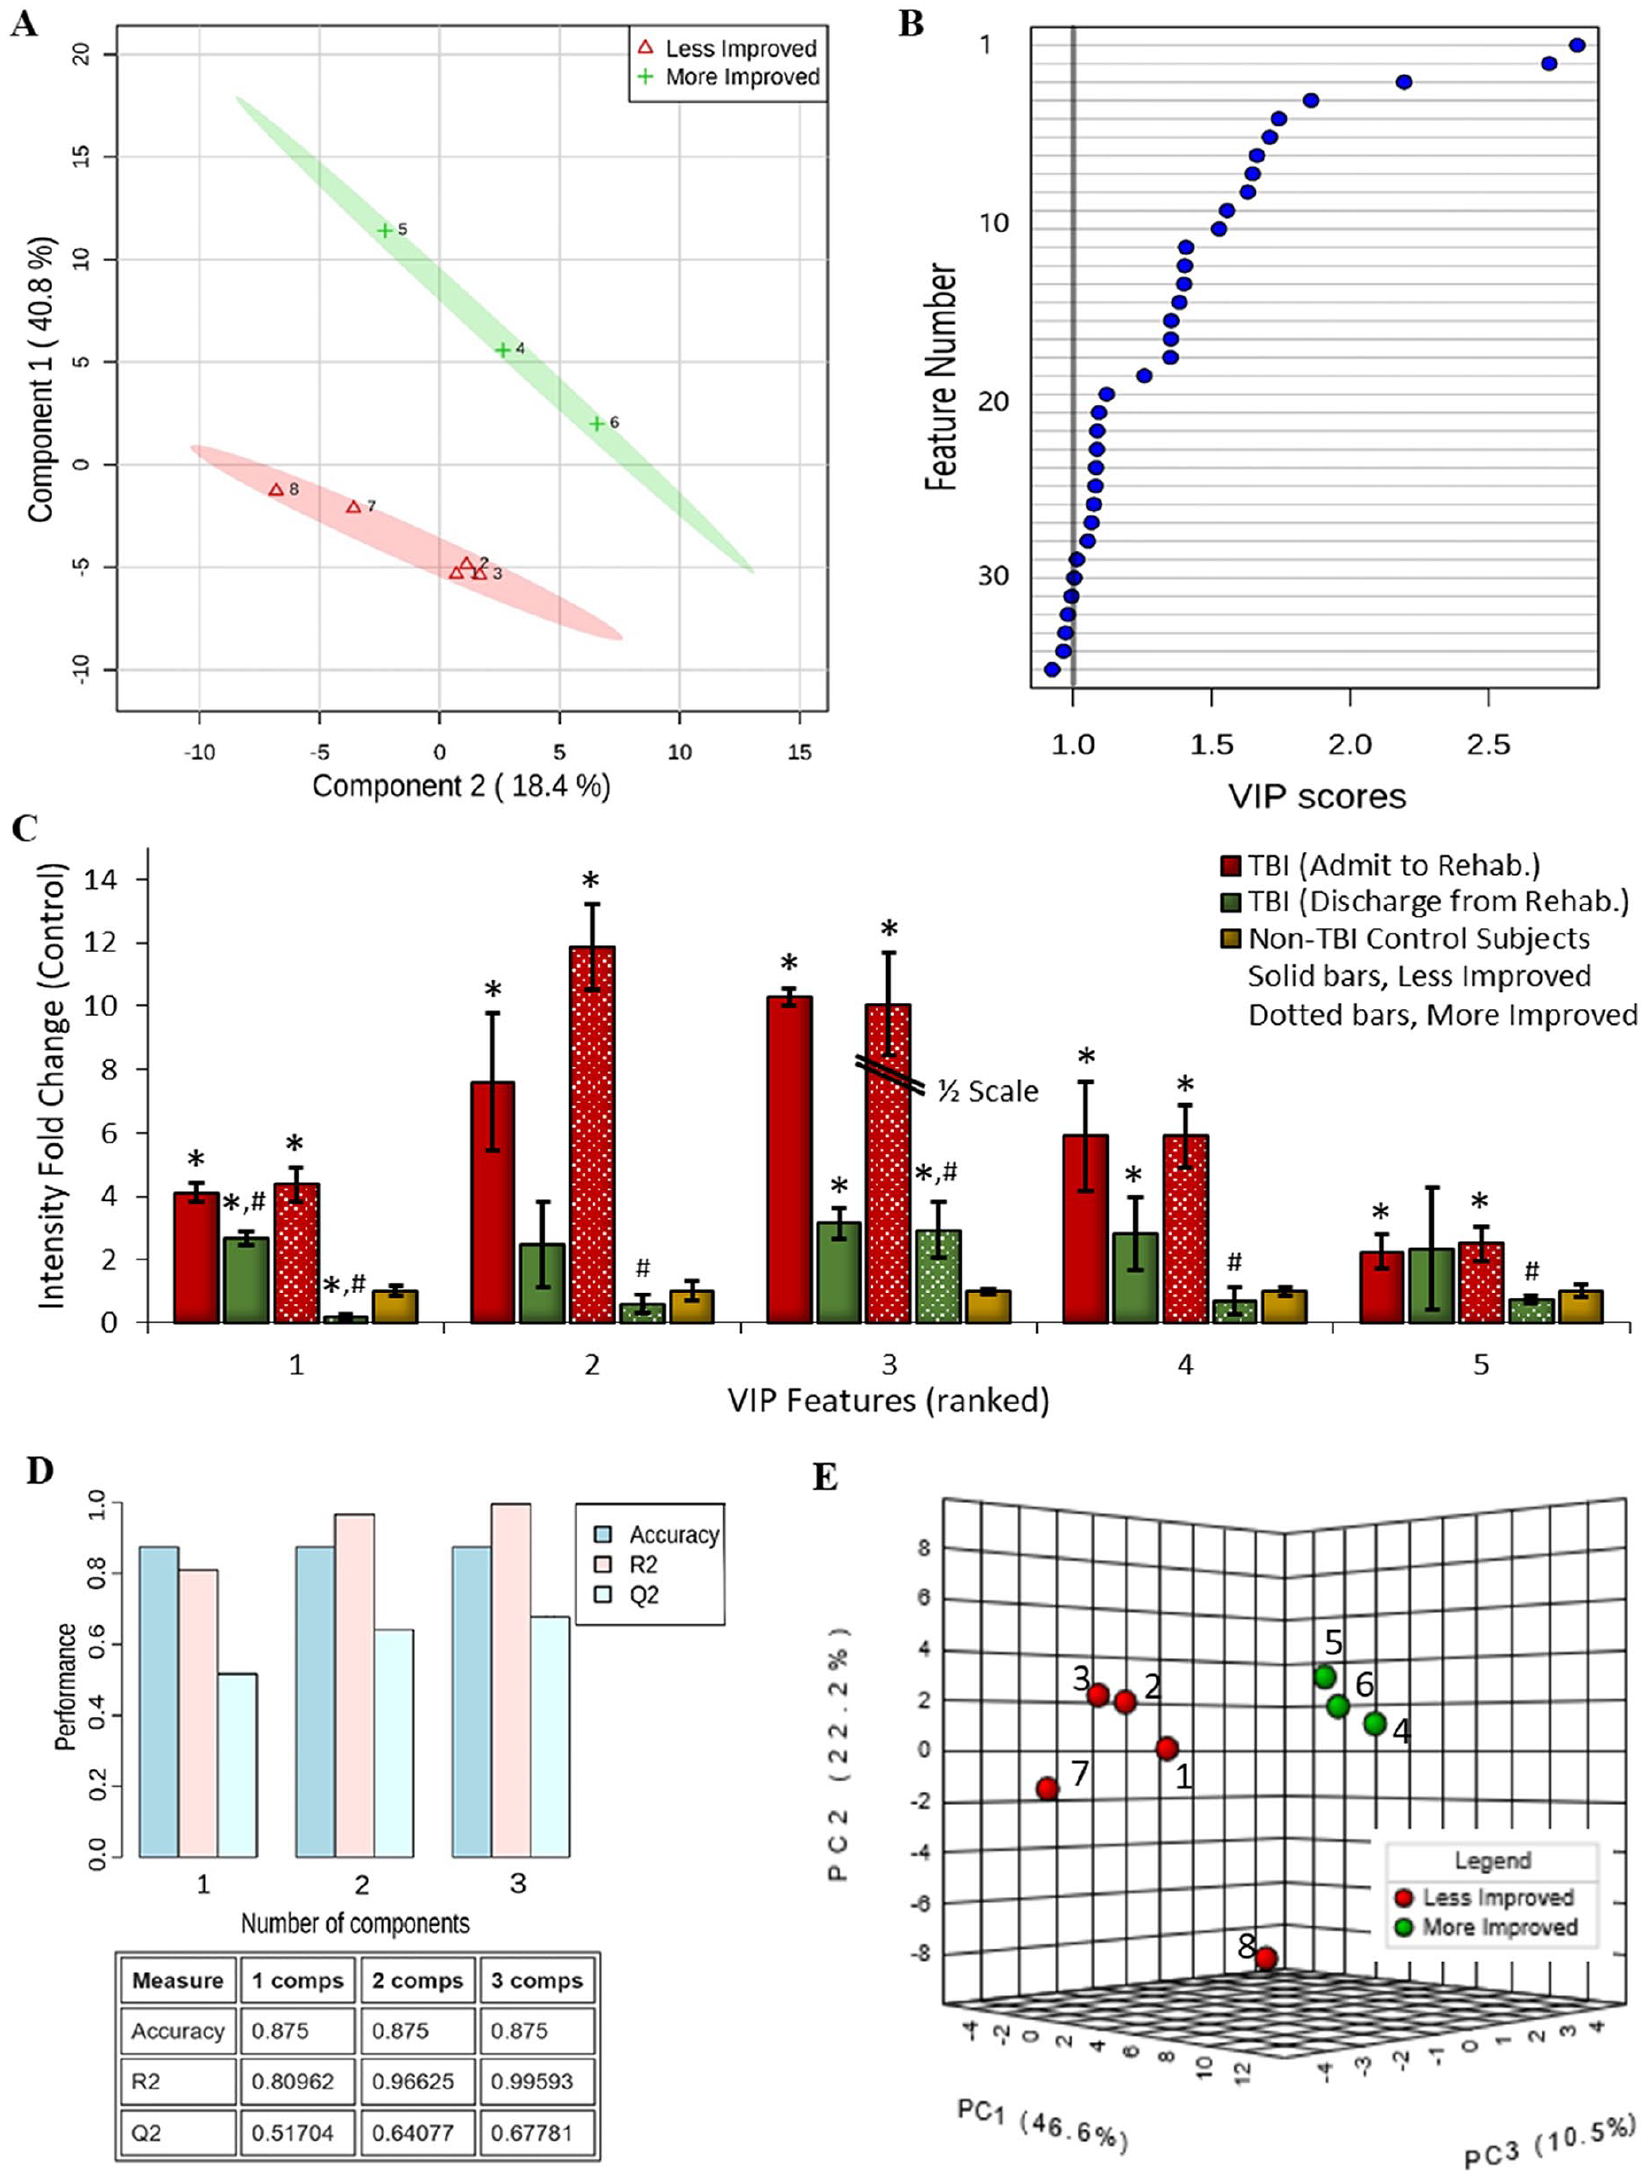
Urinary peptide biomarker model building against change in Disability Rating Scale (DRS) score performance across inpatient rehabilitation. Partial least squares-discriminant analysis (PLS-DA) was performed to identify the most discriminant peptide features that differentiate participants with more (green) or less (red) functional gain as assessed by a change in DRS from inpatient rehabilitation admission to discharge. (A) Component scores plot of participant bimodal discrimination using PLS-DA ranked peptide features. Each group is delineated with its 95% confidence oval. (B) Plot of variable importance in projection (VIP) scores, ranking the most discriminant peptide features with an accepted cutoff of >1.0. (C) Peptide intensity at admission and discharge evaluation times for the top 5 VIP peptide features, separated for participants showing more or less DRS score improvement, presented as fold change from baseline measures among age-sex matched non–traumatic brain injury (TBI) control participants (mean ± SE; #P < .025, admit to discharge; *P < .0125, to non-TBI control). (D) Graph and matrix of predictive accuracy, R2, and Q2 values for the PLS-DA refined peptide model using the top 20 scoring features. (E) Plot of the first 3 principal components that affirms by unsupervised analysis the urinary peptidome’s power to discriminate participants with more (green) or less (red) functional improvement as assessed by their ΔDRS scores.
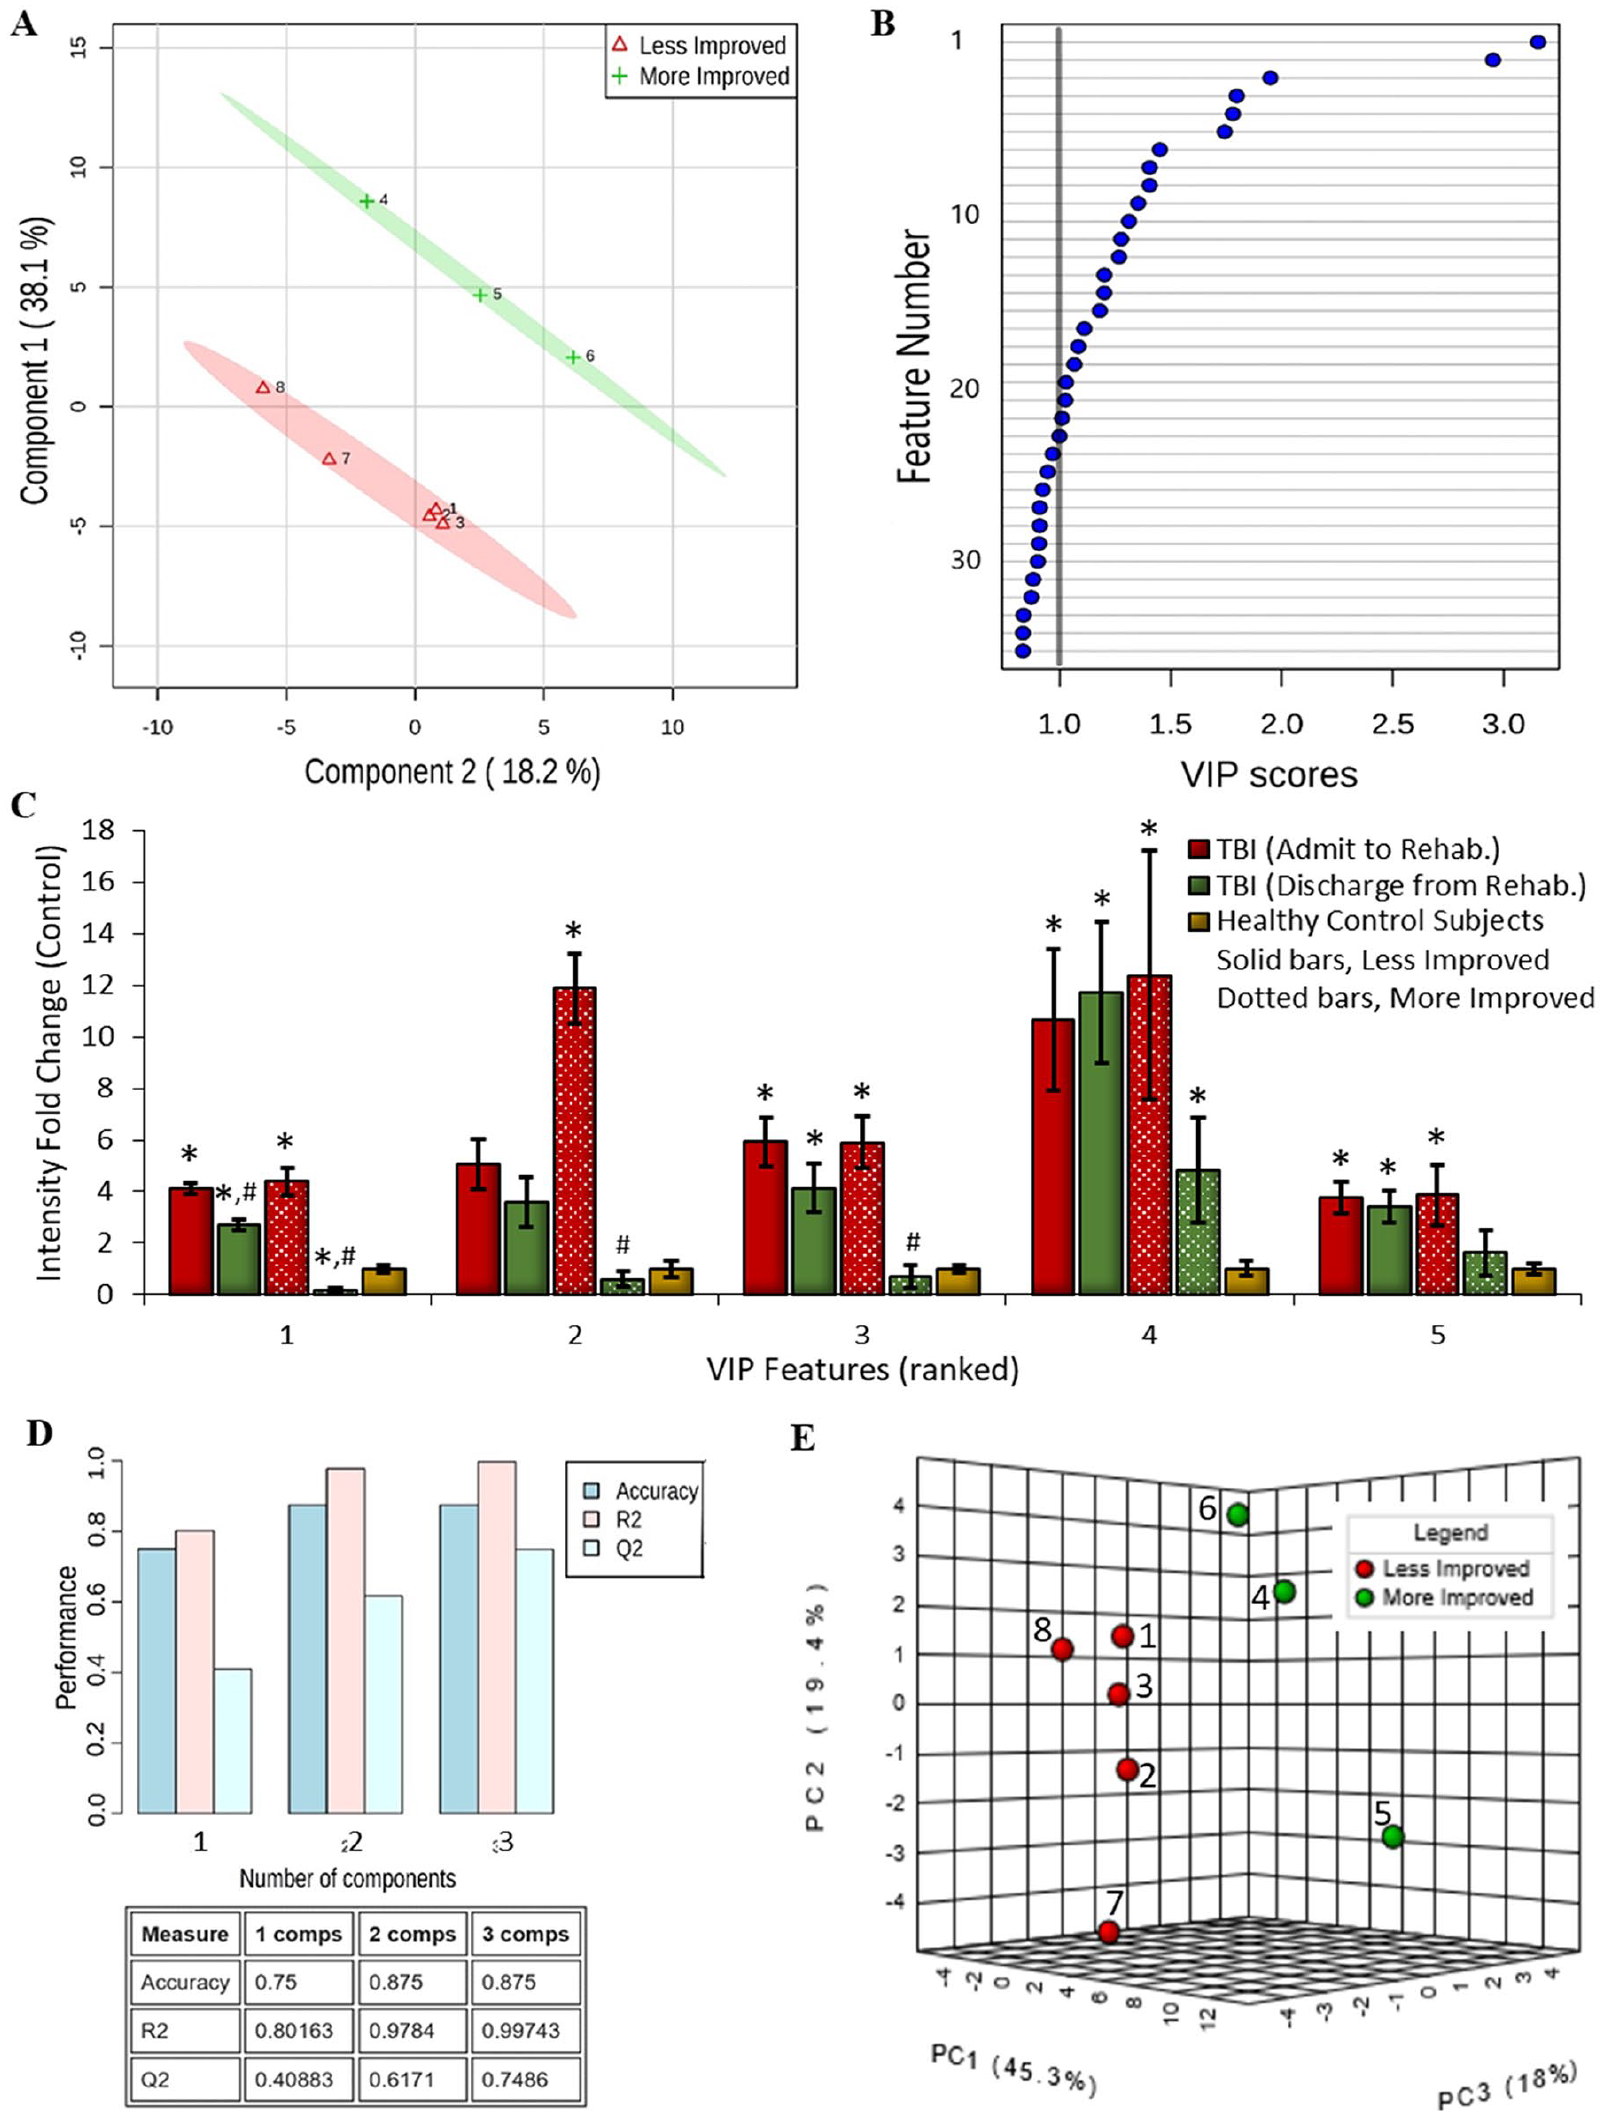
Urinary peptide biomarker model building against change in Functional Independence Measure (FIM) score performance across inpatient rehabilitation. Partial least-squares discriminant analysis (PLS-DA) was performed to identify the most discriminant peptide features that differentiate participants with more (green) or less (red) functional gain as assessed by a change in FIM from inpatient rehabilitation admission to discharge. (A) Component scores plot of participant bimodal discrimination using PLS-DA ranked peptide features. Each group is delineated with its 95% confidence oval. (B) Plot of variable importance in projection (VIP) scores, ranking the most discriminant peptide features with an accepted cutoff of >1.0. (C) Peptide intensity at admission and discharge evaluation times for the top 5 VIP peptide features, separated for participants showing more or less FIM score improvement, presented as fold change from baseline measures among age-sex matched non–traumatic brain injury (TBI) control participants (mean ± SE; #P < .025, admit to discharge; *P < .0125, to non-TBI control). (D) Graph and matrix of predictive accuracy, R2, and Q2 values for the PLS-DA refined peptide model using the top 20 scoring features. (E) Plot of the first 3 principal components that affirms by unsupervised analysis the urinary peptidome’s power to discriminate participants with more (green) or less (red) functional improvement as assessed by their ΔFIM scores.
DRS-based and FIM-based model predictive ability was then evaluated using a Monte Carlo leave-n-out procedure (Figures 1D and 2D, respectively). With at least 2 orthogonal classifiers, cross-validated results remained consistent with the original predicted data, where the Q2 statistic was 0.64 for DRS-based and 0.62 for FIM-based models (well exceeding the accepted threshold of 0.4). 30 Predictive accuracy was additionally high at 0.875 for both models, demonstrating discriminant power per urinary peptide measures. Permutations testing validated the statistical significance of the Q2 results for DRS-based (P = .00012; Z = 3.67) and FIM-based (P = .011; Z = 2.30) models. 30 Peptide data were further assessed using unsupervised PCA analysis to rule out PLS-DA overfitting validate discriminatory power. 26 Principal components plots for the DRS-based (Figure 1E) and FIM-based (Figure 2E) data sets effectively maintained participant differentiation per the 2 cohorts (post hoc colored to match prior supervised classification).
Performance of Urinary Peptide Models in Predicting Functional Improvement at Discharge
Next, the diagnostic performance of the top-scoring peptide features was assessed. Receiver operating characteristic curve analysis showed that DRS-based and FIM-based models exhibited high sensitivity and specificity, having area under the curve (AUC) values of 0.99 and 0.95, respectively, when using the top 20 scoring peptide features (Figures 3A and 3C). Adding additional features to either DRS-based or FIM-based models did not improve performance, with AUC values falling to 0.96 and 0.95, respectively. Much of the discriminant capacity of the models required a minimum of 5 peptides, with AUC scores of 0.86 and 0.83 for the DRS-based and FIM-based models, signifying importance of the multivariate measurement of the urine peptidome. Yet DRS- and FIM-based models ended up with 3 of the top 5 and 8 of the top 20 scoring peptides in common, supporting shared relevance with overlapping features. Cross-validation assessment showed that the DRS-associated models exhibited ideal prediction (Figure 3B) with the available participants, whereas the FIM-associated model resulted in lower sensitivity with just 1 misclassification of a participant (participant 6 in Figure 3D). Altogether, these initial results support the positive potential of urinary peptide biomarker models in monitoring functional improvement.
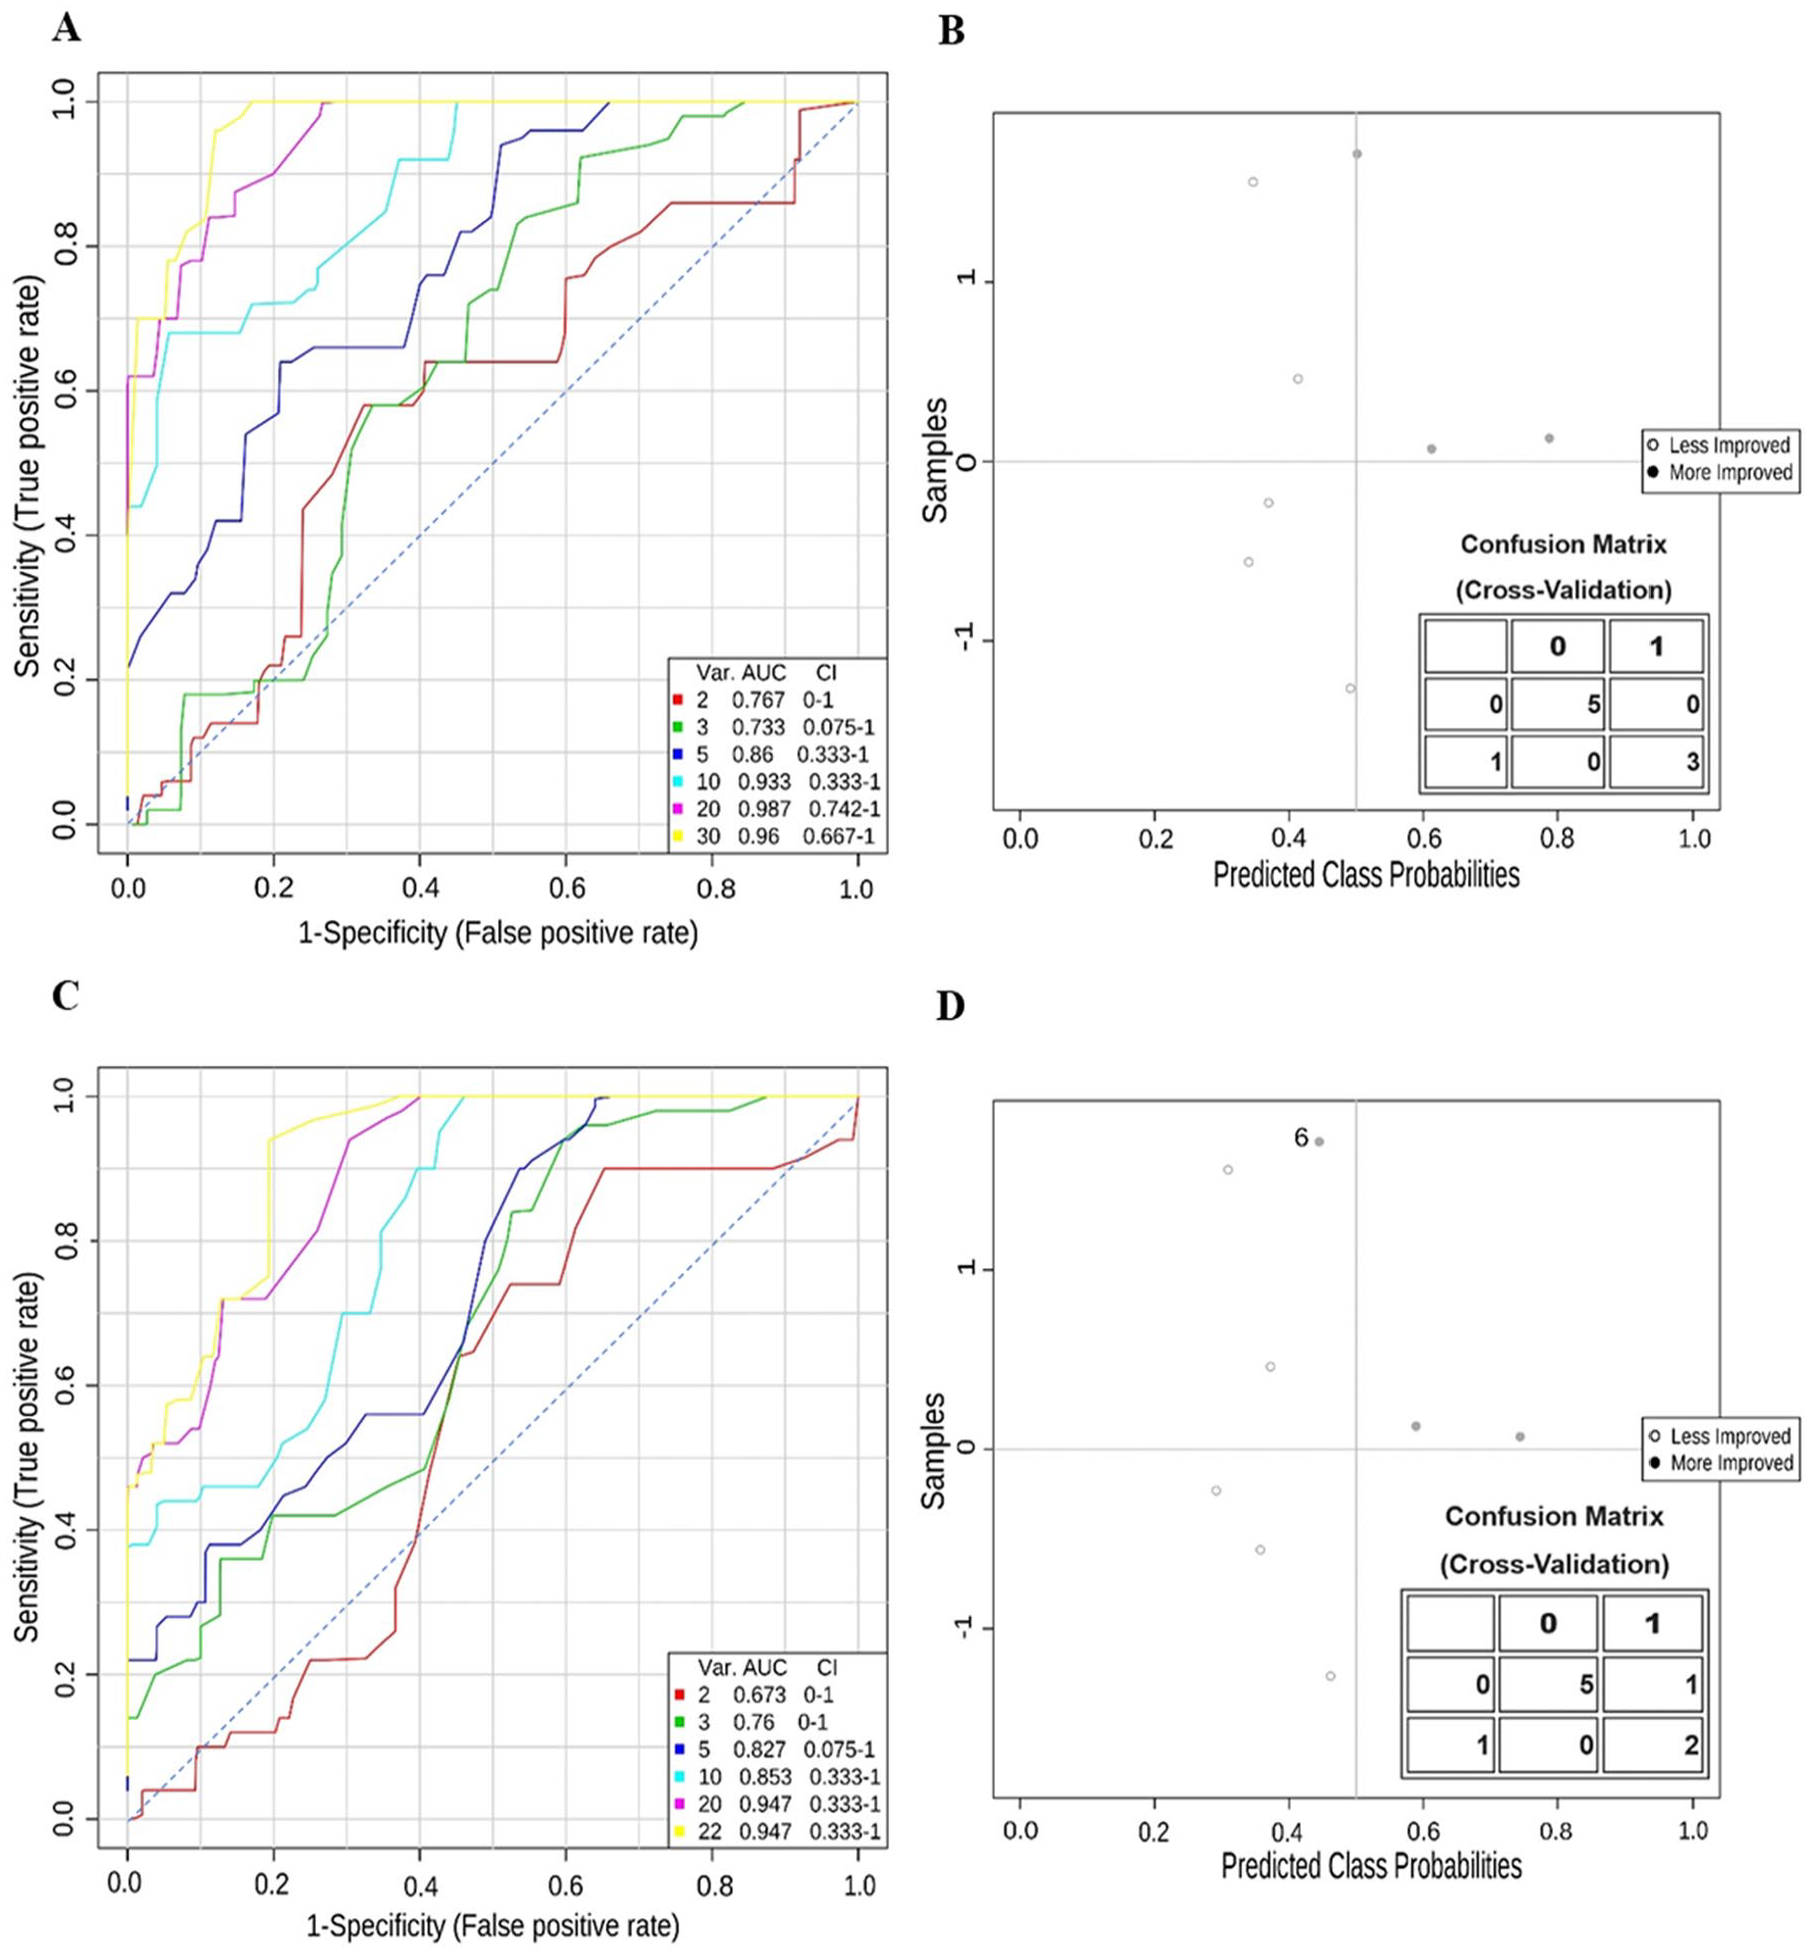
Urinary peptide model performance evaluated by receiver operator curve and predicted class probability analysis. (A) Area under the curve (AUC) plots depicting true- and false-positive rates with an increasing number of top-scoring peptide features within the Disability Rating Scale (DRS)-based peptide model. AUC values depicted in the legend. (B) Predicted class probability plot with the accompanying confusion matrix of cross-validated results assessing prognostic performance when using a DRS-based model with the top 20 peptide features. (C) AUC plots depicting true- and false-positive rates with an increasing number of top-scoring peptide features within the Functional Independence Measure (FIM)-based peptide model. AUC values depicted in the legend. (D) Predicted class probability plot with the accompanying confusion matrix of cross-validated results assessing prognostic performance when using a FIM-based model with the top 20 peptide features. The misassignment of participant 6 is labeled.
Prognostic Performance of the Urinary Peptide Models Out 1 Year From Injury
Clinical variables at the time of injury and rehabilitation have proven useful in predicting recovery over the long-term. 31 Thus, we sought to assess the predictive capability of the urinary peptide models based on DRS and FIM scoring assessed 1 year following injury (Table 1). Unfortunately, with 25% attrition by the 1-year assessment, we were left with fewer participants, limiting the accuracy of model prognostic performance. Three participants demonstrated 37%, 50%, and 63% functional improvements per DRS and 96%, 81%, and 88% functional improvements per FIM, respectively. The remaining participants exhibited less improvement in DRS (23%, 20%, and 23%) and FIM (51%, 64%, and 54%) scoring. Interestingly, these participants maintained the same grouping (more or less improvement) as had been assigned during the rehabilitation period, supporting that positive functional gains during inpatient rehabilitation are predictive of continued recovery. Although the number of participants was limited for this initial assessment, AUC analysis suggested prognostic capacity for the peptide models against DRS and FIM improvement by the 1-year time point. Overall, the DRS model proved more sensitive than the FIM model, achieving 94% sensitivity at 80% specificity in comparison with only 73% sensitivity at 80% specificity, respectively.
Pathobiological Relevance of Urinary Peptides Tracking With Functional Recovery
Thus, with urinary peptide models effectively tracking function recovery across rehabilitation, a key next step was to establish peptide pathobiological relevance. Identification of endogenous peptides remains an analytical challenge32,33; however, with optimization and control of the false discovery rate, 12 of the DRS/FIM score correlated factors (Supplementary Material Table 2) were identified, providing for a functional assessment of the diagnostic urinary peptides (Table 2). Where matched, peptide identifications are also shown aligned with the VIP score-ranked discriminant peptides for DRS-based (Supplementary Material Table 3) and FIM-based (Supplementary Material Table 4) models. Nearly half (42%) of the identified peptide measures associated greater functional gains with enhanced neuroplasticity and RNA trafficking in dendritic spine remodeling: Arhgef2,34,35 Hnrnpm, 36 Hapln4,37,38 Purb, 39 and Dazap1,40,41 with Hnrnpm and Purb peptides among the matched VIP features. Another 5 peptides (42%) related further functional improvement with declining cell death and inflammatory processes in the brain: Pebp1, 42 Ahcyl2, 43 Cpe, 44 Gspt1, 45 and Csf1r. 46 The last 2 peptides correlated greater functional improvement with a decrease in clathrin-mediated endocytosis: Epn2 47 and Sgip1,48,49 which may reflect declining excitotoxic injury after neurotrauma that involved clathrin-mediated endocytosis.50,51 Importantly, both Epn2 and Sgip1 are highly enriched in the brain over other tissues (Human Protein Atlas, https://www.proteinatlas.org). A full third of the 12 identified peptides are from source proteins specifically enriched in the brain, to include Hapln4 and Cpe, whereas all others are also known, though not necessarily enriched, in the brain. A more detailed synopsis of the functional relevance of each declining peptide measure associated with greater functional gain during rehabilitation is provided in Table 2 and is discussed below. Overall, these identified peptides provide clear evidence for the pathobiological relevance of the detected peptides as biomarkers of ongoing neuronal remodeling and recovery during rehabilitation.
Identified Functional Recovery Tracking Urine Peptides.
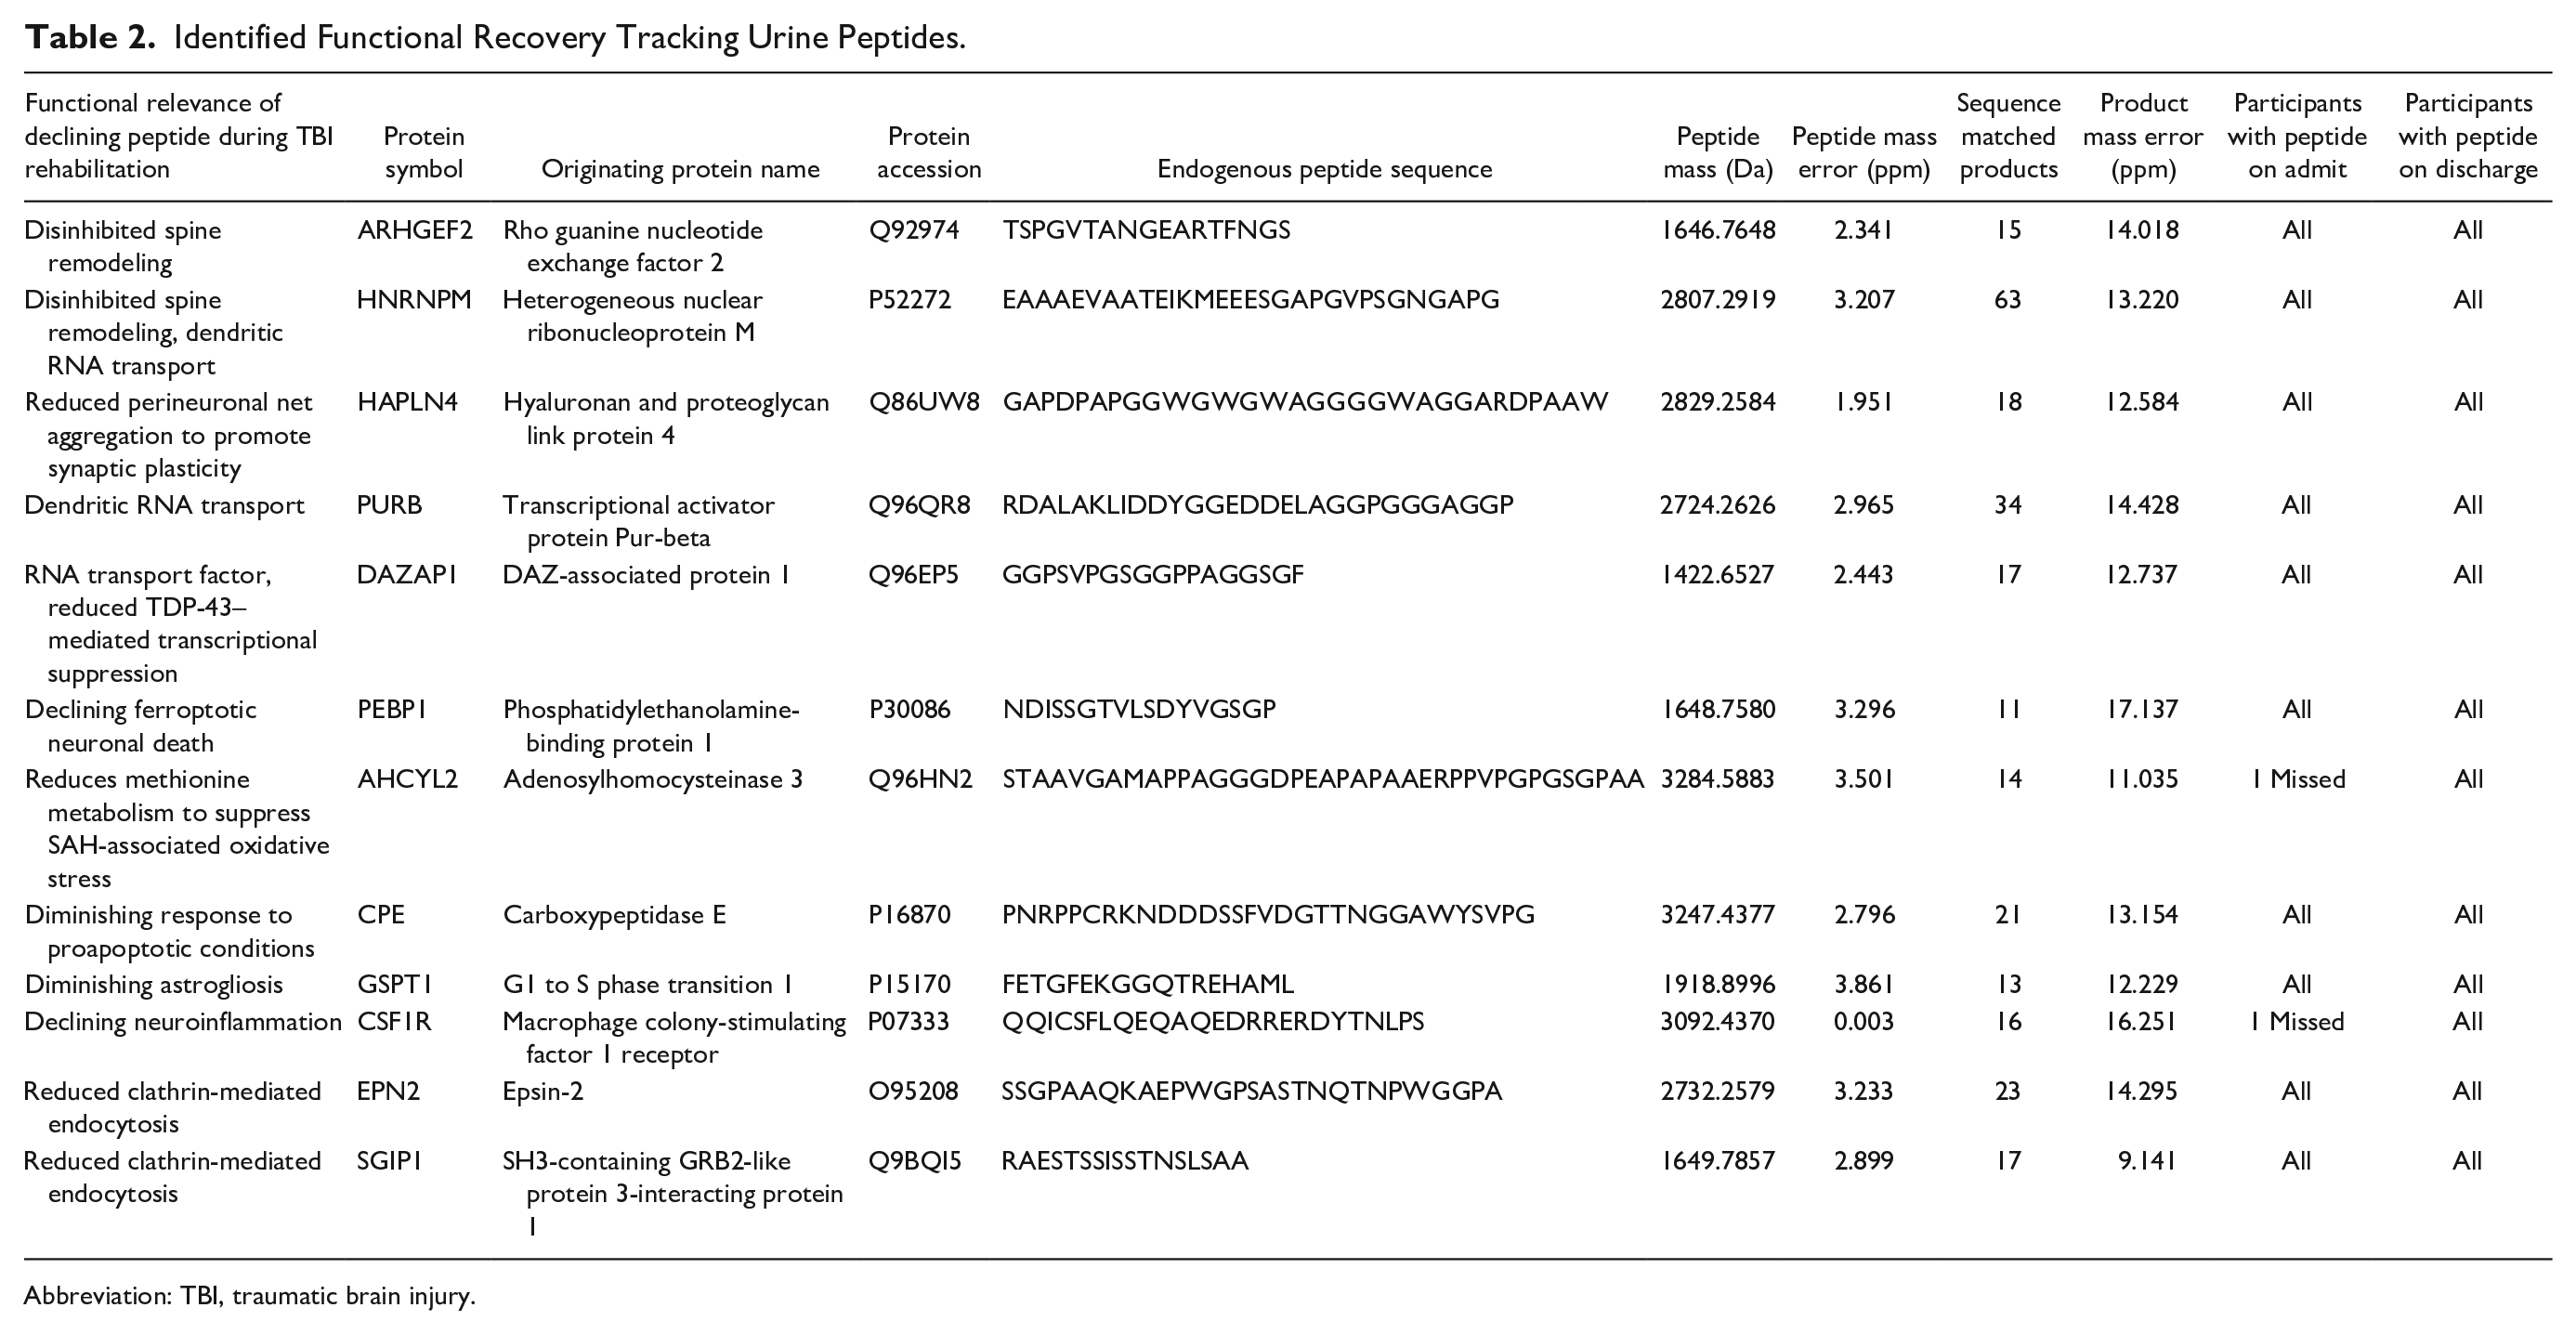
Abbreviation: TBI, traumatic brain injury.
Discussion
In this study, models of biomarker trajectory were devised utilizing our prior discovery of TBI-selective peptide byproducts released into the urine during rehabilitation. Generated models were furthermore assessed for their predictive potential in monitoring brain recovery over the course of rehabilitation. Results here capitalized on recent advancements in peptidomic assessment with data-independent mass spectrometry, a robust means to quantify endogenous peptides excreted into urine, and an optimal approach for developing biomarker assays in complex injury. 14 Urine provides a noninvasive, readily-collectable medium for diagnostic use across inpatient and outpatient settings.13,52 Urine is moreover enriched in secreted byproducts of ongoing pathobiology that are not attenuated by homeostatic mechanisms and has less lipid and proteinaceous interferants than blood. Discriminant peptide models of functional trajectory over rehabilitation were built against well-established DRS and FIM assessments. 15 PLS-DA results highlighted a subset of the most discriminant peptides, producing sensitive models with the specificity to differentiate those exhibiting greater functional gain. Subsequent peptide identification established pathobiological relevance by associating enhanced recovery with molecular measures indicative of heightened neuronal plasticity and diminished cellular injury and neuroinflammation.
We posit that peptide efflux from the brain enters systemic circulation primarily via intramural perivascular drainage via the interstitial fluid (ISF) to the deep cervical lymphatics and secondarily into ventricular cerebrospinal fluid, where it exchanges to the blood via arachnoid villi and the lymphatics, as illustrated in Figure 4. 53 The ISF drainage pathway plays a crucial role in waste clearance from the parenchyma and has been implicated in the efflux of injury biomarkers in prior studies. 54 Ambiguity remains over whether this pathway can be accurately defined as convective transport through the glymphatic system, 55 with conflicting evidence supporting diffusive solute transport from the ISF. 56 However, experimental results in either case support a size-dependent bias in molecular efflux from the parenchyma, with smaller molecular tracers (<10 kDa) and peptides (Aβ1-40) draining rapidly in contrast to the restricted flow of protein-sized solutes.53,57,58 Peptides then traverse the circulation and arrive at the renal glomerulus. The cationic (preferentially ionized in our mass spectrometry), sub–1.1-nm sized (<5 kDa) peptides evaluated here traverse with little to no impediment, avoiding the kidney’s negative charge-biased and >2.0 to 2.5 nm minimal size selectivity.59,60 Per this point, it should be recognized that only a subset of the proteolytic products induced by brain injury are observed in the urine, with many more likely to have been metabolized or retained because of a larger size or negative charge. Yet given the time frame of rehabilitation (weeks after injury), this endogenous system presents a continuous efflux pathway for those byproducts of injury and cellular regeneration that get cleared to the urine.
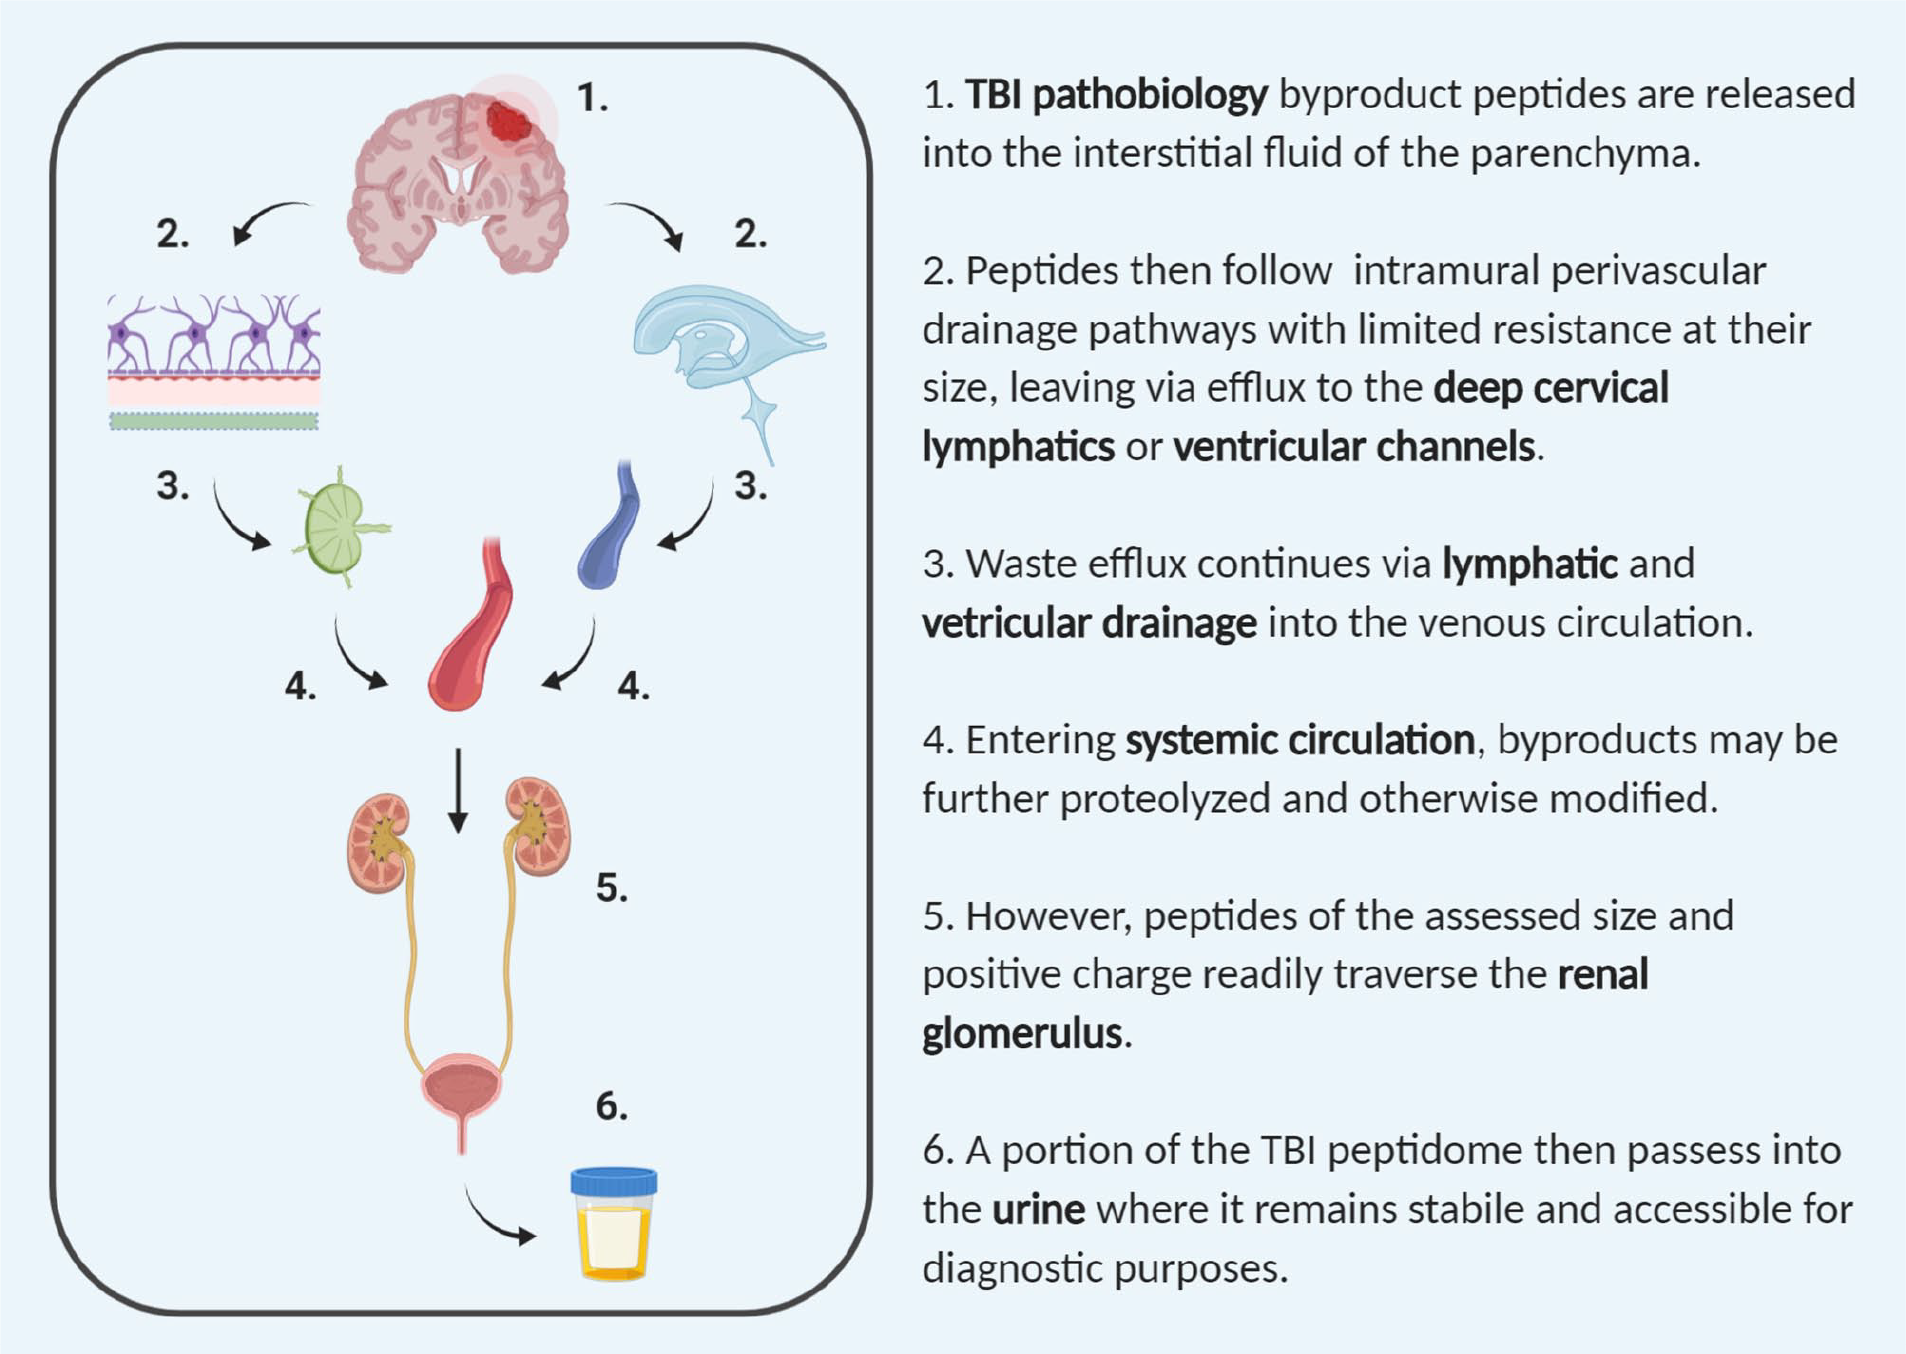
Physiological pathway for traumatic brain injury (TBI) peptidomic efflux. Pathobiological events following TBI involve the generation of peptides released into the interstitial fluid of the parenchyma as byproducts of degradative and signaling processes. As small molecular waste, a subset of these peptides is readily cleared from the brain via efflux pathways, as depicted here. Once in the systemic circulation, the TBI peptidome may be further modified; however, a subset of positively charged peptides readily assessed by the mass spectrometry assay used here exchange with minimal resistance into the urine.
DRS and FIM assessments provided the neurofunctional metrics upon which to develop the biomarker models. DRS and FIM are respectively 8-item and 18-item, peer-reviewed disability outcome measures widely used in the setting of TBI.17,21 DRS has shown particular value in both acute care and community settings. 16 FIM is distinctive per its use of detailed motor-specific and cognition-specific items allowing for more tailored disability assessment. 18 Given the similarities between DRS and FIM, it was not surprising that functional scores across inpatient rehabilitation were highly correlated between the 2 scales, supporting the notion that both tests captured similar functional phenomena. Furthermore, this explained how the participants were identically bifurcated into more-recovered or less-recovered groups per DRS or FIM scores. Yet despite this simple binomial coincidence, the most discriminant peptides (top-scoring 20 features) in DRS- and FIM-based models exhibited only 40% overlap, suggesting greater granularity at the molecular level. We also observed superior predictive performance with the DRS-based model than the FIM-based, which matched prior reports showing DRS measures as more sensitive to short-term functional changes and a more appropriate measure of long-term deficits than FIM. 17 Furthermore, DRS is focused more on a person’s functional recovery through rehabilitation, whereas FIM is angled at assessing the burden of care,17,21 suggesting again that DRS scores may provide a more direct assessment of functional gain. These considerations lend strength to selecting the DRS-based peptidomic model for further larger-scale follow-up studies tracking rehabilitation progress and predicting long-term outcome.
Neither of the aforementioned functional tests alone, however, are direct indicators of underlying pathobiology; they solely quantify observational data. Conversely, the biomarker models devised here portend pathobiological insight into the recovering brain in correlation with greater functional improvement, thereby promising more sensitive and specific individualized recovery assessment and a complementary tool for evaluating therapeutic interventions. With further development, these models may be refined to enable neurobiology-driven patient monitoring for optimizing rehabilitative care and to provide a more data-driven prognosis. Moreover, the continuous nature of peptide measurements across a wide dynamic range imply greater precision than possible with functional assessments such as DRS and FIM and their discrete scales. Likely peptide measures would thus offer greater sensitivity with fewer ceiling effects, particularly in assessing long-term functional gains over years from injury. 17 Although results here relate biomarkers to predicting a binary functional class, there also exists a greater potential to inform on distinct areas of pathobiology that may modulate recovery independently in a non-binary fashion, especially considering the numerous moderators and mediators that interact with these peptides in vivo.
Furthermore, the identified peptides can serve as direct theragnostic readouts of inferred disease-modifying pharmacological targets with the potential to augment brain injury rehabilitation. Of note, close to half of the identified peptides are directly relevant to neuroplastic processes. Hnrnpm and Arhgef2, in particular, are both known to negatively regulate dendritic spine development.34,36 Silencing Hnrnpm, for example, has been shown to increase the quantity of dendritic spines in experimental models. Decreased levels of both factors in DRS-based and FIM-based models, therefore, denoted disinhibited dendritic outgrowth during rehabilitation as a key correlate to greater recovery. Significantly, PLS-DA results placed Hnrnpm as the top-scoring feature in both models, speaking to its diagnostic importance as an underlying biological process driving functional improvement. Similarly, results here highlighted Hapln4 as an additional biomarker of enhanced neuroplasticity, with Hapln4 reducing over rehabilitation, indicative of perineuronal net deaggregation to promote plasticity,37,38 and found here to be correlative of greater functional recovery.
Hnrnpm is additionally categorized by its role as an RNA-binding protein involved in regulating dendritically targeted RNAs. 36 Conspicuously, the biomarkers identified here were significantly enriched (P = 1.099 × 10⁻⁵) in factors associated with dendritic RNA metabolism and transport that interact downstream with Rpa1, as a major polymerase subunit involved in RNA production. In addition to Hnrnpm, factors Arhgef2, Dazap1, and Purb were also associated with RNA metabolism. Hnrnpm and Dazap1 are heterogeneous nuclear ribonucleoproteins known to guide isoform selection in splicing target genes and influence dendritic protein expression.41,61 Arhgef2 and Purb, on the other hand, bind RNA to microtubules and are involved in trafficking RNA along dendrites and to spines.35,39 RNA metabolism in connection with the synapse is activity dependent, with polyribosomes being localized to dendritic spines upon heightened transmission. 62 In the context of inpatient rehabilitation, the measured decreases in association with RNA metabolism fit with an expected transition 1 month out from the injury to greater pruning as nascent synapses are refined to allow for functional improvement. 63 This may hold further importance in the context of interventions augmenting activity-dependent synaptic plasticity and refinement during brain injury rehabilitation 64 ; thus, these biomarkers may be particularly sensitive to therapeutic impacts.
In concert with a transition to neuroplastic recovery, the identified biomarkers additionally reflected declining acute brain injury pathobiology. Decreased Pebp1 measures during rehabilitation matched recovery from early ferroptotic neuronal death, 42 particularly associated with microhemorrhage in TBI. Similarly, decreased Ahcyl2 reflected on declining hemorrhage-associated oxidative stress in the brain, again a feature of acute pathobiology. 43 The declining observation of Cpe may also reflect on the transition from early phases of predominant cell death, with Cpe known to promote neuronal survival under proapoptotic conditions. 44 The identified biomarkers also reflected on declining factors associated with neuroinflammation. Gspt1, a component of the Rac1-Gspt1 signaling axis, is a principal signaling mechanism that accelerates astrogliosis. 45 Similarly, microglial proliferation early after injury is dependent on Csf1r. 46 Thus, approximately half of the biomarkers identified here reflected declining acute-phase pathobiology during rehabilitation that was correlated with enhanced functional recovery.
This study produced initial biomarker models that, in principle, provide urinary peptide measures to track functional recovery during rehabilitation; however, future studies are needed to address several limitations. A larger, more diverse moderate-severe TBI participant population is required to refine and validate these models. This proof-of-principle study was limited to a small participant population, limiting the ability to assess model reproducibility. Recognizing this from the outset, we designed the analysis approach to provide as much rigor and reproducibility as afforded with the available resources. Feature selection by Pavlidis template matching was used to eliminate spurious variables ahead of PLS-DA model refinement. In combination, this reduced the potential for model overfitting and conferred greater rigor, particularly in the situation where the number of biological factors exceeded the number of participants. To further extend the rigor of our analysis, additional participants were added during PLS-DA model refinement who were not included in the initial feature selection. Finally, the general predictive capability of the model was evaluated using the leave-one-out procedure, which is robust even with a small sample size, and orthogonal PCA analysis to avoid errant models. Study attrition rates here ended up being double that anticipated, which will inform planning in future, larger-scale studies. Attrition particularly influenced the ability to evaluate model performance out to the 1-year follow-up; thus, those results remain preliminary, though provocative. Future incorporation of participants with TBI not receiving inpatient rehabilitation would also be of interest in determining effects of rehabilitation versus natural recovery on the peptidomic response, which the present study is unable to distinguish. Furthermore, given the increasing insight and focus on the effects of biological sex on TBI recovery trajectories, we recommend greater inclusion of female participants with TBI for model refinement. 65 Results here were limited to binary classification based on an upper and lower distribution; however, this classification is largely arbitrary in the context of TBI diversity. Performance during rehabilitation is more graded, with a binary classification resulting in incongruous partitioning that may have influenced predictive participant placement. Building from these initial results, however, future studies would encompass broader inclusion to identify refined sets of biomarkers with predictive capabilities across multiple injury subtypes and functional deficits. Additionally, results here suggest that the characterization of the recovery trajectory may benefit by starting collection prior to inpatient rehabilitation. Earlier baseline assessments are likely to enhance sensitivity and provide additional detail to further stratify participant recovery. Finally, peptides secreted into urine may not reflect, in composition or proportion, the entire peptidome generated from injury because many peptides are likely catabolized in the body prior to arrival at the kidney or retained in circulation because of glomerular restrictions on molecule size and charge (Figure 4). More invasive sampling of fluids (specifically blood or cerebrospinal fluid) may provide further qualification and quantification of these undetected peptides. However, given our focus on utilizing the urinary peptidome as a noninvasive source of biomarkers, such analysis was outside the scope of our study.
Conclusions
In summary, this study establishes biomarker models that utilize the trajectory of peptidomic byproducts released after TBI as a means to monitor functional recovery during rehabilitation. Identified byproducts reflected correlation between enhanced plasticity and better functional performance as assessed by neurofunctional testing, with DRS-based models outperforming FIM-based ones. Results here are the first to demonstrate trajectory profiling of urinary peptides for diagnostic purposes during brain injury rehabilitation, warranting further exploration of peptidomic applications as a hitherto unexplored source of biochemically informative measures.
Supplemental Material
sj-docx-1-nnr-10.1177_1545968320975428 – Supplemental material for Secreted Peptides for Diagnostic Trajectory Assessments in Brain Injury Rehabilitation
Supplemental material, sj-docx-1-nnr-10.1177_1545968320975428 for Secreted Peptides for Diagnostic Trajectory Assessments in Brain Injury Rehabilitation by Parantap D. Patel, Jillian E. Stafflinger, Jennifer H. Marwitz, Janet P. Niemeier and Andrew K. Ottens in Neurorehabilitation and Neural Repair
Supplemental Material
sj-xlsx-2-nnr-10.1177_1545968320975428 – Supplemental material for Secreted Peptides for Diagnostic Trajectory Assessments in Brain Injury Rehabilitation
Supplemental material, sj-xlsx-2-nnr-10.1177_1545968320975428 for Secreted Peptides for Diagnostic Trajectory Assessments in Brain Injury Rehabilitation by Parantap D. Patel, Jillian E. Stafflinger, Jennifer H. Marwitz, Janet P. Niemeier and Andrew K. Ottens in Neurorehabilitation and Neural Repair
Supplemental Material
sj-xlsx-3-nnr-10.1177_1545968320975428 – Supplemental material for Secreted Peptides for Diagnostic Trajectory Assessments in Brain Injury Rehabilitation
Supplemental material, sj-xlsx-3-nnr-10.1177_1545968320975428 for Secreted Peptides for Diagnostic Trajectory Assessments in Brain Injury Rehabilitation by Parantap D. Patel, Jillian E. Stafflinger, Jennifer H. Marwitz, Janet P. Niemeier and Andrew K. Ottens in Neurorehabilitation and Neural Repair
Supplemental Material
sj-xlsx-4-nnr-10.1177_1545968320975428 – Supplemental material for Secreted Peptides for Diagnostic Trajectory Assessments in Brain Injury Rehabilitation
Supplemental material, sj-xlsx-4-nnr-10.1177_1545968320975428 for Secreted Peptides for Diagnostic Trajectory Assessments in Brain Injury Rehabilitation by Parantap D. Patel, Jillian E. Stafflinger, Jennifer H. Marwitz, Janet P. Niemeier and Andrew K. Ottens in Neurorehabilitation and Neural Repair
Footnotes
Acknowledgements
The authors thank the medical staff of the Brain Injury Rehabilitation Unit of VCU Health, Drs Cifu, Kunz, and Walker, and the nursing staff, for crucial assistance on the unit; William Korzun for conducting the osmolarity analysis; and Pavel Lizhnyak for assistance with data processing. The authors also thank Stephan Tenzer for early access to Isoquant ion alignment without prior identification. The authors are grateful to the participants and their families for contributing to this research.
Declaration of Conflicting Interests
The author(s) declared no potential conflicts of interest with respect to the research, authorship, and/or publication of this article.
Funding
The author(s) disclosed receipt of the following financial support for the research, authorship, and/or publication of this article: This study was funded by grants from the National Institute of Neurological Disorders and Stroke (NS055012) and the National Institute of Child Health and Human Development (HD05922), and the National Institute on Disability, Independent Living, and Rehabilitation Research (90DPTB0005) of the Administration for Community Living, US Department of Health and Human Services.
References
Supplementary Material
Please find the following supplemental material available below.
For Open Access articles published under a Creative Commons License, all supplemental material carries the same license as the article it is associated with.
For non-Open Access articles published, all supplemental material carries a non-exclusive license, and permission requests for re-use of supplemental material or any part of supplemental material shall be sent directly to the copyright owner as specified in the copyright notice associated with the article.