
Abstract
Background. Proprioception of fingers is essential for motor control. Reduced proprioception is common after stroke and is associated with longer hospitalization and reduced quality of life. Neural correlates of proprioception deficits after stroke remain incompletely understood, partly because of weaknesses of clinical proprioception assessments. Objective. To examine the neural basis of finger proprioception deficits after stroke. We hypothesized that a model incorporating both neural injury and neural function of the somatosensory system is necessary for delineating proprioception deficits poststroke. Methods. Finger proprioception was measured using a robot in 27 individuals with chronic unilateral stroke; measures of neural injury (damage to gray and white matter, including corticospinal and thalamocortical sensory tracts), neural function (activation of and connectivity of cortical sensorimotor areas), and clinical status (demographics and behavioral measures) were also assessed. Results. Impairment in finger proprioception was present contralesionally in 67% and bilaterally in 56%. Robotic measures of proprioception deficits were more sensitive than standard scales and were specific to proprioception. Multivariable modeling found that contralesional proprioception deficits were best explained (r2 = 0.63; P = .0006) by a combination of neural function (connectivity between ipsilesional secondary somatosensory cortex and ipsilesional primary motor cortex) and neural injury (total sensory system injury). Conclusions. Impairment of finger proprioception occurs frequently after stroke and is best measured using a quantitative device such as a robot. A model containing a measure of neural function plus a measure of neural injury best explained proprioception performance. These measurements might be useful in the development of novel neurorehabilitation therapies.
Introduction
Proprioception of the fingers is central to human behavior. Deficits in proprioception are found in 50% or more of individuals with stroke,1-3 can be present in both limbs after a unilateral infarct, 2 and are associated with poorer outcomes.1,2,4
The goal of the current study was to understand key factors underlying interparticipant differences in finger proprioception after stroke, findings that could foster development of novel approaches to neurorehabilitation. Previous approaches that aimed to measure injury of somatosensory areas in isolation have not comprehensively explained proprioception deficits after stroke. 5 The primary hypothesis, therefore, was that a model incorporating both neural injury and neural function of the somatosensory system would better explain proprioception deficits poststroke. This is based on increasing evidence that both forms of measurement are needed to most robustly explain variance in behavioral outcomes after stroke.6-8 As part of this, a new method for measuring sensory system injury, lesion overlap with the thalamocortical sensory tract (TST), was examined.
A key consideration in this study was the method by which proprioception is measured. Bedside tests of proprioception, such as estimating the angle of joint deflection or indicating the timing of passive joint movement, are subjective and nonstandardized 2 and have low sensitivity, high variability, 2 floor effects, 9 and low reliability.2,9-12 Robotic devices have been shown to better quantify arm sensory impairments following stroke3,13,14 but to date have not been used to measure poststroke proprioception deficits in finger joints, an afferent data stream critical to human function. 15 To address the objectives of this study, we developed and used a novel exoskeletal robotic device that measures finger proprioception with high sensitivity.16,17
Methods
Participant Enrollment
A total of 27 individuals with chronic stroke participated. Inclusion criteria (see Supplement) in sum were age 18 to 80 years, radiologically confirmed unilateral stroke >6 months prior, and arm motor deficit as determined by the Box and Blocks (B&B) test (contralesional B&B score was required to be ≥3 and at least 10% less than the performance by the ipsilesional hand). The B&B test is a measure of arm motor function at the World Health Organization ICF activities limitation level that is scored by counting the number of blocks carried over a partition during a 1-minute trial. Patients were excluded if they had significant cognitive impairment or another diagnosis affecting hand function. Proprioception data collected for a previously published normative study 16 using identical methods in 25 healthy age-matched individuals were used as control data.
Standard Protocol Approvals, Registrations, and Consents
The local ethics committee approved this study, and written informed consent was obtained from each participant prior to participating following procedures established by the University of California Irvine Institutional Review Board and the Declaration of Helsinki.
Proprioception Assessment
Passive finger position sense was measured using the FINGER (Finger Individuating Grasp Exercise Robot) exoskeleton robotic device (Figure 1),16,17 which guides index and middle fingers through motion around metacarpophalangeal and proximal interphalangeal joints, allowing individual finger guidance. The robot slowly (up to 13°/s) moved the index and middle fingers in opposing directions during a series of 12 nonperiodic finger-crossing movements, of different distances and angular velocities. The order of these crossings was pseudorandom, so that all participants got the same set. For each finger-crossing movement, participants were instructed to press a keyboard spacebar when they perceived their index/middle fingers were directly aligned relative to one another. This task lasted 2 minutes for each hand, with the ipsilesional hand tested first. Error on each finger-crossing movement was defined as the angular distance between the metacarpophalangeal joints when the spacebar was pressed. Cognitive status was confirmed by requiring that each participant could correctly repeat full task instructions to the examiner. Further details are described in the Supplement.
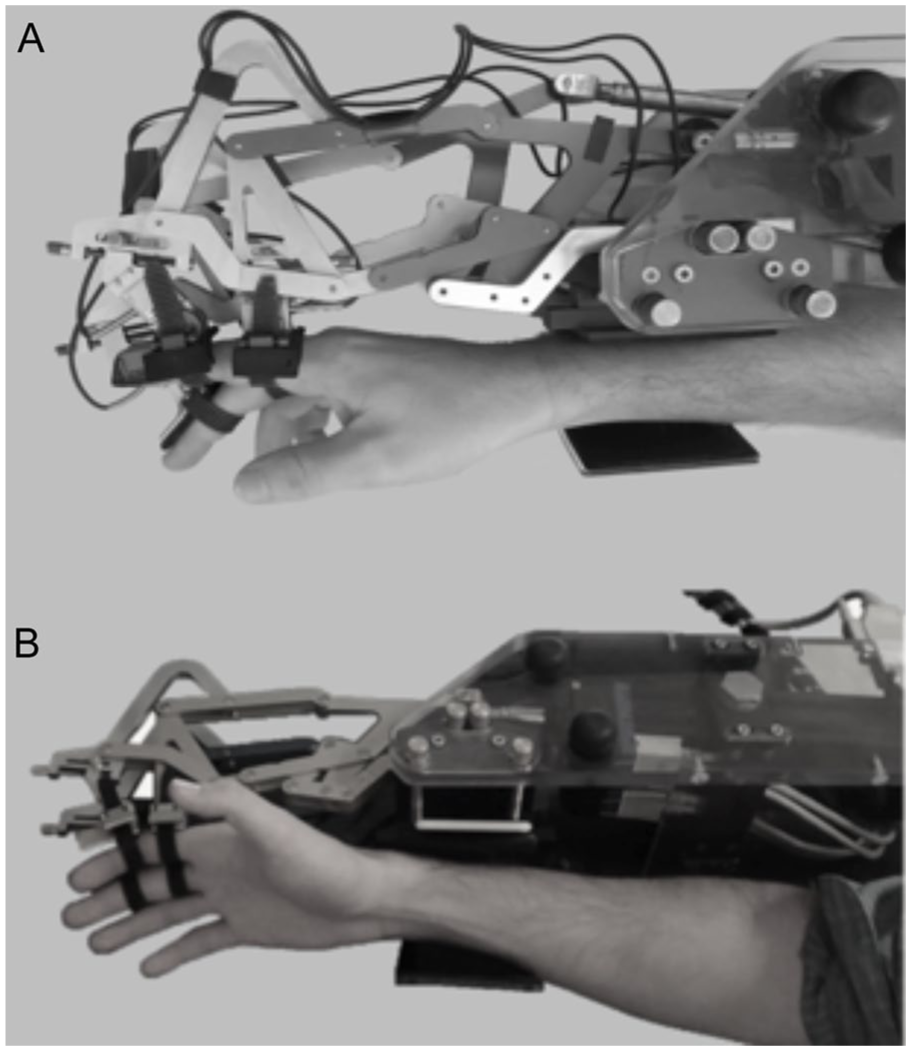
The FINGER robot used to perform the proprioception task, as seen from (A) lateral and (B) oblique views. The index and middle fingers attach to the robot and are guided through finger-crossing movements during the proprioception task. The robot aligns with the plane of the participant’s index and middle fingers, maintaining a naturalistic gap between the fingers and eliminating any somatosensory input that might otherwise be generated on finger crossing.
Demographics/Medical History
Medical history was obtained, including handedness, determined using the Edinburgh Handedness Inventory. 18 Stroke severity was assessed with the National Institutes of Health Stroke Scale (NIHSS). 19
Sensorimotor Behavior
Motor status was evaluated with the Action Research Arm Test (ARAT) 20 , B&B test, 21 Nine Hole Peg Test (number of seconds to complete the task, maximum score 60s), 22 and Finger Tapping Test (number of finger taps over 10 s). 23 The motor and sensory Fugl-Meyer (FM) arm assessments were also obtained.24,25
Image Acquisition
On a 3T Philips magnetic resonance imaging (MRI) machine, high-resolution T1-weighted images were acquired using a 3-dimensional MP-RAGE sequence (150 slices, 1-mm3 voxels). T2 FLAIR images were also acquired. Four runs of BOLD (blood oxygenation level-dependent) functional MRI (fMRI) were acquired using a T2*-weighted gradient-echo sequence (TR = 2000 ms; TE = 30 ms; each run with 48 brain volumes = 96 s), during which participants were visually guided to alternate 24 s of rest with 24 s of active 0.5-Hz index and middle finger flexion/extension movements; participants had varying degrees of motor control and made their best efforts to achieve these movements during scanning. During the scan, participants wore a nonactuated plastic exoskeleton similar to the robotic interface used during the proprioception task. An investigator observed movements during the scan to ensure compliance.
Gray Matter Injury
Using MRIcron, 26 each participant’s infarct was outlined by hand on the T1-weighted MRI image, informed by FLAIR image, in a standardized, reliable manner, as described previously. 27 Stroke masks were transformed into Montreal Neurological Institute (MNI) standard stereotaxic space using the Functional Magnetic Resonance Imaging of the Brain Software Library. 28 Stroke masks for participants with right-sided lesions were flipped about the midsagittal plane.
The degree of overlap that each stroke mask had with several cortical regions of interest (ROIs) was calculated. Using Marsbar, 29 spherical ROIs representing the 3 focal brain ROIs were generated: the hand region of the primary motor cortex (M1), the hand region of the primary somatosensory cortex (S1), and the operculum parietal (OP) 4 subregion of the secondary somatosensory cortex (S2) 30 in both the ipsilesional (iM1, iS1, and iS2) and contralesional (cM1, cS1, and cS2) hemispheres. The percentage of stroke mask overlap with each ROI was calculated for each participant and indicates the proportion of voxels in an ROI that overlapped with each stroke mask, expressed as a percentage.
White Matter Injury
For each participant, stroke-related injury to 2 key white matter tracts was quantified by measuring the extent to which the participant’s infarct overlapped with the normal white matter tract in MNI stereotaxic space. A template of each normal white matter tract was created using diffusion tensor imaging (DTI) tractography in healthy control participants via methods described previously. 31 This approach, rather than DTI fiber tracking, was used to measure tract injury because the latter method can be problematic in brain regions affected by stroke. The 2 tracts of interest (Figure 2) were the corticospinal tract (CST) and the TST.
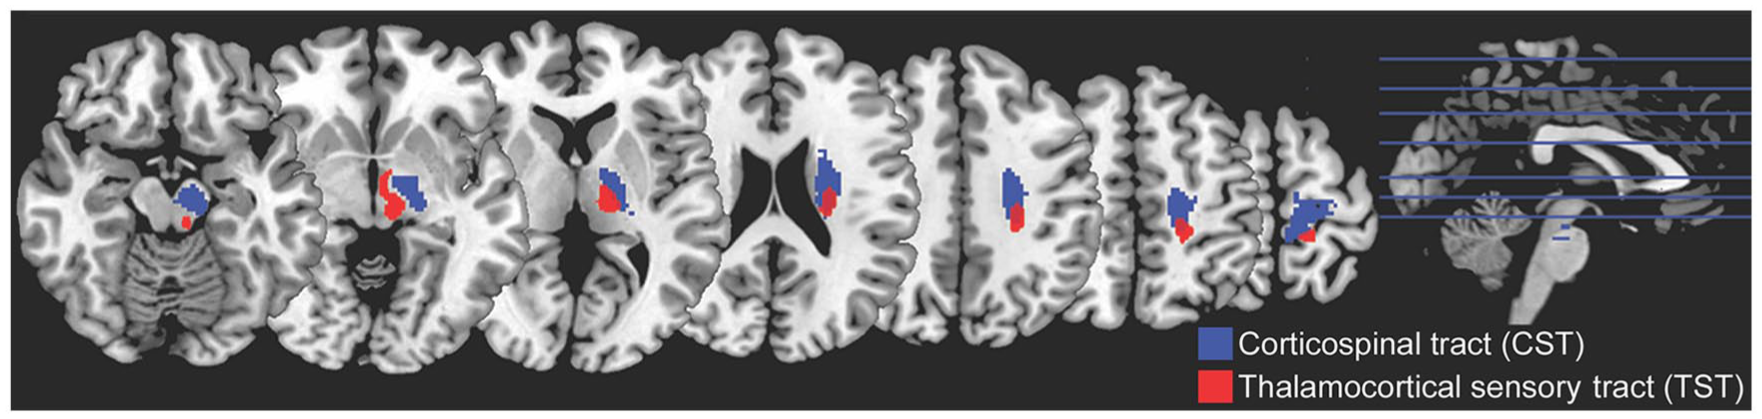
The normal CST and TST tracts, as generated from probabilistic tractography of DTI data from healthy control participants. Blue tract is CST; red tract, TST. Tracts are overlaid on a T1-weighted MRI template.
Injury to the CST was thus measured as the percentage of overlap between each participant’s infarct and the normal CST, with the measurement covering the CST from the precentral gyrus to the pontomesencephalic juncture (ventral to which the CST is no longer a contiguous bundle), an approach that has been validated previously.7,8,31-34 As part of the current study, we extended this approach to measuring somatosensory tract injury by defining the TST, measurement of which covered regions from the postcentral gyrus to the ventral posterolateral nucleus of the thalamus. Injury to the TST was calculated as the percentage of overlap between each participant’s infarct and the normal TST (further details in the Supplement).
Total System Injury
A comprehensive measure of network injury within the stroke-affected hemisphere was calculated as total system injury, separately for the sensory system and for the motor system. To quantify total sensory system injury, S1, S2, and TST percentage injury measures were each standardized, and values were then averaged for each participant. To quantify total motor system injury, standardized injury measures to M1 and CST were averaged.
Functional Activation
Two measures of regional brain function were extracted from fMRI images: (1) activation volume and (2) peak activation beta (contrast) estimate, each measured contralesionally and ipsilesionally M1, S1, and S2 (Supplement).
Functional Connectivity
Connectivity was assessed as the temporal correlation using an ROI-ROI approach. After the fMRI data were preprocessed in SPM12, intrahemispheric and interhemispheric functional connectivity metrics were calculated using the CONN toolbox 35 (Supplement).
Statistical Analysis
The primary approach to measuring the frequency of proprioception impairment for the contralesional and ipsilesional hands of participants with stroke used a 2-SD criterion of abnormality based on the performance of age-matched healthy controls 16 ; a secondary approach is presented in the Supplement. To evaluate between-group (contralesional, ipsilesional, and control) differences, a mixed-effect model with participant as a random effect and group as a fixed effect was performed, using t-tests in post hoc analyses.
Predictors of contralesional proprioception error were examined in 2 stages. First, bivariate screening was performed to identify measures in the 5 main categories that best accounted for interparticipant variability in contralesional proprioception error. For each of the 5 main categories (2 reflecting clinical measures, demographics/medical history and sensorimotor behavior; 2 reflecting measures of neural function, cortical function and cortical connectivity; and 1 reflecting measures of neural injury, brain injury), results of bivariate screening determined whether any individual assessment survived as a correlate of proprioception error and would be advanced to multivariable modeling. Second, a forward stepwise multivariable linear regression model (0.1 to enter, 0.15 to leave the model) was used to understand interparticipant variability in proprioception, advancing the most significant predictors from each category identified in bivariate screening (as long as bivariate screening showed P < .1).
Normally distributed data (assessed using the Shapiro-Wilk W test) and data that could be transformed to a normal distribution (square root normalization) were analyzed using parametric statistics; otherwise nonparametric statistics (Wilcoxon signed rank test or Spearman’s rank correlation) were used. Analyses were 2-tailed and calculated using JMP software (version 9.0.0, SAS Institute).
Results
Behavioral data from 27 participants with unilateral chronic stroke were available for analysis (Table 1). All participants completed testing with the exception of 2 participants who could not complete MRI (claustrophobia). Two participants were excluded from cortical function and connectivity analyses because of excessive head motion during scanning, and 5 participants were excluded from white matter injury analyses because of lesion location below the thalamus.
Characteristics of Participants With Stroke.
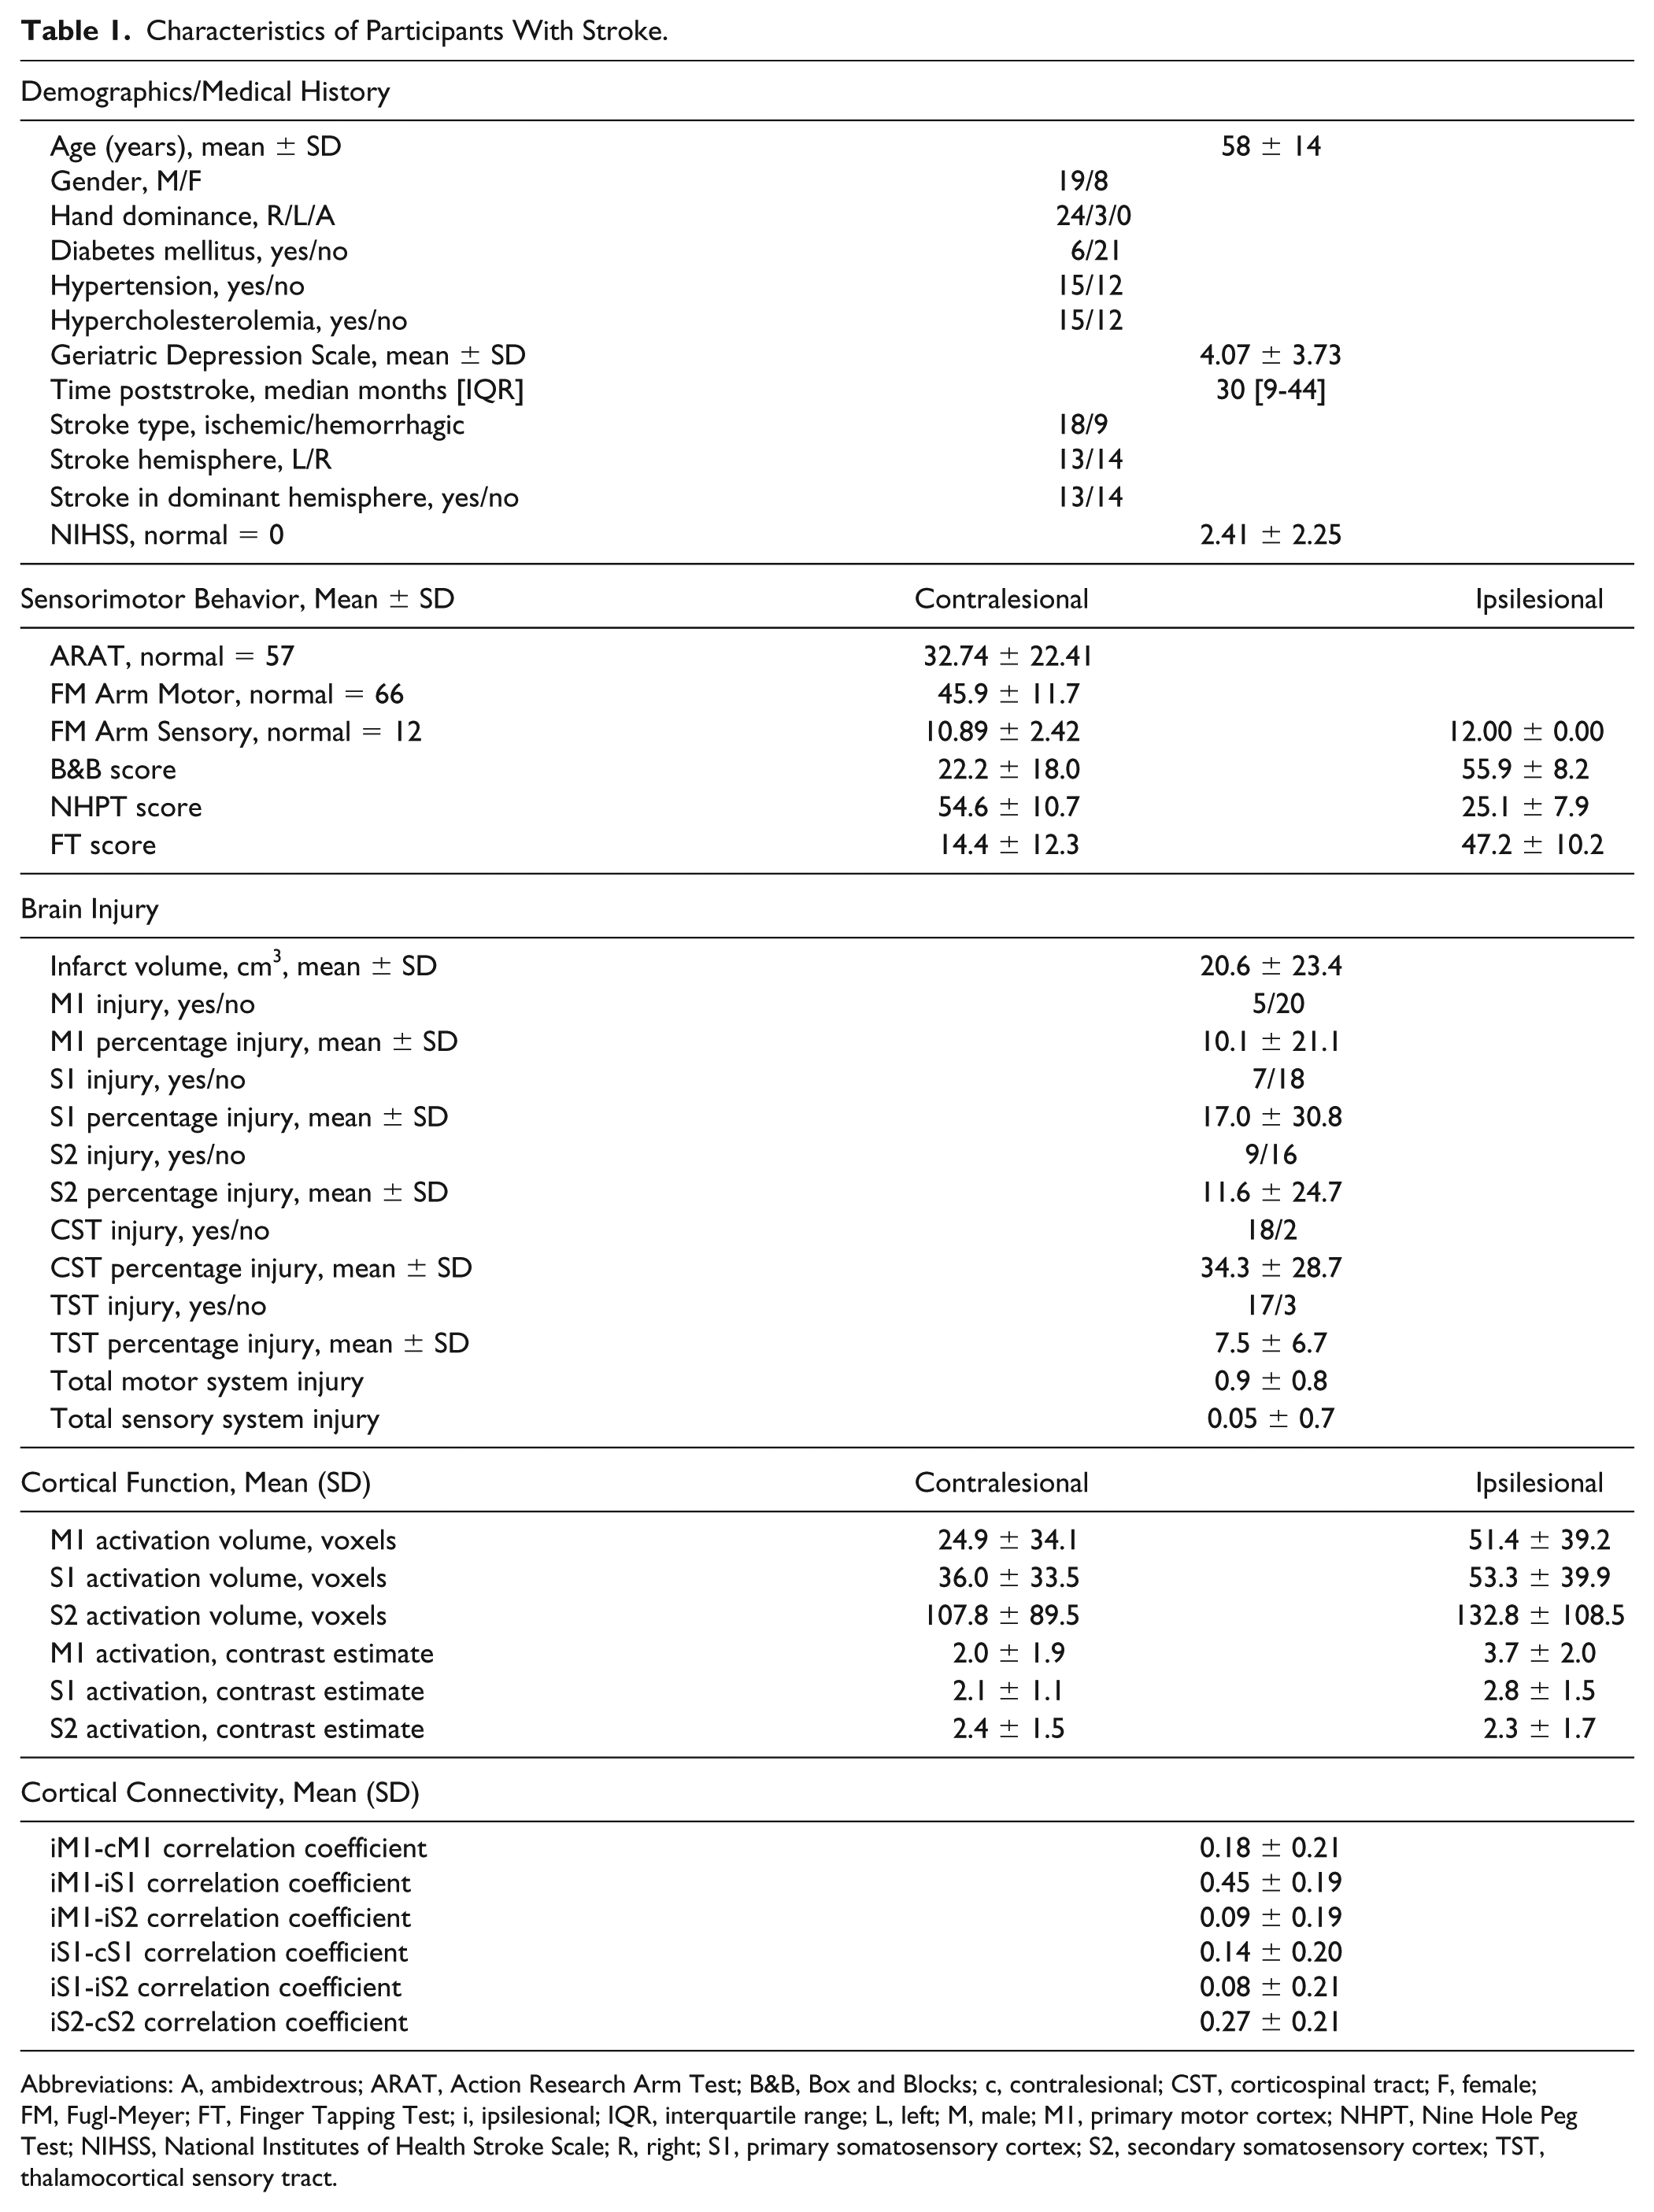
Abbreviations: A, ambidextrous; ARAT, Action Research Arm Test; B&B, Box and Blocks; c, contralesional; CST, corticospinal tract; F, female; FM, Fugl-Meyer; FT, Finger Tapping Test; i, ipsilesional; IQR, interquartile range; L, left; M, male; M1, primary motor cortex; NHPT, Nine Hole Peg Test; NIHSS, National Institutes of Health Stroke Scale; R, right; S1, primary somatosensory cortex; S2, secondary somatosensory cortex; TST, thalamocortical sensory tract.
Proprioception Error
During proprioception testing, 25/27 participants with stroke detected all 12 finger-crossing movements. Participants with stroke made both early and late responses during the task (Figure 2A), with 50.8% of all responses preceding, and 49.2% of errors following, finger crossing. These findings mirror results in a previously reported cohort of age-matched, neurologically intact, healthy control participants, 16 among whom 23/25 participants detected all 12 finger-crossing movements, and 49.0% of responses preceded (and 51.0% followed) finger crossing.
Participants with stroke had larger proprioception error than controls, bilaterally, and this was more pronounced in the contralesional hand. In the cohort of healthy control participants, 16 proprioception error was 7.3° ± 3.8° (mean ± SD) for the dominant hand and 6.8° ± 3.0° for the nondominant hand. There was no significant difference in error between dominant and nondominant control hands (t(23) = −0.80; P = .40), and so for subsequent analyses, control error refers to average of control dominant and nondominant hands. In participants with stroke, proprioception error was 16.2° ± 6.4° for the contralesional hand and 13.3° ± 5.4° for the ipsilesional hand. There was little floor effect because only a single participant with stroke scored the maximum error. Within-subject error after stroke was highly reliable because across the 12 finger-crossing movements in the contralesional hand, the SD was 5.9°. Proprioception error in the contralesional hand was positively related to error in the ipsilesional hand (Figure 3B; r = 0.65, P = .0002). The main effect of group (stroke vs healthy control) was significant (t(77) = 5.94; P < .0001), as were post hoc pairwise comparisons: contralesional hand errors were larger than ipsilesional hand errors (t(26) = −2.97; P = .006) and were also larger than control errors (t(50) = 6.39; P < .0001); ipsilesional hand errors were larger than control errors (t(50) = 5.02; P < .0001).
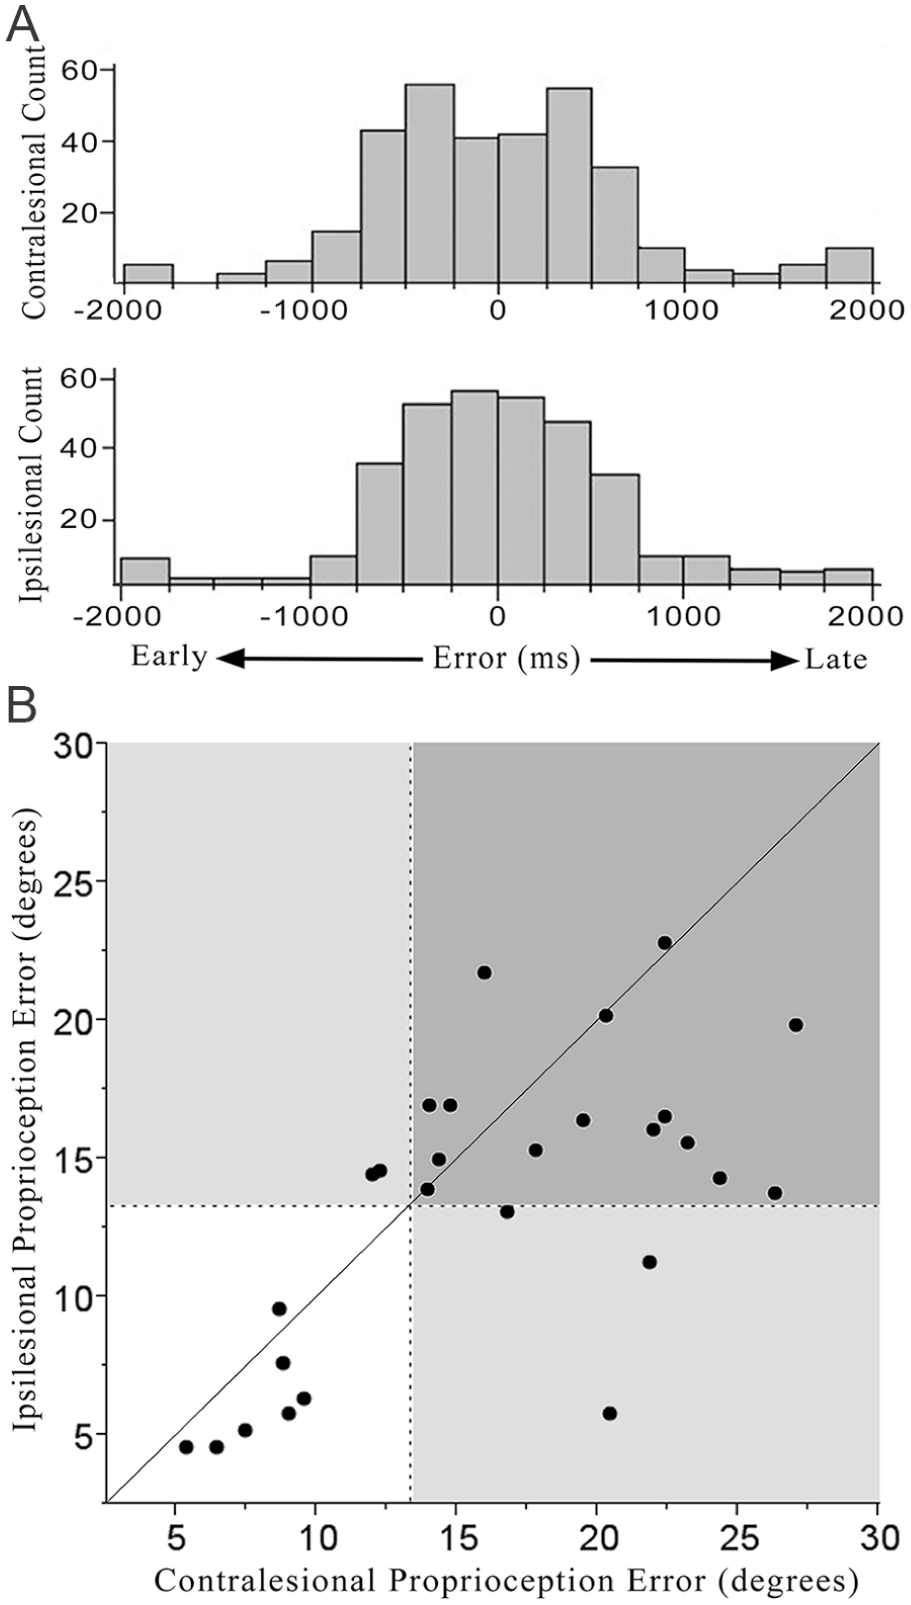
Timing and magnitude of proprioception errors for each hand after stroke. A. Distribution of error times (difference between when the 2 fingers moved by the robot actually crossed and when the participant reported them as crossed) is presented for each hand. Participants with stroke made both early and late responses during the task, with 50.8% of all responses preceding, and 49.2% of errors following, finger crossing. Number of early versus late responses did not differ according to hand tested (P = .78). B. Magnitude of proprioception error (number of actual degrees separating the 2 fingers when the participant reported them as crossed) is presented for contralesional and ipsilesional hands after stroke. These errors were classified as abnormal when >2SD beyond normative values from a cohort of age-matched, neurologically intact, healthy control participants 16 (dashed lines). Proprioception error also distinguishes patients from healthy controls when examined in a threshold-independent manner (Supplemental Figure 1). The solid diagonal line indicates equal contralesional and ipsilesional hand impairment. Impaired performance for the contralesional hand is indicated to the right of the vertical dashed line, whereas impaired performance for the ipsilesional hand is indicated above the horizontal dashed line.
Impaired proprioception, defined as >2SD of the abnormality in healthy controls, 16 was present in the majority of participants with stroke: 67% had contralesional impairment, 63% had ipsilesional impairment, and 56% had bilateral impairment of proprioception. In comparison, when assessed with the FM sensory scale, only 7/27 (26%) had contralesional arm sensory impairment and 0/27 had ipsilesional arm sensory impairment. The NIHSS sensory subscale showed contralesional sensory deficits in 12/27 (44.4%). Notably, robot-assessed proprioception deficits were specific to sensory function because contralesional proprioception error correlated with clinical sensory assessments (FM sensory score: r = −0.39, P = .046; NIHSS sensory subscore: r = 0.47, P = .01) but not with clinical motor assessments (FM motor score: r = −0.26, P = .19; see Supplement for additional motor details) or other clinical tests (NIHSS language subscore: r = 0.12, P = .55; NIHSS attention subscore: r = 0.26, P = .20; Geriatric Depression Scale score: r = 0.18, P = .37).
Correlates of Proprioception Error
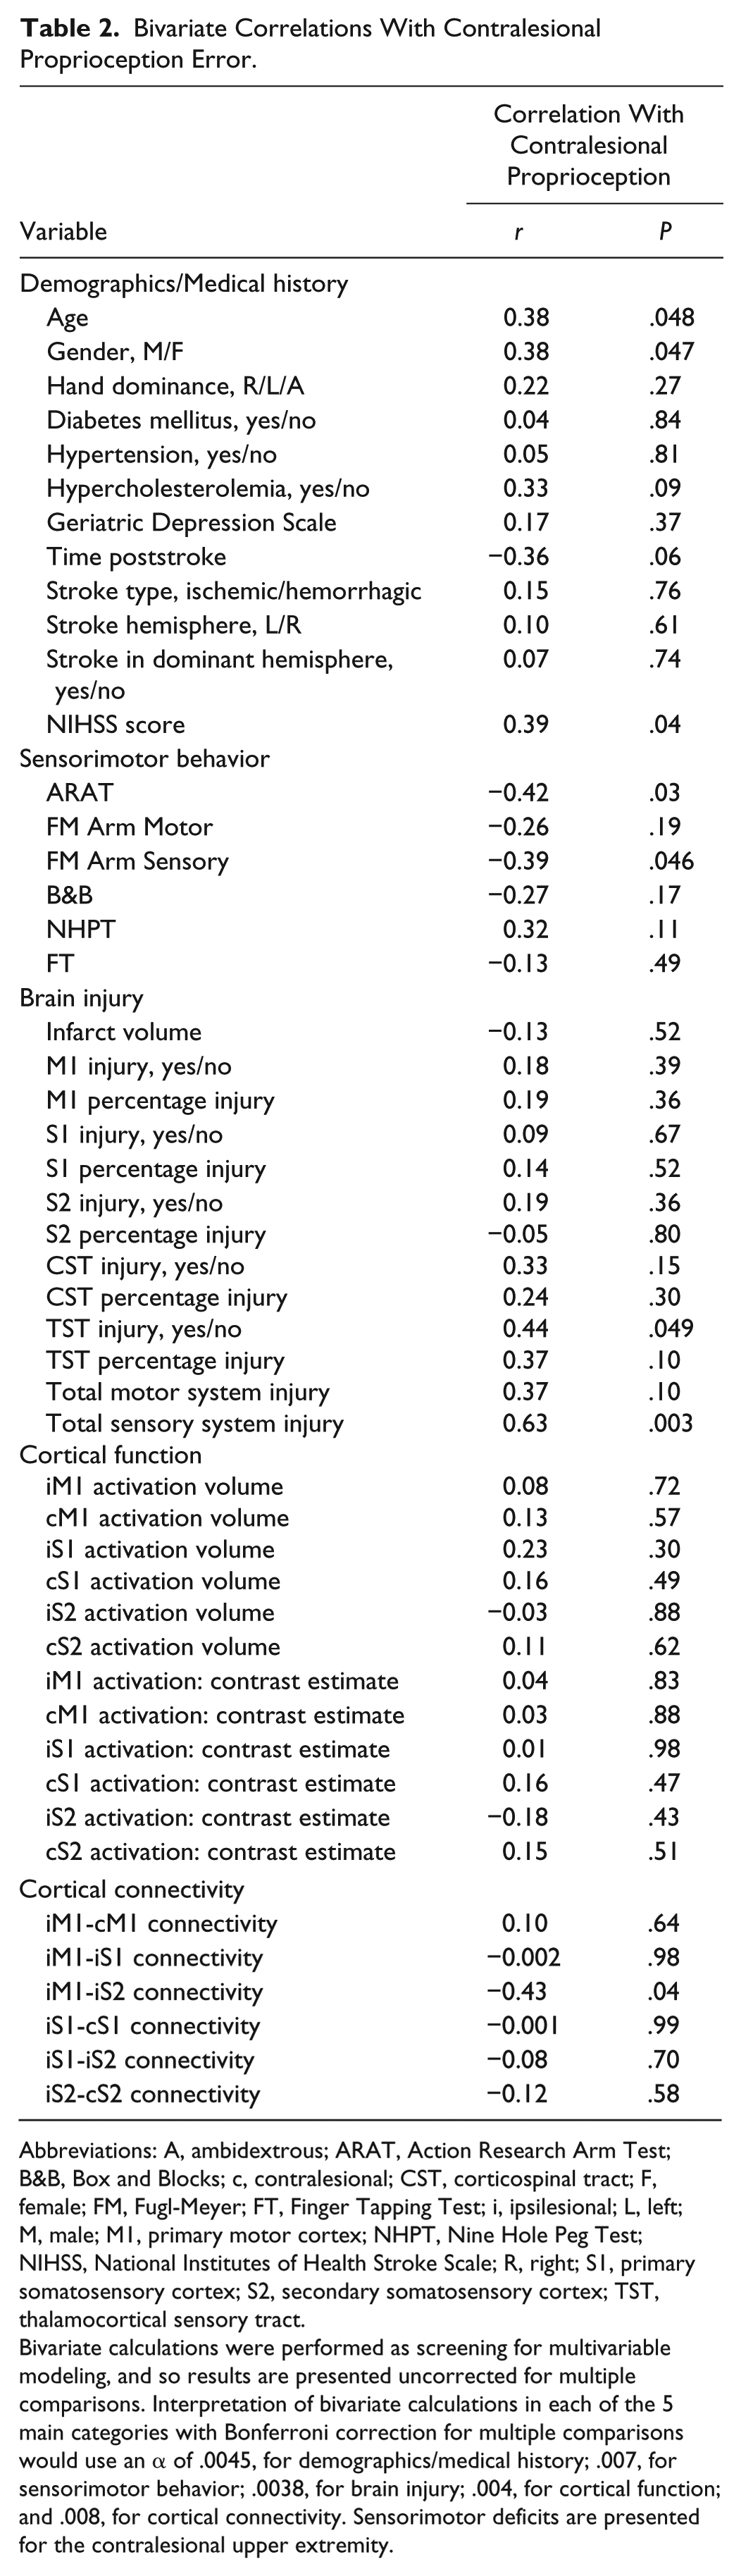
Bivariate screening identified significant correlates of proprioception error in 4 of the 5 categories (Table 2). The most significant variables within these categories were NIHSS (demographics/medical history), ARAT (sensorimotor behavior), total sensory system injury (brain injury), and iM1-iS2 functional connectivity (cortical connectivity). No variables were significant on bivariate screening within the cortical function category. Excluding participants with ≥50% damage to cortical ROIs 36 had no significant effect on bivariate correlations.
Bivariate Correlations With Contralesional Proprioception Error.
Abbreviations: A, ambidextrous; ARAT, Action Research Arm Test; B&B, Box and Blocks; c, contralesional; CST, corticospinal tract; F, female; FM, Fugl-Meyer; FT, Finger Tapping Test; i, ipsilesional; L, left; M, male; M1, primary motor cortex; NHPT, Nine Hole Peg Test; NIHSS, National Institutes of Health Stroke Scale; R, right; S1, primary somatosensory cortex; S2, secondary somatosensory cortex; TST, thalamocortical sensory tract.
Bivariate calculations were performed as screening for multivariable modeling, and so results are presented uncorrected for multiple comparisons. Interpretation of bivariate calculations in each of the 5 main categories with Bonferroni correction for multiple comparisons would use an α of .0045, for demographics/medical history; .007, for sensorimotor behavior; .0038, for brain injury; .004, for cortical function; and .008, for cortical connectivity. Sensorimotor deficits are presented for the contralesional upper extremity.
Connectivity findings were specific for the OP 4 subdivision of S2. The iM1-iS2 connectivity reported here was calculated using the OP 4 subdivision of S2. OP 4 was selected to be the primary ROI for S2 analyses because it is known to play a role in sensorimotor integration. In contrast, the OP 1 subdivision of S2 is involved in tactile working memory and perceptual learning. OP1 was thus examined as a negative control and indeed connectivity between iM1 and the OP 1 subdivision of iS2 did not correlate with contralesional proprioception error (r = −0.13; P = .54).
Multivariable Modeling
When the 4 strongest correlates that survived bivariate screening were entered into a forward stepwise multivariable linear regression model, 2 terms survived: total sensory system injury (P = .002; Figure 4A) and iM1-iS2 functional connectivity (P = .01; Figure 4B). The resultant multivariable model containing these terms explained 63% of variance in proprioception error for the contralesional hand of participants with stroke (P = .0006; Table 3).
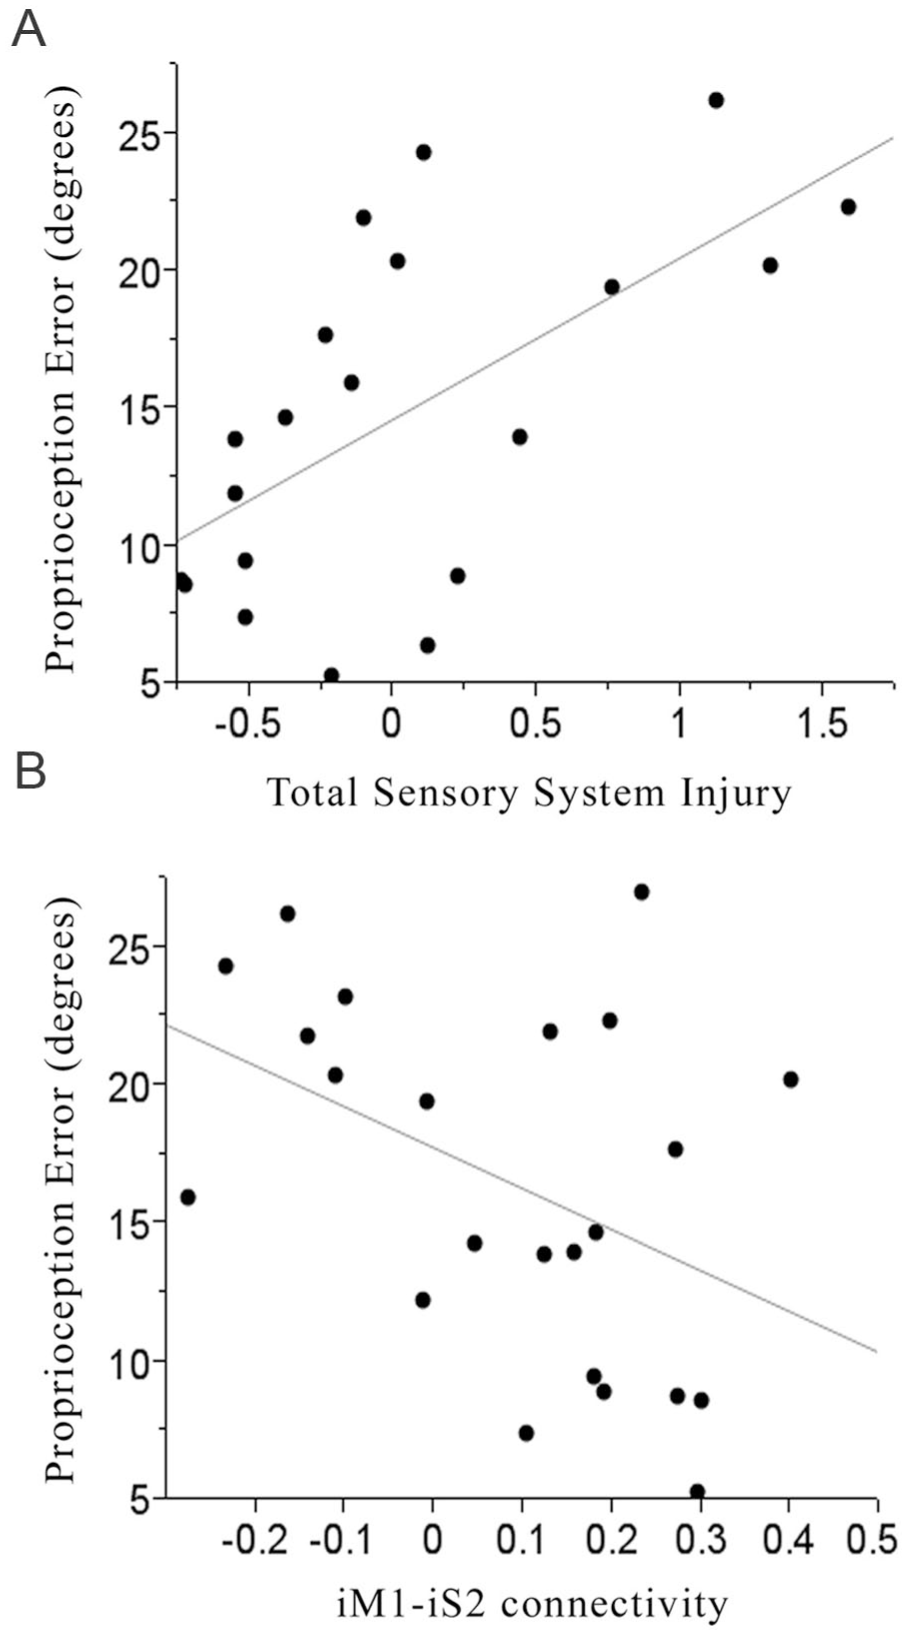
For participants with stroke, (A) smaller total sensory system injury (r = 0.63; P = .003) and (B) greater iM1-iS2 functional connectivity (r = −0.43; P = .04) were each associated with smaller contralesional finger proprioception error.
Multivariable Predictor Model.
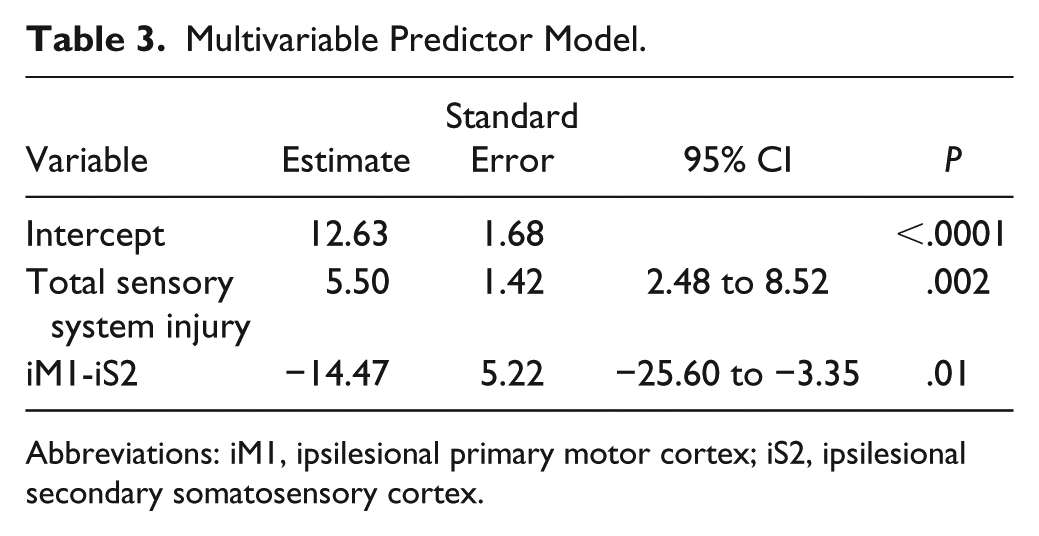
Abbreviations: iM1, ipsilesional primary motor cortex; iS2, ipsilesional secondary somatosensory cortex.
Discussion
Proprioception of the fingers is essential for motor control and human behavior. Reduced proprioception after stroke is also a strong marker of overall stroke impact, being associated with increased length of hospitalization, higher mortality, and diminished quality of life.1,2,4 However, the neural correlates of proprioception deficits after stroke remain incompletely understood, in part because of weaknesses of clinical approaches for measuring proprioception. These issues were addressed in the current study, including a new method for measuring injury to the TST in individual participants (Figure 2). The FINGER robot was used to measure finger proprioception deficits and found these to be present bilaterally in a majority of participants.
The current study observed that 67% of participants with stroke have contralesional finger proprioception deficits, a rate that is consistent with prior reports.1-3 These robotic measures of proprioception deficits were specific, correlating with scores on sensory but not motor, cognitive, language, or other scales. Historically, assessment of proprioception has been deemed subjective, insensitive, nonstandardized, and unreliable.2,9-12 Robotic approaches have been advanced to address these concerns, but with limitations. For example, the KINARM robot3,14 requires participants to make detailed movements of the ipsilesional arm, so that its position mirrors the static position held by the contralesional arm, an approach that attains robotic precision but requires transcallosal processing of sensory signals plus precise ipsilesional limb sensorimotor function. These confounds were avoided with the current approach, which was found to be valid in relation to 2 clinical scales of sensory impairment. A robotic assessment such as with the FINGER robot provides a measurement that is both continuous and linear, features that have advantages for behavioral studies. 37 The current study also observed that 63% of participants with stroke have finger proprioception deficits ipsilesionally (Figure 3B), possibly reflecting stroke-related disturbances in sensory network function within contralesional and ipsilesional hemispheres,38,39 interhemispheric signal transfer,6,40 and changes in the interaction between sensory networks and other networks such as those related to attention or cognitive processing.41,42
Proprioception deficits in contralesional fingers varied widely (Figure 3). This variability was best explained by a multivariable model that incorporated measures of neural injury (better proprioception with less severe total sensory system injury) and neural function (better proprioception with greater iM1-iS2 functional connectivity). These results emphasize the importance of incorporating both neural injury and neural function to understand behavioral status in chronic stroke. This combined approach explained far more variance in proprioception error (63%, Table 3) than any single measure did (≤39.7%, Table 2). Including measures of both injury and function to understand behavior is consistent with preclinical 43 and human motor studies6-8 and, here, extends this model for understanding poststroke behavior to sensory systems.
To date, relatively little is known about the specific association between lesion location and deficits in proprioception.44,45 One challenge to understanding this relationship may be that sensory functions such as proprioception arise from a highly distributed network,15,46,47 and so a measure of injury to a single sensory system area may provide a lower level of insight as compared to a measure of injury across the sensory network (Table 2). The highly distributed nature of somatosensory cortical networks might also explain why contralesional finger proprioception deficits correlated better with sensory system measures than with motor system measures, although a relationship was apparent for ARAT score and for iM1-iS2 connectivity (Table 2). In the current study an aggregate measure of total sensory system injury was examined, including both white matter and gray matter injury, and this was superior to any single regional sensory system injury measure for explaining proprioception (Table 2, Figure 4A). White matter injury was measured using a new method, lesion overlap with the TST, via a canonical tract generated a priori that aimed to model the sensory component of the superior thalamic radiation 44 (Figure 2), injury to which has been linked to poststroke sensory deficits.42,44 Gray matter injury within total sensory system injury was measured as lesion overlap with regions representing hand areas of S1 and S2. Integrity of S1 has been previously shown to have an impact on proprioception. 45 The S2 region, which responds bilaterally to somatosensory stimuli and has distinct subdivisions,30,48,49 has received increased attention as important to understanding somatosensory deficits after brain injury.28,50 Results emphasize the value of measuring both gray matter and white matter injury to best understand stroke effects on a widely distributed system.
The measure of neural function that best explained proprioception error was functional connectivity, which reflects strength of temporal synchrony of BOLD signals between spatially remote brain regions and which has increasingly been used to investigate behavioral status poststroke, though to date this has not been examined with respect to proprioception. In the current study, connectivity between iM1-iS2 was identified as a key correlate of proprioception error, such that stronger iM1-iS2 connectivity was associated with better proprioception (Figure 4B). Notably, this connectivity metric was significant only when the OP 4 subdivision of S2 was evaluated. This is likely related to the fact that OP 4 has strong anatomical and functional connections with M1 and S1 and plays a key role in sensorimotor integration. 49 In comparison, the OP 1 subdivision of S2 has strong connections with the anterior inferior parietal cortex and is responsible for complex functions such as tactile working memory and perceptual learning 51 ; connectivity between iM1 and OP 1 subdivision of S2 did not survive bivariate screening (P = .54). It is also important to note that connectivity measures were determined using scans that involved active finger movement. On one hand, sensory and motor components of finger movement are highly intertwined and overlapping, such that the fMRI pattern of brain activation during a passive finger task is similar to what is observed during active finger movement after stroke, with differences mainly related to intensity.52,53 On the other hand, current connectivity results in relation to proprioception error must be interpreted with the specific fMRI connectivity probe in mind.
Strengths of the current study include use of a sensitive and quantitative robotic assessment of proprioception as well as examination of multiple classes of explanatory variables. A population with a wide range of sensorimotor deficits was evaluated, increasing the likelihood that results generalize. The study is limited by incomplete testing in some participants, for example, because of claustrophobia. The current measure of finger proprioception deficits might be affected by motor deficits or by slowed reaction time, given that a motor response was required to indicate finger crossing, and thus if the motor response were impaired, this may have caused additional error above that attributable to finger proprioception deficits. Several points argue that this additional source of error would likely be small: (1) Participants performed a very simple binary task—pressing the spacebar key—and they did this across a very small range of motion, using the less-impaired (nonstroke) hand. (2) The robot moved the fingers slowly, making the task more of a predictive than a reactive task. Thus, even if reaction time were slowed for the less-impaired hand, it would likely not have a large influence because participants had time to anticipate when the crossing would occur. (3) Proprioception deficits had a weak or nonsignificant relationship with contralesional motor deficits (Table 2), suggesting that any stroke effects on the ipsilesional motor response used to measure proprioception was limited. (4) That proprioception deficits were best explained by measures related to connectivity in, and anatomical damage to, the somatosensory system (Table 3) further supports the contention that current measures reflected proprioception and not slowed reaction time or other potential reflections of motor impairment in the key-pressing hand.
Together, results indicate that impairment of finger proprioception is common after stroke, bilaterally, and is best modeled by measures of neural injury and neural function involving the brain sensory system. The measurements identified in this study may be useful for the design of novel neurorehabilitation strategies.
Supplemental Material
Supplementary_material_NNR20190506c – Supplemental material for Neural Correlates of Passive Position Finger Sense After Stroke
Supplemental material, Supplementary_material_NNR20190506c for Neural Correlates of Passive Position Finger Sense After Stroke by Morgan L. Ingemanson, Justin R. Rowe, Vicky Chan, Jeff Riley, Eric T. Wolbrecht, David J. Reinkensmeyer and Steven C. Cramer in Neurorehabilitation and Neural Repair
Footnotes
Supplementary material for this article is available on the Neurorehabilitation & Neural Repair website along with the online version of the article.
Declaration of Conflicting Interests
The author(s) declared the following potential conflicts of interest with respect to the research, authorship, and/or publication of this article: Dr Reinkensmeyer is a cofounder of Flint Rehabilitation Devices, has received payment for consulting, and holds equity in Hocoma. Both companies are manufacturers of rehabilitation technology. The terms of these interests have been reviewed by the UC Irvine Conflict of Interest committee. Dr Rowe is employed by Flint Rehabilitation Devices. Dr Cramer has consulted for Abbvie, Constant Pharmaceutical, Dart Neuroscience, MicroTransponder, Neurolutions, Regenera, SanBio, and TRCare.
Funding
The author(s) disclosed receipt of the following financial support for the research, authorship, and/or publication of this article: The work described was supported by R01-HD062744, K24-HD074722, and UL1-TR001414.
References
Supplementary Material
Please find the following supplemental material available below.
For Open Access articles published under a Creative Commons License, all supplemental material carries the same license as the article it is associated with.
For non-Open Access articles published, all supplemental material carries a non-exclusive license, and permission requests for re-use of supplemental material or any part of supplemental material shall be sent directly to the copyright owner as specified in the copyright notice associated with the article.