
Abstract
Background. Recent studies have shown that focal injuries can have remote effects on network function that affect behavior, but these network-wide repercussions are poorly understood. Objective. This study tested the hypothesis that lesions specifically to the outflow tract of a distributed network can result in upstream dysfunction in structurally intact portions of the network. In the somatomotor system, this upstream dysfunction hypothesis predicted that lesions of the corticospinal tract might be associated with functional disruption within the system. Motor impairment might then reflect the dual contribution of corticospinal damage and altered network functional connectivity. Methods. A total of 23 subacute stroke patients and 13 healthy controls participated in the study. Corticospinal tract damage was quantified using a template of the tract generated from diffusion tensor imaging in healthy controls. Somatomotor network functional integrity was determined by resting state functional connectivity magnetic resonance imaging. Results. The extent of corticospinal damage was negatively correlated with interhemispheric resting functional connectivity, in particular with connectivity between the left and right central sulcus. Although corticospinal damage accounted for much of the variance in motor performance, the behavioral impact of resting connectivity was greater in subjects with mild or moderate corticospinal damage and less in those with severe corticospinal damage. Conclusions. Our results demonstrated that dysfunction of cortical functional connectivity can occur after interruption of corticospinal outflow tracts and can contribute to impaired motor performance. Recognition of these secondary effects from a focal lesion is essential for understanding brain–behavior relationships after injury, and they may have important implications for neurorehabilitation.
Keywords
Introduction
Traditional localization theories in neurology emphasize the relationship between focal structural damage and behavioral deficits. However, recent advances in computational neuroscience1-3 have indicated that brain networks are widely distributed.4,5 Accordingly, after injury, many neuroimaging studies have reported abnormalities in task-evoked blood oxygen level–dependent (BOLD) activity in structurally intact regions. Furthermore, recovery of behavioral deficits has been associated with normalization of activity in the damaged hemisphere and with rebalancing of activity across hemispheres.6-13 More recently, changes in functional connectivity (FC), that is, the interregional correlation of task-evoked or spontaneous activity, have also been documented after stroke and associated with neurological deficits.14-17 These observations raise a fundamental question: What is the relationship between structural damage and physiologic abnormalities in regions that are distant from the area of damage?1,18,19 Here, we considered how resting state functional connectivity (rsFC) in the somatomotor network is influenced by structural damage to its major outflow, the corticospinal tract (CST), where the somatomotor network is operationally defined as the regions showing significant functional connectivity with the primary somatomotor cortex (central sulcus). 20 The human somatomotor network is a good system in which to explore our question because much is already known about its components and connections21-24 and how CST damage affects motor recovery.25-27
We studied whether rsFC in the somatomotor network was influenced by the degree of structural damage to the CST in 23 patients with subacute stroke. Assuming that somatomotor rsFC depends predominantly on the integrity of reciprocal corticocortical or corticothalamic connections,15,28,29 one possibility was that CST damage would not correlate with changes in rsFC. Alternatively, any correlation between rsFC and CST damage would imply that the spontaneous coherence of motor regions changes in response to CST injury. The mechanisms underlying such a relationship are not known but could involve compensatory cortical overactivation,30,31 activity-dependent plasticity,32-34 and structural remodeling of pyramidal cells in cortical layer V. 35 We also investigated the relative contributions of CST damage and somatomotor rsFC to motor deficits.
To investigate the relationship between CST damage and rsFC, a correlational approach was used. To determine the separate contributions of CST damage and rsFC to behavioral impairment and the presence of any rsFC × CST damage interaction, a multiple linear regression approach was used given that both independent variables were continuous. We predicted that if an rsFC × CST damage interaction was present, it would take the form of a stronger relationship between rsFC and behavior when CST damage was mild than when CST damage was severe. Establishing these relationships could have implications for the stratification and treatment of stroke patients during rehabilitation.
Methods
Approach
Using diffusion tensor tractography (DTT), a template of the CST in healthy individuals was developed and used to calculate indices of CST damage in subacute stroke patients (<4 weeks poststroke) with subcortical lesions. Along with stroke lesion volume these measures were correlated with a battery of motor scores. In parallel, BOLD functional magnetic resonance imaging (fMRI) measures of rsFC were obtained in the somatomotor system and were correlated with CST damage and behavioral measures. Finally, the 3-way relationship between CST damage, rsFC, and behavior was examined using multiple regression.
Participants
First time stroke patients were recruited. Potential candidates were identified by a research coordinator through daily monitoring of the inpatient service at Barnes-Jewish Hospital (BJH), and The Rehabilitation Institute of St Louis (TRISL). Inclusion criteria were (a) age >18 years and (b) 4 weeks or less since the time of infarct. Exclusion criteria were (a) prior strokes except for clinically silent lacunes; (b) evidence of grade 3 or greater periventricular white matter disease 36 ; (c) dementia, defined as a score >13 on the Short Blessed scale; (d) medical conditions preventing survival for 12 months; and (e) prior history of psychiatric conditions; however, patients with recent depression in the setting of stroke or minor depression in the past were enrolled.
A total of 23 patients (mean age ± SD = 59.6 ± 13 years, 12 women, 22 right-handed) participated in the study. All 23 patients underwent resting state fMRI scanning and 16 underwent motor testing. All participants provided informed consent according to procedures established by the Washington University in Saint Louis Institutional Review Board and were compensated for their time. A total of 13 healthy right-handed subjects participated in this study and were used to develop the CST template.
Diffusion Tensor Image Acquisition in Controls
In the healthy subjects, imaging was performed on a 1.5 T Siemens Vision Scanner (Erlangen, Germany). Structural scans included a T1-weighted (T1W) sagittal magnetization-prepared rapid gradient echo (MPRAGE; TR = 1900 ms, TI = 1100 ms, TE = 3.9 ms, flip angle 15°, 1 × 1 × 1.25 mm voxels) and a T2-weighted (T2W) fast spin echo scan (TR = 4380 ms, TE = 94 ms, 1 × 1 × 3 mm). Diffusion weighted images were collected in 48 directions in a series of 4 acquisitions, each consisting of 12 directions using a locally modified echo planar imaging (EPI) sequence (TR = 7000 ms, TE = 113 ms, 2.5 isotropic voxels, b value = 800 to 1200 s/mm2). Four complete diffusion tensor imaging (DTI) data sets were acquired in each participant.
Diffusion Tensor Image Registration
The first acquired, unsensitized (b = 0 s/mm2) DTI volume was registered to the T2W image; stretch and shear was enabled (12-parameter affine transform) to partially compensate for EPI distortion. Atlas transformation was computed via the T1W image, which was registered to an atlas representative target produced by mutual coregistration of an MP-RAGE atlas produced from 12 normal, young adults. 37
Head Motion Correction
Each DTI volume data set was motion corrected using 3 iterative cycles through a 4-step procedure (please see Supplementary Materials for details).
Region of Interest Identification for Diffusion Tensor Tractography
A superior region of interest (ROI) was placed in the posterior limb of the internal capsule (IC) at the level at which the superior–anterior fornix is oriented at a 45° angle in the sagittal plane. Geniculate fibers of the posterior IC were excluded.
An inferior ROI was placed over the cerebral peduncle (CP). Tracing began 3 slices superior to the most superior slice on which the cerebropontine fibers are present. The cerebropontine fibers are easily and consistently identified on the RGB maps. Elliptical ROIs were drawn around the superior–inferior traveling fibers of the CP. An exclusionary ROI was traced around the CST in the pons to ensure that no fibers leaving the brainstem were included in the analysis.
Diffusion Tensor Tractography Corticospinal Tract Template Generation in Controls
Whole brain streamline tractography38,39 was performed for each subject by placing a seed point for tracking at every voxel in the subject’s brain. Tracking was performed only in areas of anisotropy >0.13 and a radius of curvature restriction of <1 mm was used as a stop criterion. Streamlines from a number of independent seedpoints could converge and traverse common voxels before diverging toward their endpoints. The streamline density in a particular voxel was therefore the number of streamline representations that traveled through that voxel.
The filtered CSTs were transformed to atlas space to construct a common CST template. CST maps were created by thresholding at 10% of maximum streamline density. Individual subject binary maps were then summed to produce a composite map. This map was thresholded at a value of 6 (of 13) to produce a group model of the CST. The remaining analysis was performed with this template.
Quantification of Corticospinal Tract Template Damage in Stroke Patients
Lesion segmentation was performed as previously reported. 16 The amount of CST template damage was quantified for each stroke patient by creating a conjunction map of the CST template with the lesion map for that individual. The total number of voxels at the intersection between each patient’s stroke lesion map and the CST template was determined and was reported as a percentage of total CST template (% CST damage).
Resting State BOLD fMRI and Structural Scanning
In total, 23 acute stroke patients were scanned. A Siemens 3.0 T Allegra MRI scanner was used. During resting state BOLD fMRI scans, subjects were instructed to maintain fixation on a central cross projected onto a screen at the head of the magnet bore by a Sharp LCD projector (“Keep your eyes open, look at the cross”). Fixation and wakefulness were confirmed via infrared camera and no subject had to be excluded on this basis or because of excessive movement in the scanner. Participants viewed the stimuli through a mirror attached to the head coil. A gradient echo echo-planar sequence was used (TE = 25 ms, flip angle = 90°, 4 × 4 × 4 mm voxels, 32 contiguous slices, volume TR = 2.06 s) sensitive to BOLD contrast. Each BOLD fMRI scan (or run) consisted of 128 frames (or volumes) and lasted for 4.4 minutes. In all, 6 to 8 resting scans were obtained for each subject, with a very brief break between each scan. The separate resting state BOLD fMRI runs for a subject were concatenated into a single data set for that subject. Structural images for atlas transformation and lesion segmentation were acquired using a T1-weighted MP-RAGE (1 × 1 × 1.25 mm voxels; TE = 3.93 ms, TR = 1810 ms, TI = 1200 ms, flip angle = 12°) and T2-weighted fast spin echo sequence (1.1 × 1.1 × 3.0 mm voxels; TE = 96 ms, TR = 8430 ms).
Atlas Transformations
An atlas representative MP-RAGE target was produced by mutual coregistration (12 parameter affine transformations) of images obtained in 12 normal subjects. Atlas transformation of the functional data was computed using the average of the first frame of each functional run and the T2 and MP-RAGE structural images. A cross-modal registration aligned the first frame average to the T2 image. A similar procedure registered the T2 image to the MP-RAGE image. An affine transformation then registered the MP-RAGE image to the atlas target. This target atlas was used for all the stroke patients. A separate representative MP-RAGE target was produced for the 13 healthy subjects who contributed to the creation of the CST template using the same approach. This target was used for all the healthy subjects contributing to construction of the CST template.
Preprocessing of Resting fMRI Time Series
Preprocessing included compensation for asynchronous slice acquisition, elimination of odd–even slice intensity differences resulting from interleaved acquisition, head motion compensation by 6 parameter rigid body realignment, whole brain intensity normalization, atlas transformation, spatial smoothing (6 mm full-width at half-maximum Gaussian blur), temporal filtering retaining frequencies >0.009 Hz and <0.08 Hz, and removal by regression of several sources of variance unlikely to reflect spatially specific functional correlations. The first 4 frames of each BOLD run were excluded from analysis because the net magnetization has not yet reached a steady state. Other details of preprocessing were the same as outlined by Fox et al. 40
Definition of Networks
Six core regions for the somatomotor network (central sulcus [CS], supplementary motor area [SMA], secondary somatosensory region [S2], putamen [Put], thalamus [Thal], contralateral cerebellum [CB]) were identified from the conjunction of significant voxels in 2 prior experiments in which healthy subjects pointed to stimuli on a screen with their right index finger, using only wrist rotation. A conjunction analysis indicated the right hand somatomotor network voxels that were present in 5 of the 6 motor seed maps. A left arm network was identified by flipping the 6 ROIs from across the midline and then repeating the same procedure.
ROI-to-ROI Connectivity Values
The average time course across voxels of one ROI was correlated with the average time course of other ROIs. Pearson correlation coefficients (r) for ROI pairs were calculated and the Fisher z transform was applied to yield measures that are approximately normally distributed. To compute an average connectivity score for multiple ROI pairs, the Fisher z scores for the individual ROI pairs were averaged (see Supplementary Materials). These are the connectivity values that were used for all statistical analyses.
Voxelwise Functional Connectivity Maps From a Single Seed ROI
For purposes of illustration, fcMRI maps corresponding to a selected seed ROI were generated. A BOLD time course was extracted from each voxel within the seed ROI and averaged across voxels. The average time course was then correlated with the time course of each voxel within the brain. The Fisher z transform was applied to the correlation coefficient at each voxel and plotted to generate a functional connectivity map. Voxelwise maps were not used for any statistical analysis.
Motor Testing
Active range of motion
Degrees of shoulder flexion, wrist flexion, and wrist extension. 41
Grip strength
A dynamometer measurement of the maximum amount of force produced during a 5-finger grip. 42
Action Research Arm Test
The Action Research Arm Test (ARAT) measures upper extremity function using an ordinal score on 19 items (including tests of grasp, grip, pinch, and gross motor function using a variety of objects). Maximum score is 57 indicating normal upper extremity function. 43 This test is highly sensitive to change at various time points poststroke and is well correlated with other upper extremity function measures. 44
Nine-Hole Peg Test (NHPT)
Subjects are timed in their ability to place 9 small pegs on a board and then remove them as quickly as possible. 45
Functional Independence Measure–Walking Item (FIM)
The FIM Walk is a lower level measure of independent walking ability in patients with limited walking ability 46 ; the score is an ordinal rating from 1 = complete dependence to 7 = independence.
Statistics
Statistical comparisons were performed in Predictive Analytics Software version 17 (previously SPSS, Chicago, Illinois). To study the relationship between CST damage and rsFC or behavior, bivariate correlations were calculated. To determine the amount of variance in behavioral scores that was attributable to CST damage or to changes in functional connectivity, multiple linear regression approach was used to investigate main effects. The percentage behavioral variance accounted for by any term was calculated as % variance = (the type III sum of squares for the term/type III sum of squares for the corrected total) × 100. To determine if there were a statistically significant interaction between rsFC and % CST damage on behavior, a separate multiple linear regression model was used containing the factors rsFC, % CST damage, and the interaction rsFC × % CST damage. This interaction was also studied using a 2-way analysis of variance (ANOVA) with median values defining the 2 levels for rsFC and for % CST damage (see Supplementary Materials).
Results
Quantification of Corticospinal Tract Damage After Stroke
Templates of the left and right CST were created based on DTT in 13 healthy individuals (Figure 1A). Each voxel included in a template was present in at least 6 out of 13 tractography maps.
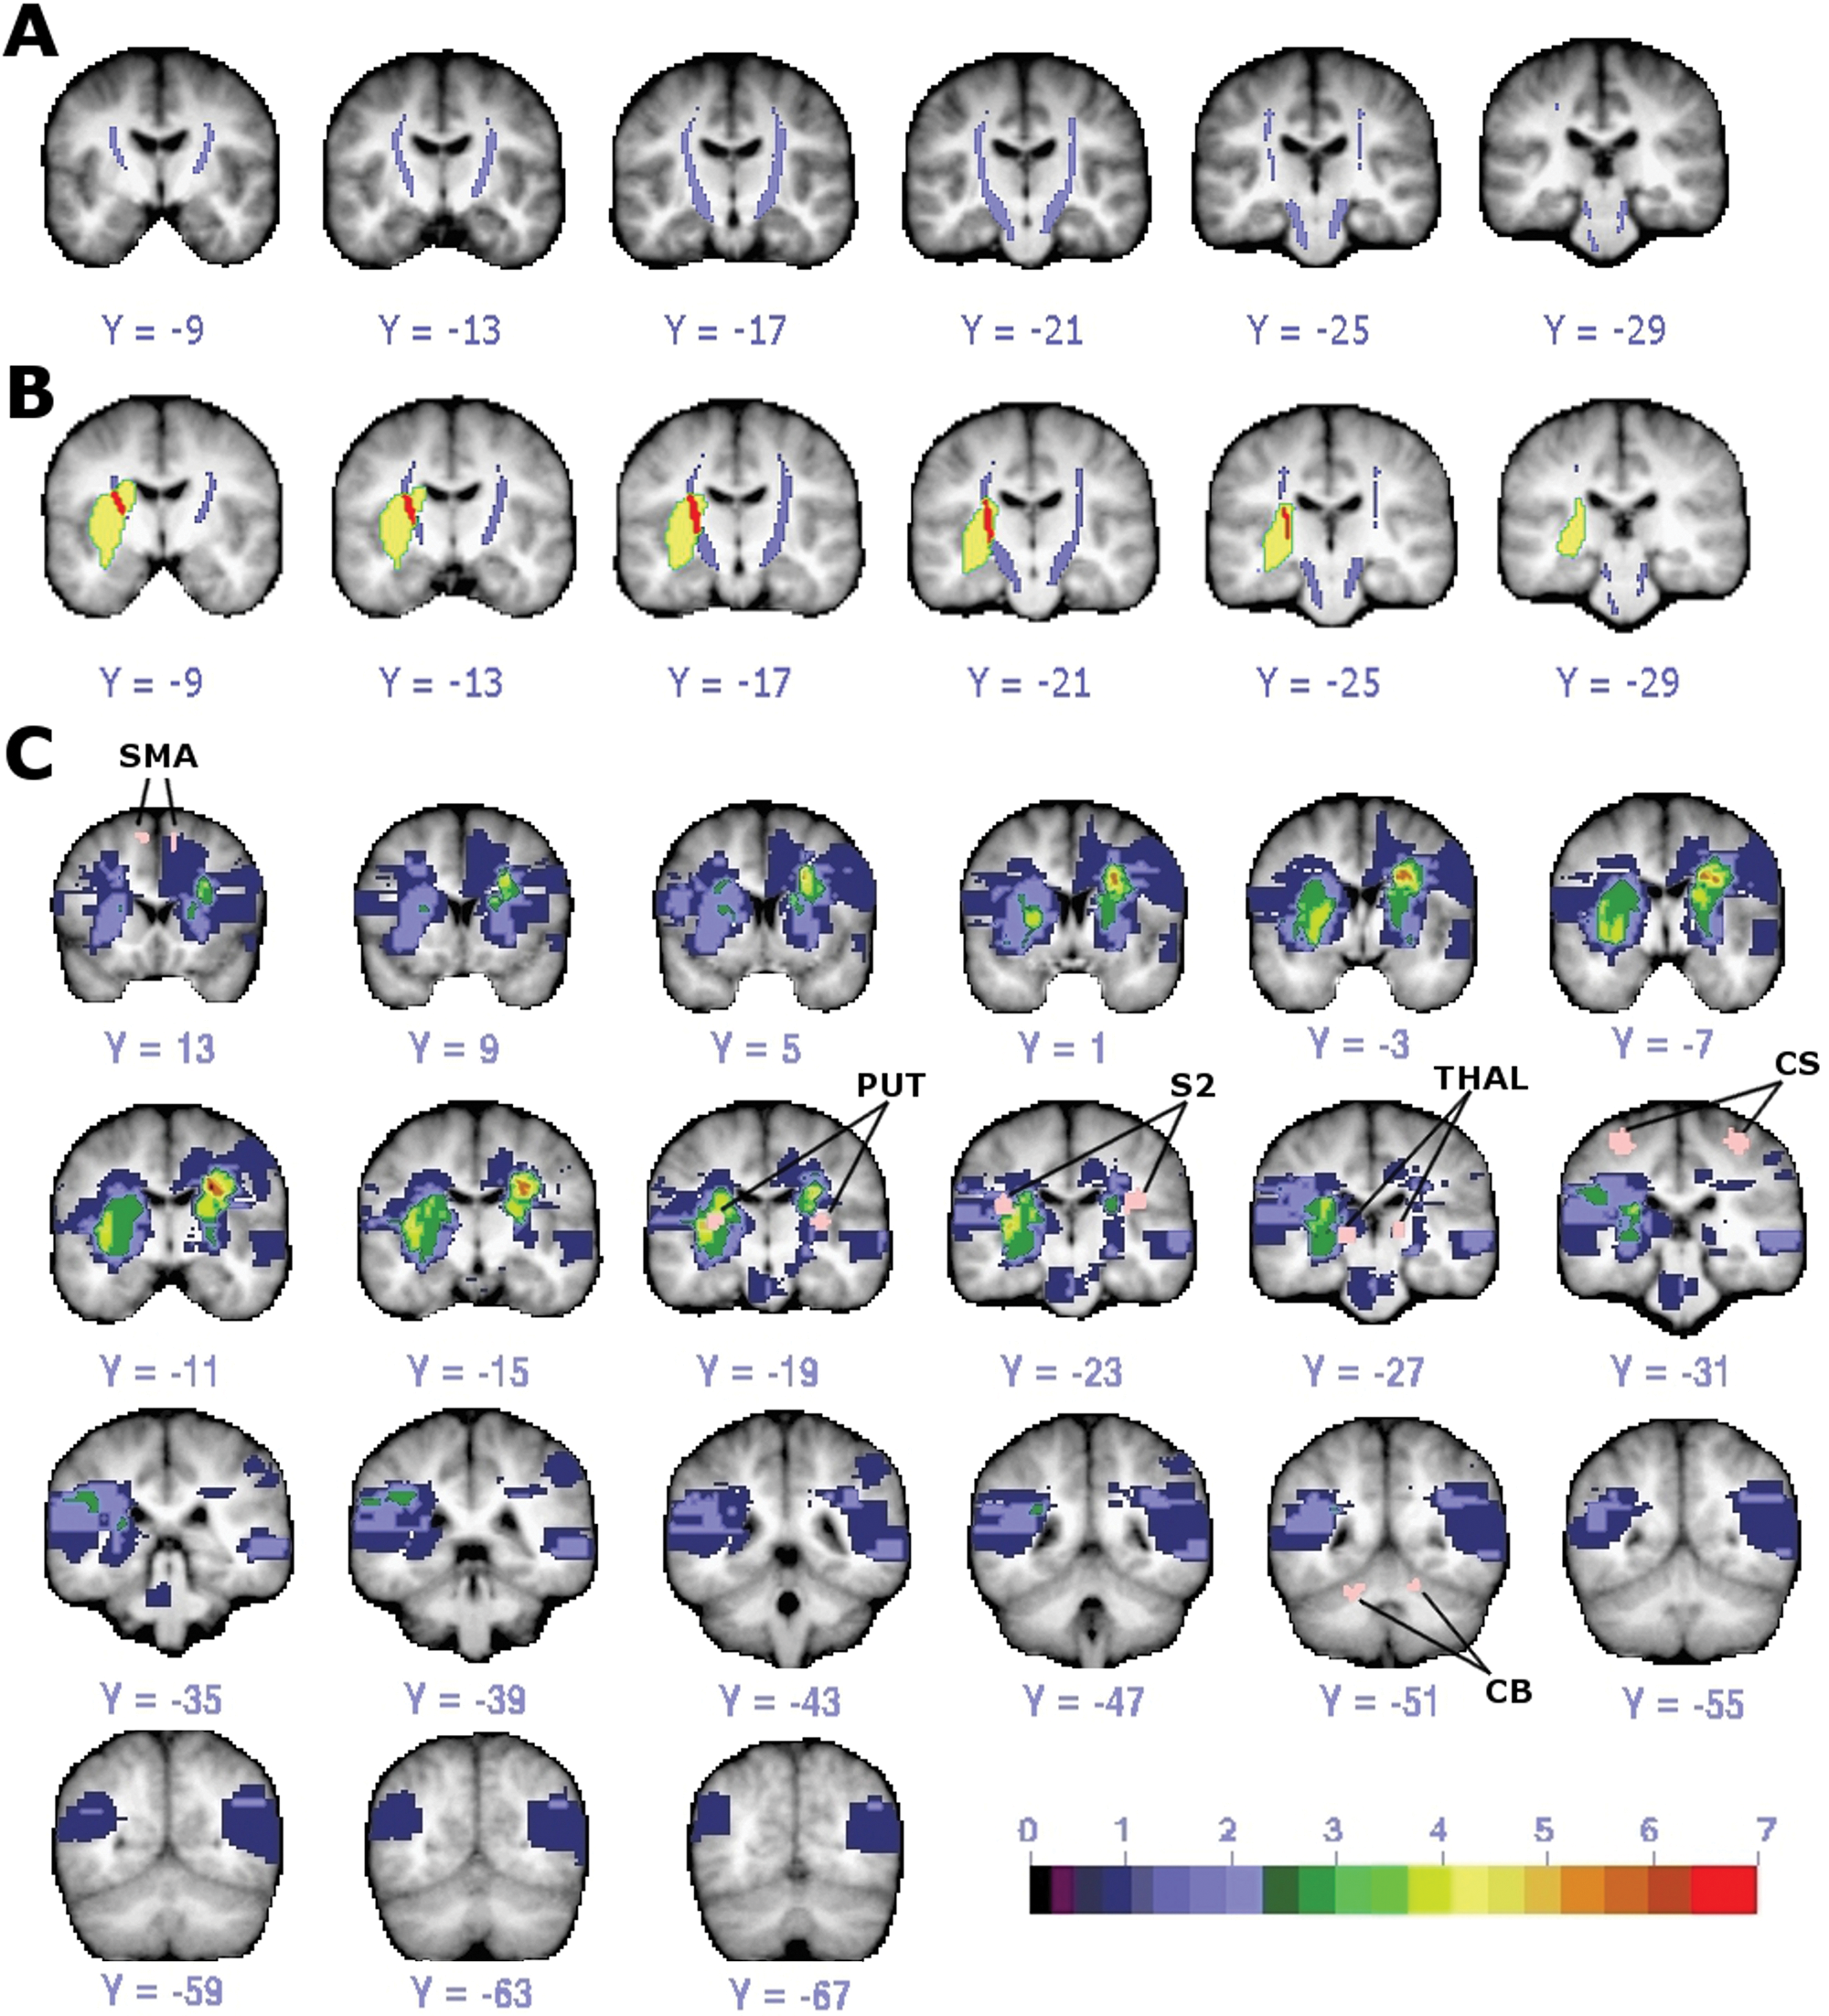
DTI template of CST and lesion distribution. A, CST template (purple) from healthy individuals with threshold of 6 of 13 subjects is shown. B, Overlap (red) of CST template (purple) and lesion (yellow) in one stroke subject. C, Lesion distribution in 22 stroke patients with regions of interest used as seeds in functional connectivity analysis colored in pink and labeled. Color scale indicates number of subjects with lesion at that voxel. (Small areas of diffusion restriction could not be quantified in one subject.) Abbreviations: DTI, diffusion tensor imaging; CST, corticospinal tract; CS, central sulcus; SMA, supplementary motor area; PUT, putamen; THAL, thalamus; S2, secondary somatosensory area; CB, cerebellum.
Amount of CST damage was defined as the percentage of the total CST template volume that overlapped each stroke patient’s lesion (% CST damage, Figure 1B), which were mainly subcortical (see Supplementary Table 1 for stroke subject characteristics; Figure 1C). Mean CST damage was 16.02% (SD = ±3.42). No subject had evidence of old CST lacunes.
Effect of Corticospinal Tract Damage on Resting Connectivity
CST damage was significantly correlated with interhemispheric connectivity (Pearson r = −0.592, P = .004; Figure 2, left panel) and ipsilesional intrahemispheric connectivity (Pearson r = −0.537, P = .01; Figure 2, middle panel) but not with contralesional intrahemispheric connectivity (Pearson r = 0.056, P = .8; Figure 2, right panel). However, % CST damage was significantly correlated with lesion volume (Pearson r = 0.659, P < .001). Following a partial correlation analysis to control for the effect of lesion size, CST damage was still significantly correlated with interhemispheric connectivity (partial r = −0.433, P = .05) but not with ipsilesional intrahemispheric connectivity or contralesional intrahemispheric connectivity (partial r = −0.252, P = .27 and partial r = −0.033, P = .89, respectively).
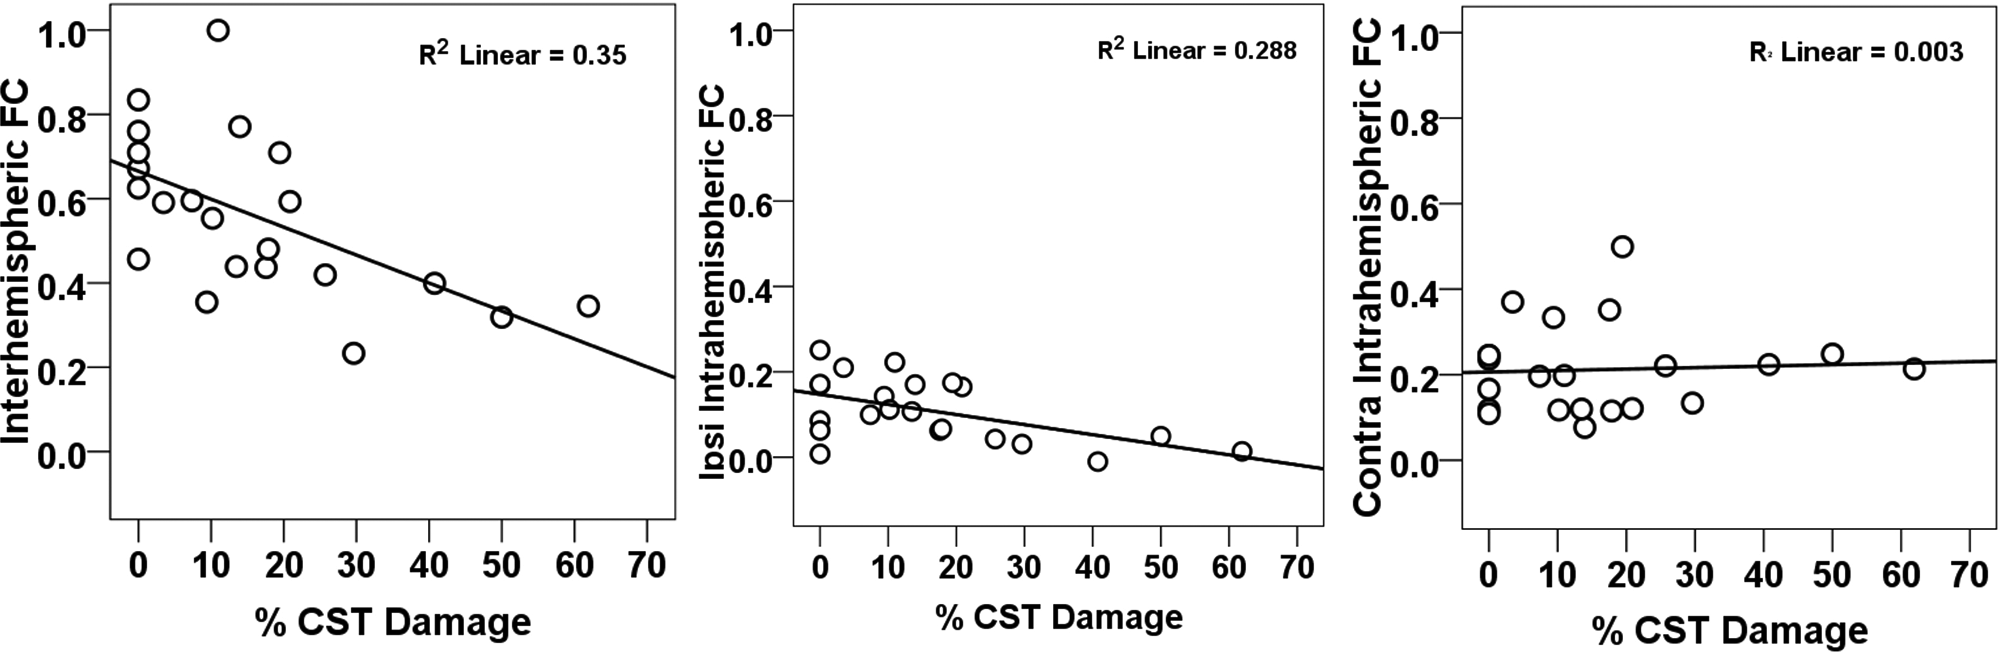
Scatterplots of resting FC as a function of percentage CST damage. Abbreviations: FC, functional connectivity; CST, corticospinal tract; Ipsi, ipsilesional; contra, contralesional; % CST, % corticospinal tract damage.
Correlations between % CST damage and interhemispheric connectivity were also investigated for 6 homotopic ROI pairs in our somatomotor network (CS, S2, SMA, Put, Thal, and CB). Three subjects with more than 50% damage to any motor ROI were excluded. Percentage CST damage was significantly correlated with changes in rsFC between left and right CS containing primary motor cortex (Pearson r = −0.623, P = .004). This relationship was not caused by structural damage as the lesion distribution did not overlap with the CS. 16 No significant correlation was observed between % CST damage and interhemispheric rsFC for the other ROIs or between % CST damage and connectivity between the ipsilesional CS and other ipsilesional somatomotor ROIs.
Contributions of Resting State Functional Connectivity and Corticospinal Tract Damage to Motor Impairment
We found a strong correlation between motor impairment and % CST damage but not stroke lesion size (Figure 3). Because % CST damage influences the strength of interhemispheric rsFC (see previous section), it is important to disentangle the relative importance of % CST damage and interhemispheric connectivity on motor behavior and determine whether they have independent effects or interact with each other. We first performed a multiple linear regression to examine the main effects of % CST damage and rsFC on motor behavior. For 5 of the 7 behaviors tested, % CST damage accounted for a significant percentage of the variance in motor performance (Figure 4). Interhemispheric rsFC did not account for a significant amount of variance in this model. A second analysis that added stroke lesion size and intrahemispheric rsFC to the linear regression model resulted in significant regression coefficients for % CST damage in all motor tests. No other factor was significant except for grip strength, where stroke lesion size, F (1, 10) = 6.6, P = .028, explained 18.2% of the variance in performance (see Supplementary Table 2). Overall, the results were similar to our original analysis and did not result in a change in interpretation.
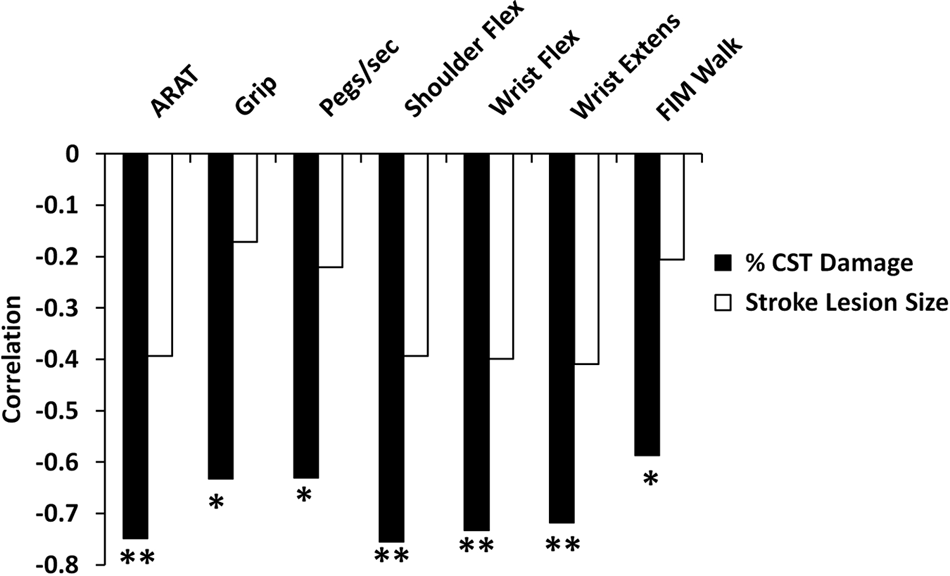
Correlation of percentage CST damage with measures of motor function. Abbreviations: CST, corticospinal tract; ARAT, Action Research Arm Test; Flex, flexion; Extens, extension; FIM, Functional Independence Measure. *P < .05; **P < .01.
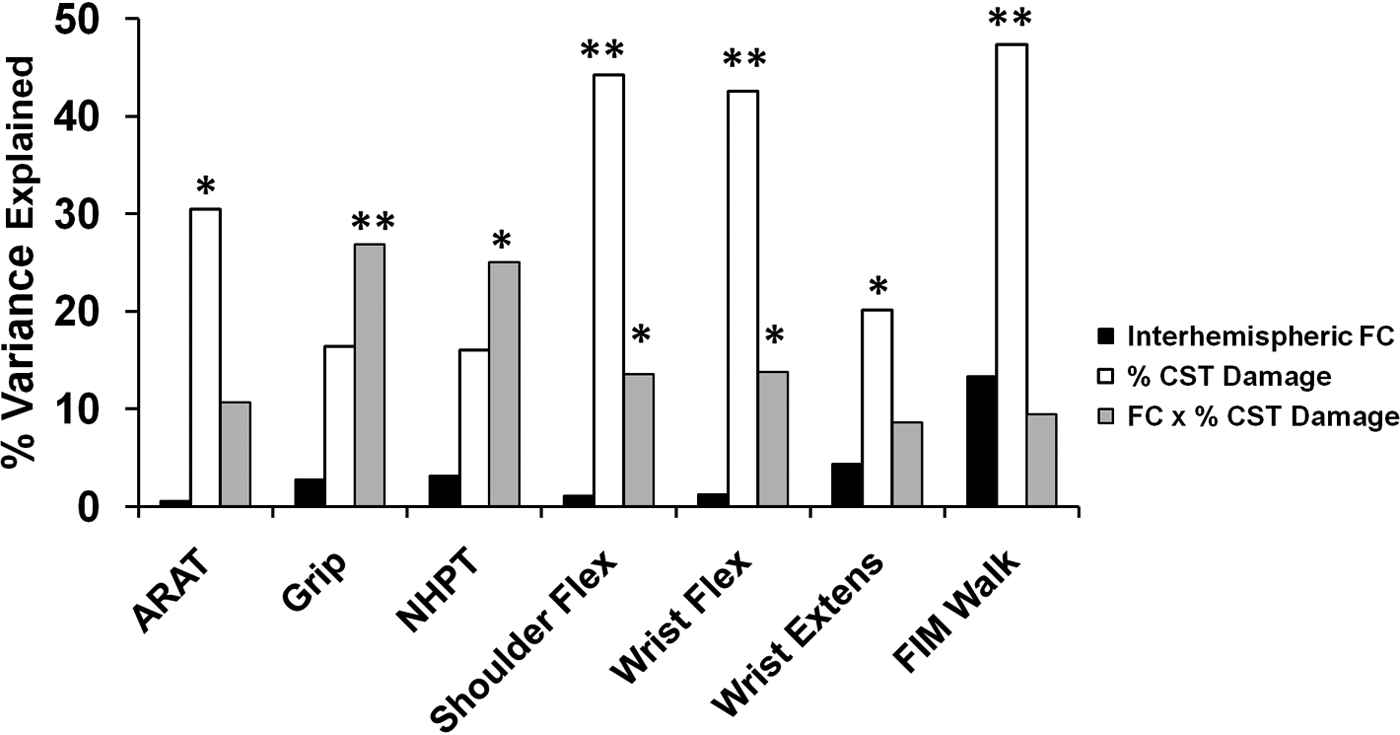
Linear regression analysis to determine the percentage variance in performance accounted for by amount of CST damage, interhemispheric fcMRI, and the CST damage × interhemispheric rsFC interaction. Abbreviations: CST, corticospinal tract; ARAT, Action Research Arm Test; Flex, flexion; Extens, extension; FIM = Functional Independence Measure; rsFC = resting state functional connectivity; MRI, magnetic resonance imaging. *P < .05; **P < .01.
The lack of relationship between interhemispheric rsFC and behavior in the above analyses may seem inconsistent with our previous report of a correlation between interhemispheric connectivity and behavior. However, effects of interhemispheric rsFC may depend on the amount of CST damage. Specifically, substantial CST damage may reduce or eliminate the relationship between interhemispheric connectivity and behavior. To investigate this possibility, a separate linear regression model was computed with the factors interhemispheric rsFC, % CST damage, and interhemispheric rsFC × % CST damage. Because our initial analyses showed no correlation between stroke lesion size and motor performance (Figure 3) stroke lesion size was not included in this model. We found that the interaction term accounted for a significant portion of the variance in performance for grip strength (% variance = 26.82, P = .01), NHPT (% variance = 25.03, P = .014), shoulder flexion (% variance = 13.58, P = .042), wrist flexion (% variance = 13.77, P = .05), a marginal portion of the variance for the ARAT (% variance = 10.65, P = .084), and no significant portion for wrist extension or the FIM Walk (Figure 4; Supplementary Table 3).
The nature of this interaction is qualitatively illustrated in Figures 5A and 5B, which show the relationship between motor performance and CST damage (5A) or rsFC (5B). Motor performance drops off quickly with increasing CST damage (red and white circles, Figure 5A), reaching a floor with high levels of CST damage (black circles, 5A). Correspondingly, motor performance increases with increasing rsFC for patients with low CST damage (red and white circles, Figure 5B) but remains impaired for patients with high CST damage even as rsFC increases (black circles, Figure 5B). The 5 subjects who had the greatest % CST damage showed poor performance across all motor tasks regardless of varying levels of interhemispheric rsFC (Figure 5B). These results suggest that when CST damage is low, motor function is correlated with interhemispheric rsFC but that when CST damage exceeds a certain level, rsFC no longer affects the degree of impairment, although interhemispheric rsFC continues to deteriorate as % CST damage increases (Figure 5C and D).
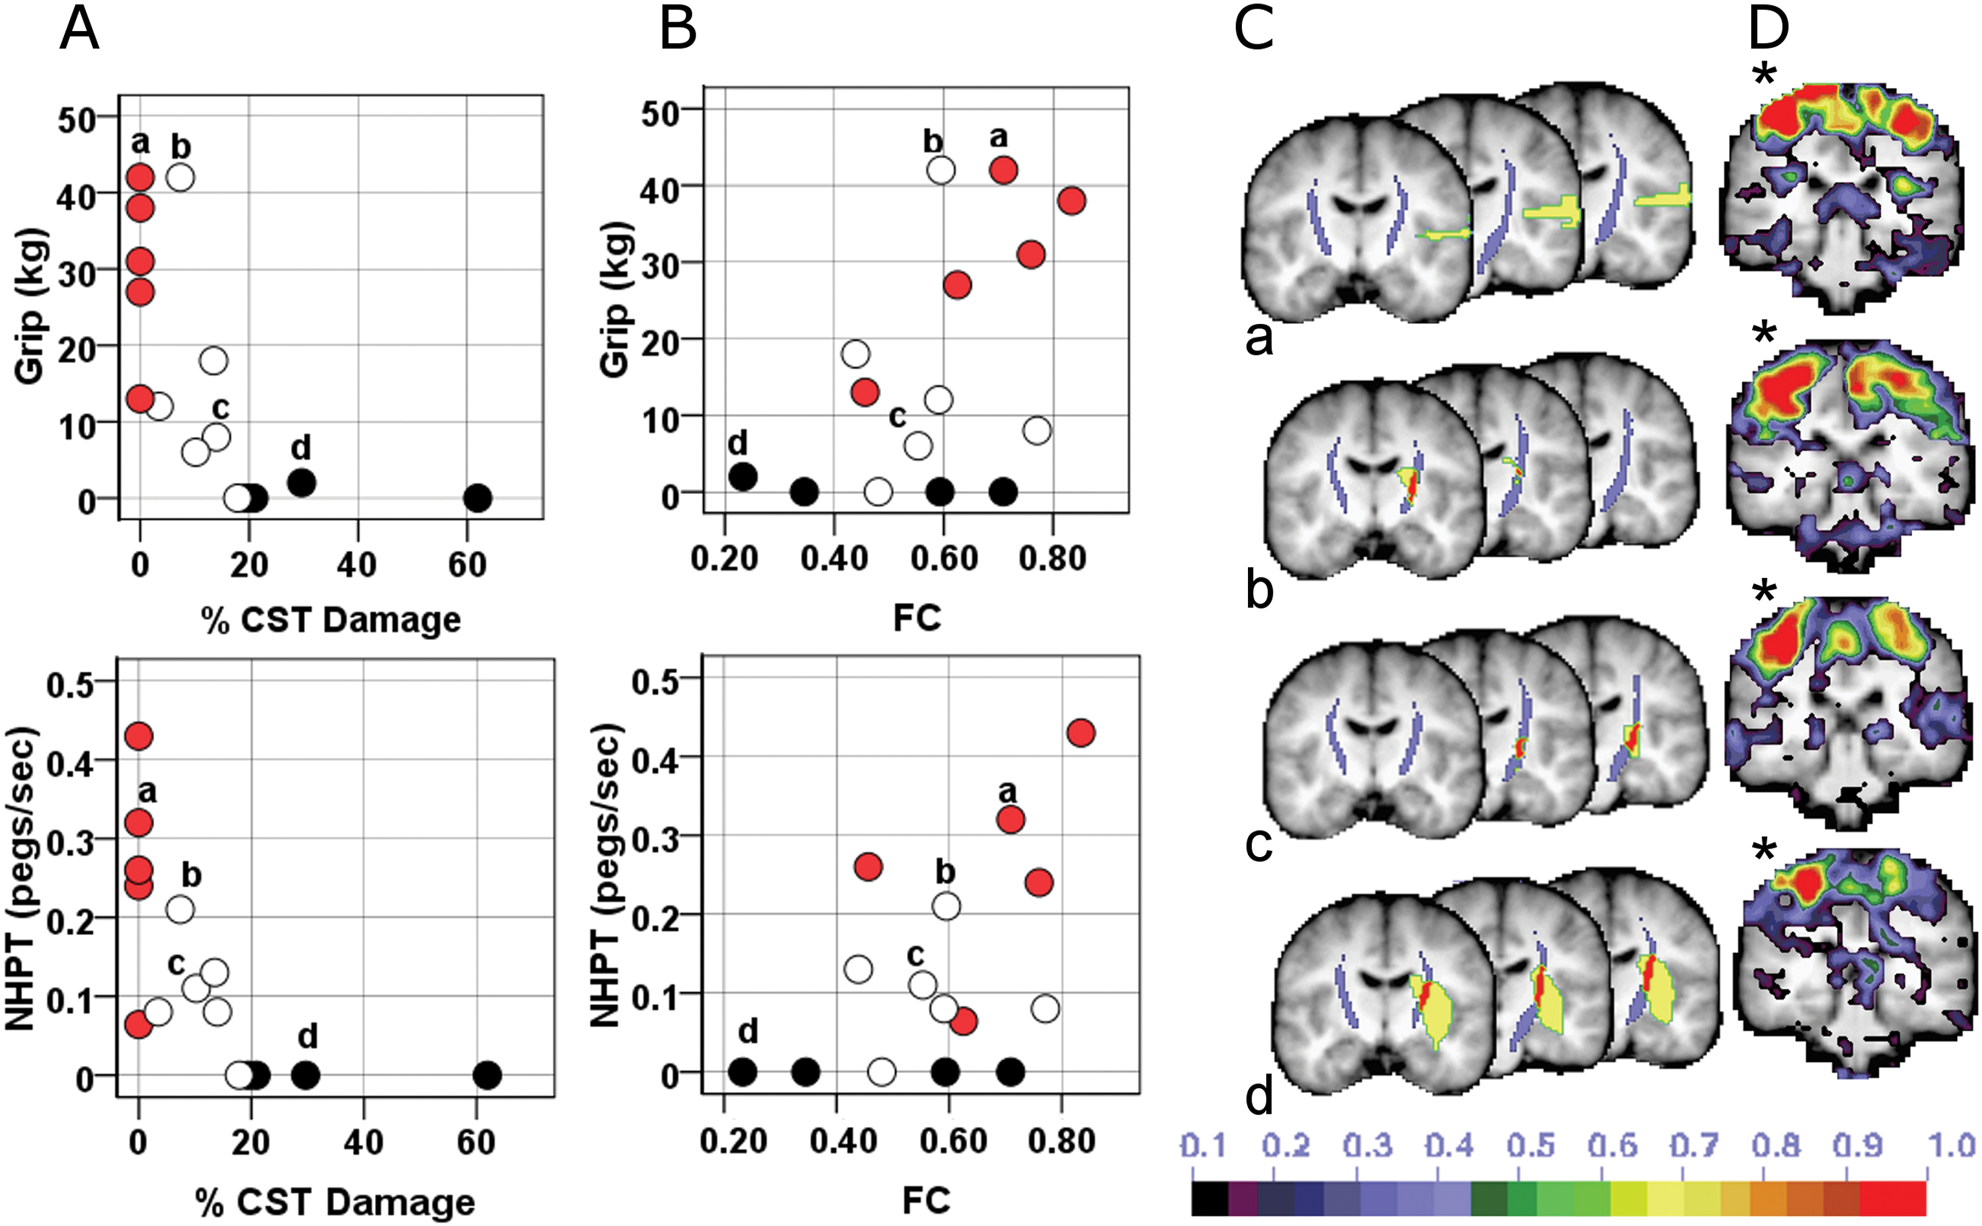
Dual contribution of CST damage and impaired interhemispheric rsFC to motor impairment. A, Scatterplots relating motor performace and % CST damage. B, Scatterplots relating motor performance and rsFC. Blackened circles = 75th percentile for CST damage; white circles = 25th to 74th percentile; red circles = no CST damage. C, Intersection (red) of CST template (purple) with stroke lesion (yellow) for 4 individuals labeled a, b, c, and d. D, Seed-based functional connectivity map for the same 4 individuals when seeding the contralesional undamaged central sulcus (*). Abbreviations: NHPT, nine-hole peg test; FC, functional connectivity; CS, central sulcus; % CST, % corticospinal tract damaged.
This conclusion was supported by a 2-way ANOVA in which median values for interhemispheric rsFC (0.594) and % CST damage (10.188) served as cut-offs for defining low and high levels of the rsFC and % CST damage factors. A significant main effect of % CST damage was observed in 6 of 7 tasks. A significant main effect of interhemispheric rsFC and a significant rsFC × % CST damage interaction, F (1, 10) = 8.53, P = .015, was detected for grip strength (see Supplementary Table 4 for details). Grip Strength was not dependent on interhemispheric rsFC when CST damage was severe but was dependent on interhemispheric rsFC when CST damage was mild (see Supplementary Figure 1). Scatterplots of the behavioral–rsFC relationship for subjects belonging to the 2 levels of % CST damage (Figure 6) were consistent with the above conclusion.
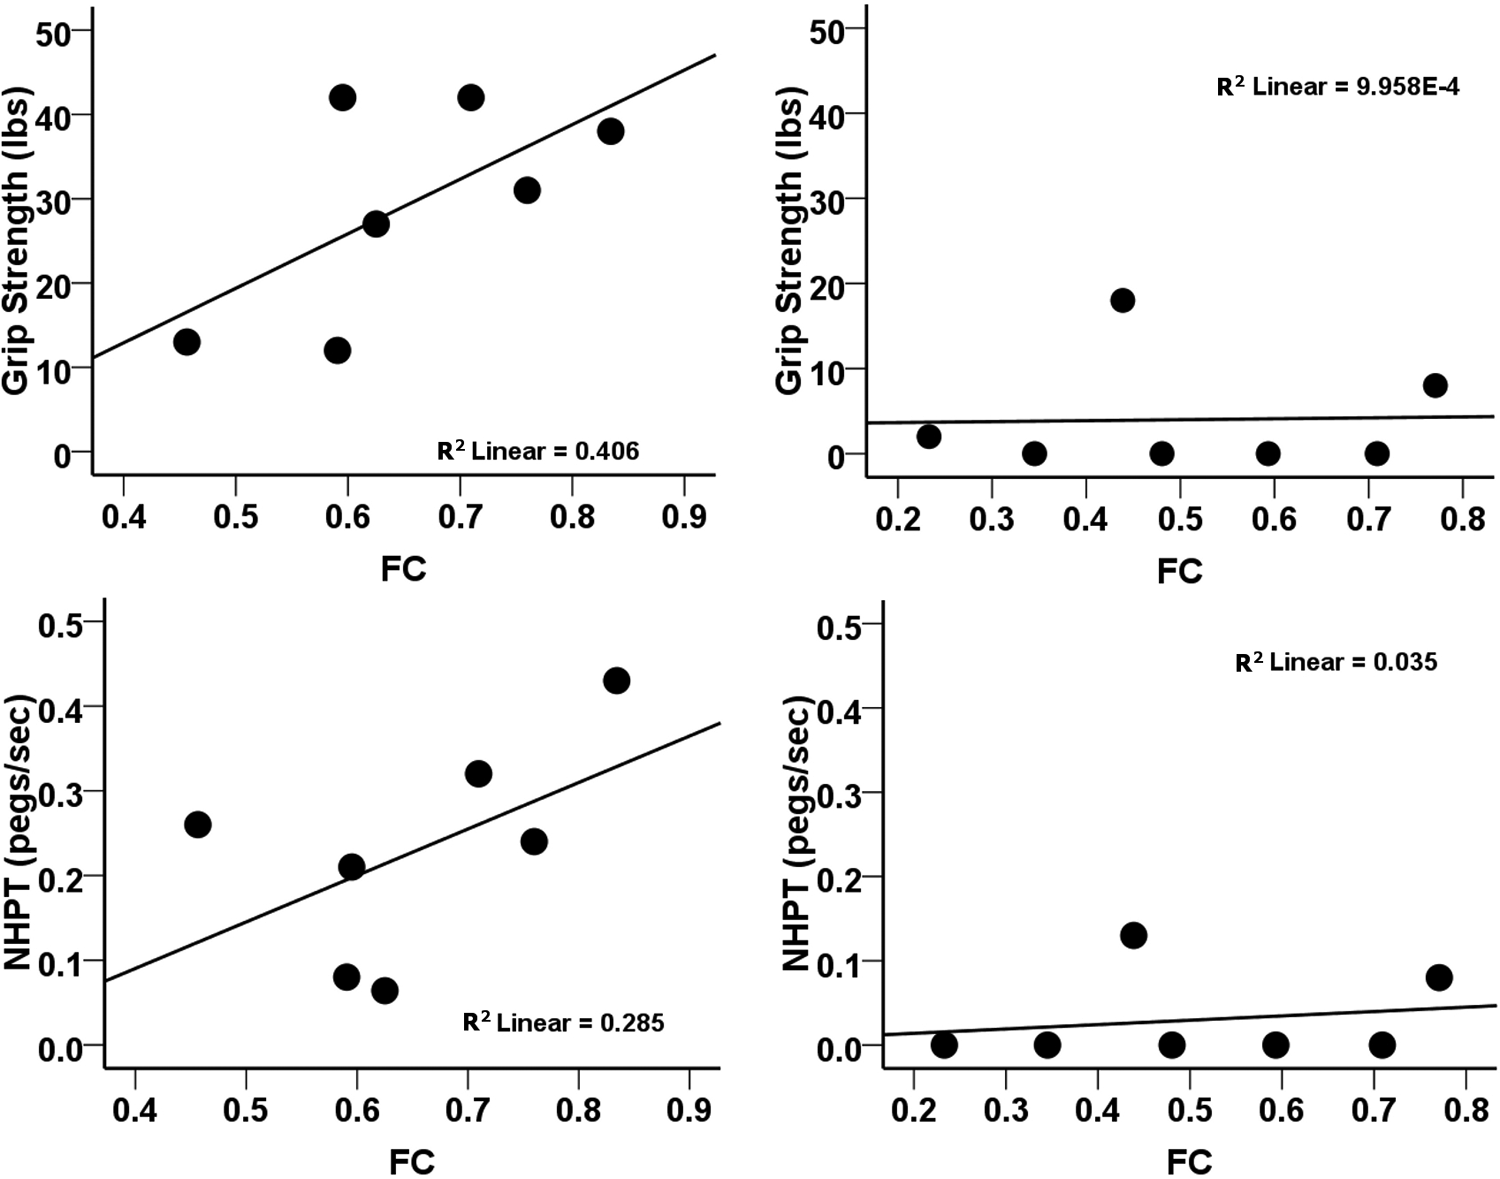
Effect of impaired interhemispheric rsFC on motor impairment depends on the extent of CST damage. A, Scatterplots relating motor performance and interhemispheric rsFC in subgroup of subjects with % CST damage below the median for the distribution of % CST values. B, Scatterplots relating motor performance and interhemispheric rsFC in subgroup of subjects with % CST damage above the median for the distribution of % CST values. Abbreviations: CST, corticospinal tract; NHPT, nine-hole peg test; rsFC, interhemispheric resting state functional connectivity.
Discussion
Our results show that structural damage to the CST, as determined by a template derived from DTI in healthy controls, was associated with decreased somatomotor interhemispheric rsFC. These rsFC changes reflect a physiological impairment of spontaneous activity coherence upstream from the site of damage. Second, rsFC was significantly related to motor performance only when CST damage was less than about 10% of the total volume of the CST template. Hence poststroke motor deficits reflect a complex interaction of structural and functional impairments in brain motor networks.
Upstream Functional Consequences of Corticospinal Tract Damage
The correlation between decreased interhemispheric rsFC and increasing CST damage was strongest for rsFC between left and right sensory-motor cortex. It was not dependent on overall stroke volume or interruption of fibers to/from primary sensory-motor cortex within the damaged hemisphere, since no correlation was observed between CST damage and rsFC between ROIs within the damaged hemisphere. Damage to transcallosal motor fibers also cannot explain the effect, as the lesion distribution in our sample was located more anterior, inferior, and medial.47,48
Time Course of Retrograde Changes After Corticospinal Tract Damage
Our results suggest that disruption of rsFC is a remote upstream effect of CST damage on cortical structures. Wallerian degeneration in the pyramidal tract after stroke has been reported within 2 weeks with DTI.49-52 The extent and time course of retrograde degeneration in the proximal portion of the CST are less well understood. Animal evidence exists for early retrograde changes in pyramidal layer V. 53 Longitudinal DTI studies of retrograde pyramidal degeneration after spinal cord, 54 pontine, 55 or subcortical lesions 56 all show a similar pattern with degeneration in the CST slowly marching more rostrally. However, there is no conclusive evidence of changes in fractional anisotropy in the centrum semiovale or corona radiata before 1 month after CST damage. Therefore, it seems unlikely that extensive retrograde degeneration can explain the changes in network functional connectivity observed in our subacute stroke population.
Functional Network Reorganization After Infarct
Corticospinal tract damage can lead to functional changes in cortical responses, including increased movement-related BOLD activations57,58 and recruitment of supplementary motor areas as well as ipsilesional and contralesional M1/S1 regions. 59 These results are consistent with prior studies showing recruitment of secondary motor and contralesional areas, as well as larger activations in these same areas in patients with more severe strokes and greater disruption of CST integrity.60-62 CST damage can also affect spontaneous cortical activity, consistent with the present results. In a recent longitudinal study of subcortical stroke, Wang et al 63 reported that motor cortical reorganization and recovery are associated with a loss of regional node importance, decreased interhemispheric rsFC between subcortical ROIs and increased interhemispheric rsFC between cortical ROIs. In recent animal experiments, van Meer et al 17 found a significant correlation of rsFC between left and right primary motor cortex with motor behavior in rats with subcortical lesions.
Behavioral Relevance of Connectivity Varies With Context
Network-specific coherent spontaneous BOLD fluctuations explain a significant portion of the variability in BOLD responses, 64 reaction times, and button press force 65 and are correlated with hemispatial neglect 14 and with motor function. 16 Here we show that the behavioral significance of rsFC varies with the degree of CST damage. For CST damage equal to or less than approximately 10% we found a significant correlation between motor impairment and functional connectivity. However, when CST damage is greater, motor deficits are driven primarily by the CST damage although cortical functional connectivity may be quite abnormal as well.
In our linear regression analysis, the rsFC × % CST damage interaction was significant in 4 of the 7 behavioral tests and was marginal in another. The interaction was significant in the 2-way ANOVA for only 1 test, but the ANOVA has reduced sensitivity relative to the regression analyses since it requires that continuous independent variables be categorized. Bebee and Lang 66 showed that 6 standardized tests of upper extremity function were highly correlated with each other and loaded onto a single factor. However, testing whether different motor tests focus on separate dimensions of motor performance or rely on brain regions with different contributions to the CST was beyond the scope of the present study.
Corticospinal Tract Damage and Motor Recovery
Very recently, Zhu et al 26 reported that CST lesion load was highly correlated with upper extremity Fugl-Meyer scores. Our findings are consistent with the results of these and other previous studies demonstrating a robust association between CST damage assessed by DTI and motor impairment in stroke.25,67-74 However, Sterr et al 27 recently reported that even subjects with severe CST damage showed behavioral gains after constraint-induced movement therapy. Other measures such as the presence of motor-evoked potentials elicited by transcranial magnetic stimulation may provide additional useful information about the state of the motor network25,75 and its potential for further recovery. Our results, which show that interhemispheric rsFC is disrupted after CST damage, suggest that both the focal lesion and its remote effects on network function are relevant to understanding recovery after stroke.
Footnotes
Acknowledgements
We thank Adrian Epstein for his guidance with regard to the analysis of the diffusion tensor imaging data.
ARC performed the analysis of most of the BOLD functional connectivity analysis and stroke lesion segmentation analysis, imaging–behavior correlations, and statistical analysis, assisted in the recruitment and scanning of subjects, and wrote the article. KP performed most of the DTI analysis, developed the corticospinal tract template, and performed imaging–behavior correlations. SVA assisted in the scanning of subjects, image analysis, ROI creation, and encoding of behavioral data, and developed the composite functional connectivity scores. AZS developed a new target atlas required for the DTI analysis and assisted KP in the DTI analysis. JR recruited and obtained consent from patients, assisted in the scanning, administered the behavioral battery, and analyzed the behavioral data. MJS instructed the authors in statistical methods. JSS assisted in the acquisition and analysis of DTI data. CEL contributed to the experimental design and development of an appropriate battery for testing motor behavior. AP assisted in scanning, behavioral testing, and image processing. GLS and MC designed the study, oversaw data acquisition and analysis, and were principal editors of the article. All authors discussed the results and/or commented on the article.
The author(s) declared no potential conflicts of interest with respect to the research, authorship, and/or publication of this article.
The author(s) disclosed receipt of the following financial support for the research and/or authorship of this article: This study was supported by the National Institute of Mental Health (5R01HD061117-07 to MC; 5K08NS064365-02 to ARC], the Robert Wood Johnson Foundation Amos Medical Faculty Development Program (65592 to ARC), and the Rehabilitation Institute of St Louis.
References
Supplementary Material
Please find the following supplemental material available below.
For Open Access articles published under a Creative Commons License, all supplemental material carries the same license as the article it is associated with.
For non-Open Access articles published, all supplemental material carries a non-exclusive license, and permission requests for re-use of supplemental material or any part of supplemental material shall be sent directly to the copyright owner as specified in the copyright notice associated with the article.