
Abstract
Objective. Structural connectivity analysis based on graph theory and diffusion tensor imaging tractography is a novel method that quantifies the topological characteristics in the brain network. This study aimed to examine structural connectivity changes following the Attention Intervention and Management (AIM) program designed to improve attention and executive function (EF) in children with traumatic brain injury (TBI). Methods. Seventeen children with complicated mild to severe TBI (13.66 ± 2.68 years; >12 months postinjury) completed magnetic resonance imaging (MRI) and neurobehavioral measures at time 1, 10 of whom completed AIM and assessment at time 2. Eleven matched healthy comparison (HC) children (13.37 ± 2.08 years) completed MRI and neurobehavioral assessment at both time points, but did not complete AIM. Network characteristics were analyzed to quantify the structural connectivity before and after the intervention. Results. Mixed model analyses showed that small-worldness was significantly higher in the TBI group than the HC group at time 1, and both small-worldness and normalized clustering coefficient decreased significantly at time 2 in the TBI group whereas the HC group remained relatively unchanged. Reductions in mean local efficiency were significantly correlated with improvements in verbal inhibition and both parent- and child-reported EF. Increased normalized characteristic path length was significantly correlated with improved sustained attention. Conclusion. The results provide preliminary evidence suggesting that graph theoretical analysis may be a sensitive tool in pediatric TBI for detecting (a) abnormalities of structural connectivity in brain network and (b) structural neuroplasticity associated with neurobehavioral improvement following a short-term intervention for attention and EF.
Keywords
Introduction
Children with traumatic brain injury (TBI) often sustain long-term neurobehavioral impairments in attention, memory, and executive functions (EF),1,2 which have been shown to contribute to poor school performance and academic achievement.3,4 Evidence from human and animal neuropathological studies has shown that diffuse axonal injury in white matter (WM) underpins these persistent postinjury neurobehavioral impairments.5-9
Diffusion tensor imaging (DTI), an advanced noninvasive magnetic resonance imaging (MRI) technique, is highly sensitive to microstructural damage in WM pathways.10,11 A growing literature with humans and animals highlights the utility of DTI in differentiating WM damage and predicting post-TBI outcomes.7,12-17 However, disagreement remains regarding the location of affected WM structures, the magnitude of longitudinal changes in WM over the course of recovery, and responsiveness of WM structure to rehabilitation treatment.18,19 The diffuse and extensive nature of damage to WM structures in TBI makes it difficult to attribute neurobehavioral changes to specific regional WM tracts. It is believed that the functioning of complex and distributed brain networks, such as the executive function, working memory, and attention networks, involve many cortical and subcortical regions.20-23 Thus, a new approach that allows for quantifying the structural connectivity in the entire brain network is needed to optimally characterize associations between WM neuropathology and neurobehavioral outcomes.
Quantification of network structural connectivity based on graph theory and DTI tractography has emerged as a promising tool that allows for the characterization of brain connectivity as a complex network.24,25 This approach quantifies the structure of WM connecting the spatially segregated but functionally associated brain regions in the brain network. Using this method, the brain is modeled as a network composed of a number of nodes and edges. The nodes and edges, respectively, represent individual brain regions responsible for various functions and WM fibers connecting these regions. Given the diffuse and widely distributed nature of WM damage following TBI, graph theory analysis may provide a logical tool for elucidating the underlying neural mechanism of brain injury and for quantifying and monitoring neurorehabilitation of network connectivity in children after TBI. This approach has been adopted in a few recent studies26-29 that found altered structural connectivity measures derived from the topological characteristics of brain networks following TBI in both adults and children during acute or chronic stages of recovery. Significant correlations between connectivity and neurobehavioral outcomes were also documented in some of the studies.26,28 However, these studies were all cross-sectional with data collected at a single time point. To our knowledge, no study has examined longitudinal changes in structural connectivity based on graph theory analysis in response to rehabilitation treatment in children with TBI long after their initial injury.
In the present study, we report a longitudinal study that employs graph theory and DTI tractography to investigate the structural connectivity in children with TBI who were at least 1 year after injury, before and after the Attention Improvement and Management (AIM) program, a newly developed cognitive intervention designed to improve postinjury impairments in attention and EF. 30 We hypothesized that the AIM intervention would result in changes in structural connectivity of WM networks and corresponding improvements in neurobehavioral outcomes posttreatment. The specific aims included the following: (a) quantifying abnormalities in structural connectivity in children with TBI relative to a healthy comparison (HC) group at time 1; (b) quantifying changes in structural connectivity in children with TBI after the AIM intervention, and (c) exploring the association between changes in structural connectivity and changes in attention and EF outcomes in response to the AIM intervention.
Materials and Methods
Participants
Children were recruited from the Trauma Registry of a large children’s hospital. The study was approved by the institutional review board and parental informed consent and child assent were obtained. Twenty-two children (9-18 years) with complicated mild to severe TBI (Glasgow Coma Scale [GCS] score of ≤12 or a GCS of 13-15 accompanied by abnormalities on imaging) and 11 age-matched HC children were initially recruited into the study. We enrolled participants who were at least 1 year postinjury given evidence that the rapid period of natural recovery plateaus after 12 months. 31 Additional eligibility for the TBI group included attention impairments based on the Vanderbilt ADHD Diagnostic Parent Rating Scale, Attention Subscale 32 (endorsement of at least 4 out of 9 attention items with a frequency score of 2 or 3), and convenient access to a computer. Exclusionary criteria for the HC group included a diagnosis of ADHD or attention impairments on the Vanderbilt ADHD Diagnostic Parent Rating Scale, Attention Subscale 32 (endorsement of at least 4 out of 9 attention items with a frequency score of 2 or 3). Exclusionary criteria for both groups included a diagnosis of cognitive disability or inability to operate a computer. Participants in both groups completed a brief battery of neuropsychological tests and parent- and self-report questionnaires at 2 time points. Only children in the TBI group completed the AIM program between time 1 and time 2.
Seventeen children enrolled in the TBI group (female/male 7/10; age 13.72 ± 2.77 years, range 9.17-18.88 years) and all 11 HC (female/male 8/3; age 13.37 ± 2.08 years, range 9.73-15.90 years) completed MRI and neuropsychological assessments at time 1 and were included in the present analysis (5 children in the TBI group were ineligible for imaging due to metal implants or braces and were not considered further in this report). Parental report data regarding ADHD diagnosis were available for 16 of 17 children with TBI. Among those, 9 children were diagnosed with ADHD after their injury while the remaining 7 had not been diagnosed with ADHD. Five of the 9 children with ADHD completed imaging at both time points. Ten of 17 participants with TBI completed the AIM program and time 2 imaging and outcome assessment. Six participants dropped out of the study after time 1 and one refused time 2 imaging. All 11 HC children completed MRI and neurocognitive assessments at time 2. No significant group differences (P < .05) were found in age, sex, race/ethnicity, 33 handedness, or GCS score for comparisons between (a) the 10 participants with TBI who completed the study and the 7 participants with TBI who did not complete the study, (b) the 10 participants with TBI and the 11 participants in HC group who completed the study, or (c) all 17 participants with TBI and the 11 participants in the HC group. See Table 1 for participant characteristics.
Participant Characteristics.
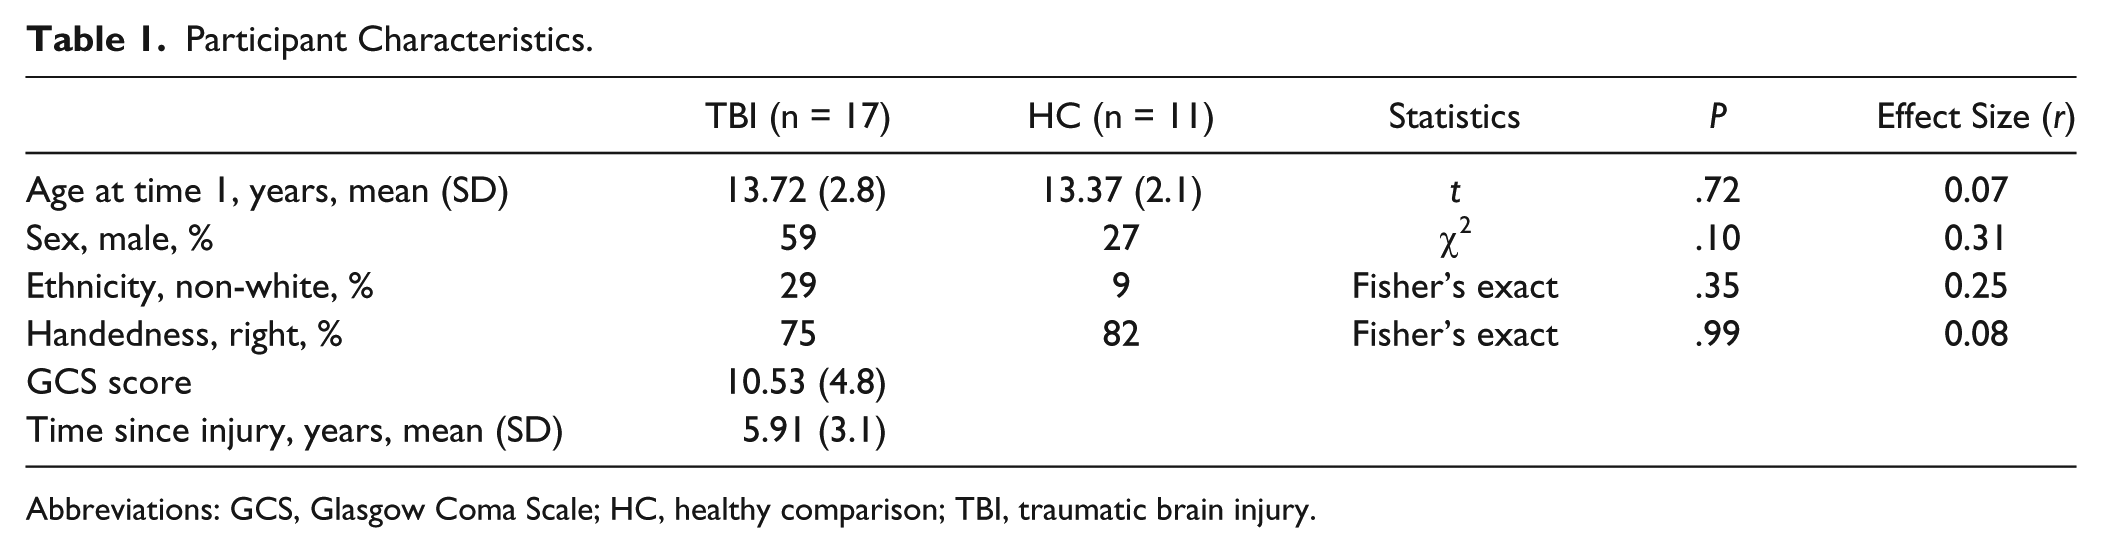
Abbreviations: GCS, Glasgow Coma Scale; HC, healthy comparison; TBI, traumatic brain injury.
The Attention Intervention and Management Program
The AIM program was designed to improve attention and EF deficits in children with TBI through a combination of computerized attention tasks and metacognitive strategy coaching. Direct attention training aims to improve underlying attention deficits through repetitive tasks targeting specific skills such as sustained attention, working memory, and shifting from one task to another.34,35 Metacognitive strategy training includes teaching self-monitoring, self-management, and goal-setting strategies to improve attention, behavior, and academic performance. 36 AIM was designed as a 10-week program administered in weekly face-to-face meetings between the child and the clinician. In addition, participants complete 2 to 4 at-home practice sessions per week consisting of attention tasks tailored to the needs of the child. Treatment dosage for participants who completed the study varied, ranging from 10 to 13 in-clinic sessions (60-90 minutes each) and 11 to 32 (21.0 ± 6.6) self-initiated home practice sessions (20-40 minutes each). Details of the AIM program and preliminary efficacy have been published elsewhere. 30 In the present study, no significant correlation was found between the change in any global network measures and the number of training session (at-home session, in-clinic session, or combined).
MRI Data Acquisition
MR images were acquired using a 3 Tesla Phillips Achieva MRI scanner (Philips Medical Systems, Best, the Netherlands). DTI was acquired with a single-shot echo planar sequence with following specifications: repetition time = 9000 ms; echo time = 84 ms; field of view = 256 mm × 256 mm; acquisition matrix = 128 × 128; in-plane resolution = 2 mm × 2 mm; number of slices = 76; slice thickness = 2 mm; 61 noncolinear diffusion-weighted directions (b = 1000 s/mm2); one volume of images with no diffusion sensitization; SENSE factor = 2. Whole brain 3-dimensional T1-weighted anatomical images were acquired with 1 mm isotropic resolution for registration.
MRI Data Preprocessing
DTI data were preprocessed in Functional MRI of The Brain’s (FMRIB, Oxford, UK) Diffusion Toolbox in the FSL software (the FMRIB Software Library). Head motion and artifact induced from eddy current were corrected with an affine transformation. The high-resolution T1-weighted images were downsampled to 2-mm isotropic in resolution, registered to b0, and then registered to the 2-mm isotropic T1 brain template in MNI space (Montreal Neurological Institute 152). The Automated Anatomical Labeling Atlas (AAL atlas) was used to parcellate the brain structures into 116 regions in MNI space. The inverse transformation between the downsampled T1 in DTI native space and the 2-mm iso-T1 brain template in MNI space was calculated and used to transform the parcellated regions of interest (ROI) from the MNI space back to participants’ DTI native space (to b0). In participants’ DTI native space, diffusion tensor reconstruction and whole brain fiber tracking were performed using Diffusion Toolkit/TrackVis. 37 Figure 1 shows the results of whole brain fiber tracking in a participant from the TBI group. The regions of interest (ROIs) that were based on the AAL atlas and then inversely warped back to participants’ DTI native space were used as masks to guide the counting of WM streamlines. Diffusion tensor calculation was based on a linear least-square fitting algorithm. 37 Tractography was performed based on a deterministic tracking algorithm selected for its simplicity in modeling and interpretation. An angular threshold of 70° was used in order to exclude high curvature streamlines. It should be noted that, prior to the performing of structural connectivity analysis, conventional DTI analysis approaches, for example, ROI- and voxel-based analyses, were used to analyze the DTI indices (fractional anisotropy, mean diffusivity, axial diffusivity, radial diffusivity). No significant cross-sectional or longitudinal difference was found. The negative findings based on the conventional analyses are not reported in the present study.
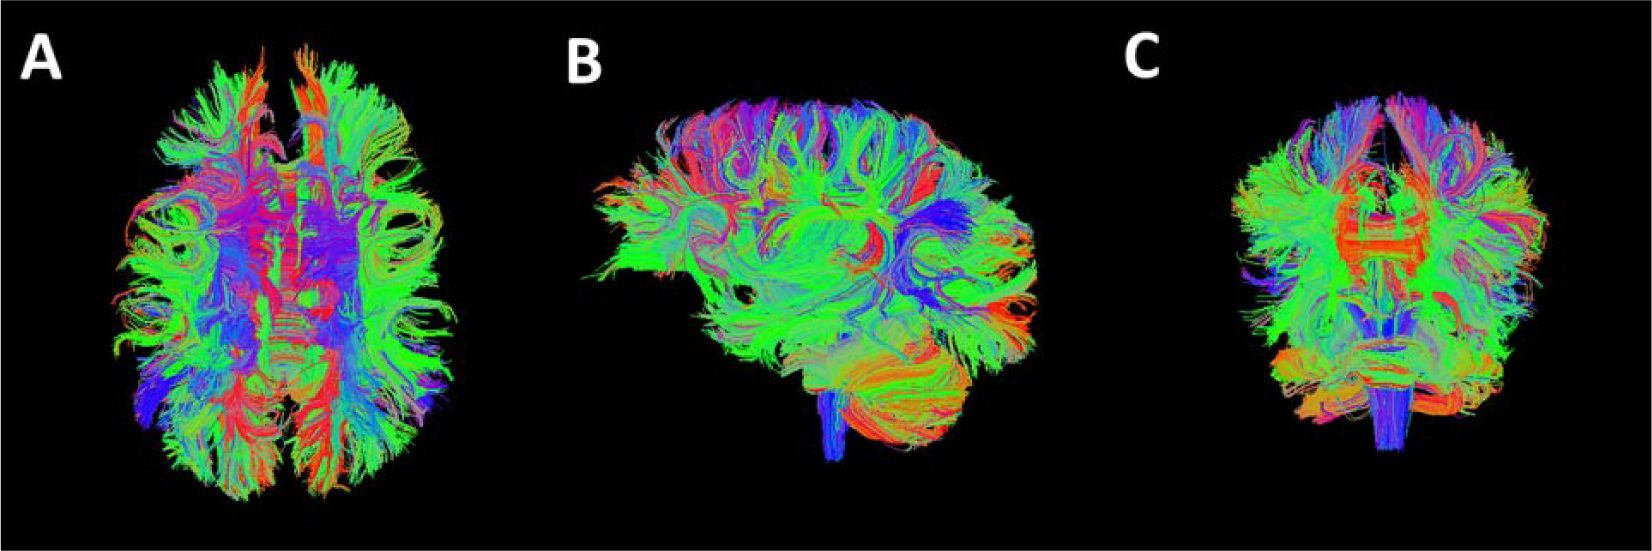
Whole brain diffusion tensor imaging (DTI) tractography result from a representative participant in the traumatic brain injury (TBI) group. The tractography result quantifies whether 2 brain regions are connected, which is used in the construction of connectivity matrix and the graph theoretical analysis. (A) Superior, (B) left; and (C) anterior.
Network Construction
Structural connectivity networks were constructed using the UCLA Multimodal Connectivity Package 38 for graph analysis. A 90 × 90 square connectivity matrix was calculated with the value in each entry equal to the number of streamlines connecting the corresponding pair of brain regions. It should be noted that, among the 116 brain regions from the AAL atlas, there are 90 cortical and subcortical gray matter regions and 26 cerebellar regions. In the present study, the 26 cerebellar regions were not included in the analysis to avoid potentially spurious results in the fiber tracking process associated with cerebellar regions. Only the 90 cortical and subcortical gray matter regions were used in the construction of the connectivity matrix.
Graph Theory Analysis
Graph theory analysis was applied to calculate both global and regional network measures using the Brain Connectivity Toolbox 25 developed in Matlab (R2012b, The MathWorks, Inc, Natick, MA, USA). Additional customized Matlab scripts were also developed to incorporate network measure functions in the data analysis. The Brain Connectivity Toolbox is a free open source software package that includes functions, procedures, and algorithms for all the network measures used in the present study. The Matlab scripts and the description of the functions can be found and downloaded (http://www.brain-connectivity-toolbox.net). A brief description about the concept of the network measures can be found in the Supplemental Material. A more detailed description and the corresponding mathematical definition of the network measures can be found in the work of Rubinov and Sporns 25 in 2010 (see their table A1). The global network connectivity indices examined included global efficiency (Eglob), mean local efficiency (Eloc), modularity (MOD), normalized clustering coefficient (γ), normalized characteristic path length (λ), and small-worldness (σ). Regional network connectivity indices examined included nodal degree, nodal clustering coefficient, nodal local efficiency, and nodal betweenness centrality.
Neurobehavioral Measures
Standardized measures were administered at times 1 and 2 to assess changes in attention and EF skills. The test battery included the Sky Search (selective attention), Score! (sustained attention), Walk/Don’t Walk (inhibition), and Code Transmission (sustained attention) subtests from the Test of Everyday Attention for Children (TEA-Ch), 39 and the Trail Making Test (cognitive flexibility), Color-Word Interference Test (verbal inhibition), and Tower Test (planning and reasoning, impulse control) from the Delis-Kaplan Executive Function System (D-KEFS). 40 In addition, everyday EF was assessed using the parent- and self-report from the Behavior Rating Inventory of Executive Function (BRIEF). 41 The Behavioral Regulation Index (BRI), Metacognitive Index (MI), and Global Executive Composite (GEC) were analyzed.
Statistical Analysis
The group differences of participant characteristics were tested using unpaired 2-sample t test for age, chi-square test for sex, and Fisher’s exact test for ethnicity and handedness. Mixed model analysis was used to quantify the group differences in structural connectivity at time 1 and changes in structural connectivity from time 1 to time 2, with group (TBI and HC) as a between-subjects variable and time (times 1 and 2) as a within-subjects variable. In this model, subject was included as a random effect, and only random intercept was modeled. The sample size was not big enough to fit a complex model with random slopes. Therefore, random slope was not included in the model in the final analysis. Effect sizes were computed by standardizing all continuous variables (mean = 0, SD = 1) and obtaining parameter estimates based on the final mixed model for each dependent variable. The resulting coefficients are akin to standardized mean differences (eg, d). 42 We used conventional definitions of effect size for mean differences and any interactions involving them: 0.2 is small; 0.5 is medium; 0.8 is large. The false discovery rate 43 method was used to address the potential type I error resulting from the large number of comparisons of local network measures.
Spearman rank-order correlation analysis was used to quantify the correlation between changes in structural connectivity measures (time 2 − time 1) and changes in neuropsychological and parent-/child-report measures following the AIM intervention (time 2 − time 1) in the TBI group. Effect size for correlation was determined as follows: 0.1 is small, 0.3 is medium, and 0.5 is large. Associations of changes in regional connectivity with changes in outcome were examined only if a region had a corrected significant group difference at time 1 and significant change from time 1 to time 2 in the TBI group relative to the HC group.
Results
Global Network Measures
At time 1, the TBI group was found to have significantly higher small-worldness than the HC group, t(26) = −2.30, P = .03, large effect size = −0.87. The small-worldness value in TBI group at time 1 was not significantly correlated with time since injury (r = 0.11, n = 10, P = .768). No significant group difference was found in any other global network measures at time 1. No significant group difference was found in any global network measures after the training. The mean and standard deviation values for each group at time 1 and time 2 are reported in Table 2 along with results of t tests for time 1 group differences, and the mixed model group × time interaction and their respective effect sizes. Age, age at injury, and time since injury were tested for their correlation with the global network measures in the 17 patients in the TBI group at time 1 and also with the change of global network measures in the 10 patients who completed the AIM training. None of these correlations was significant.
Mixed Model Analysis of Global Network Measures. a
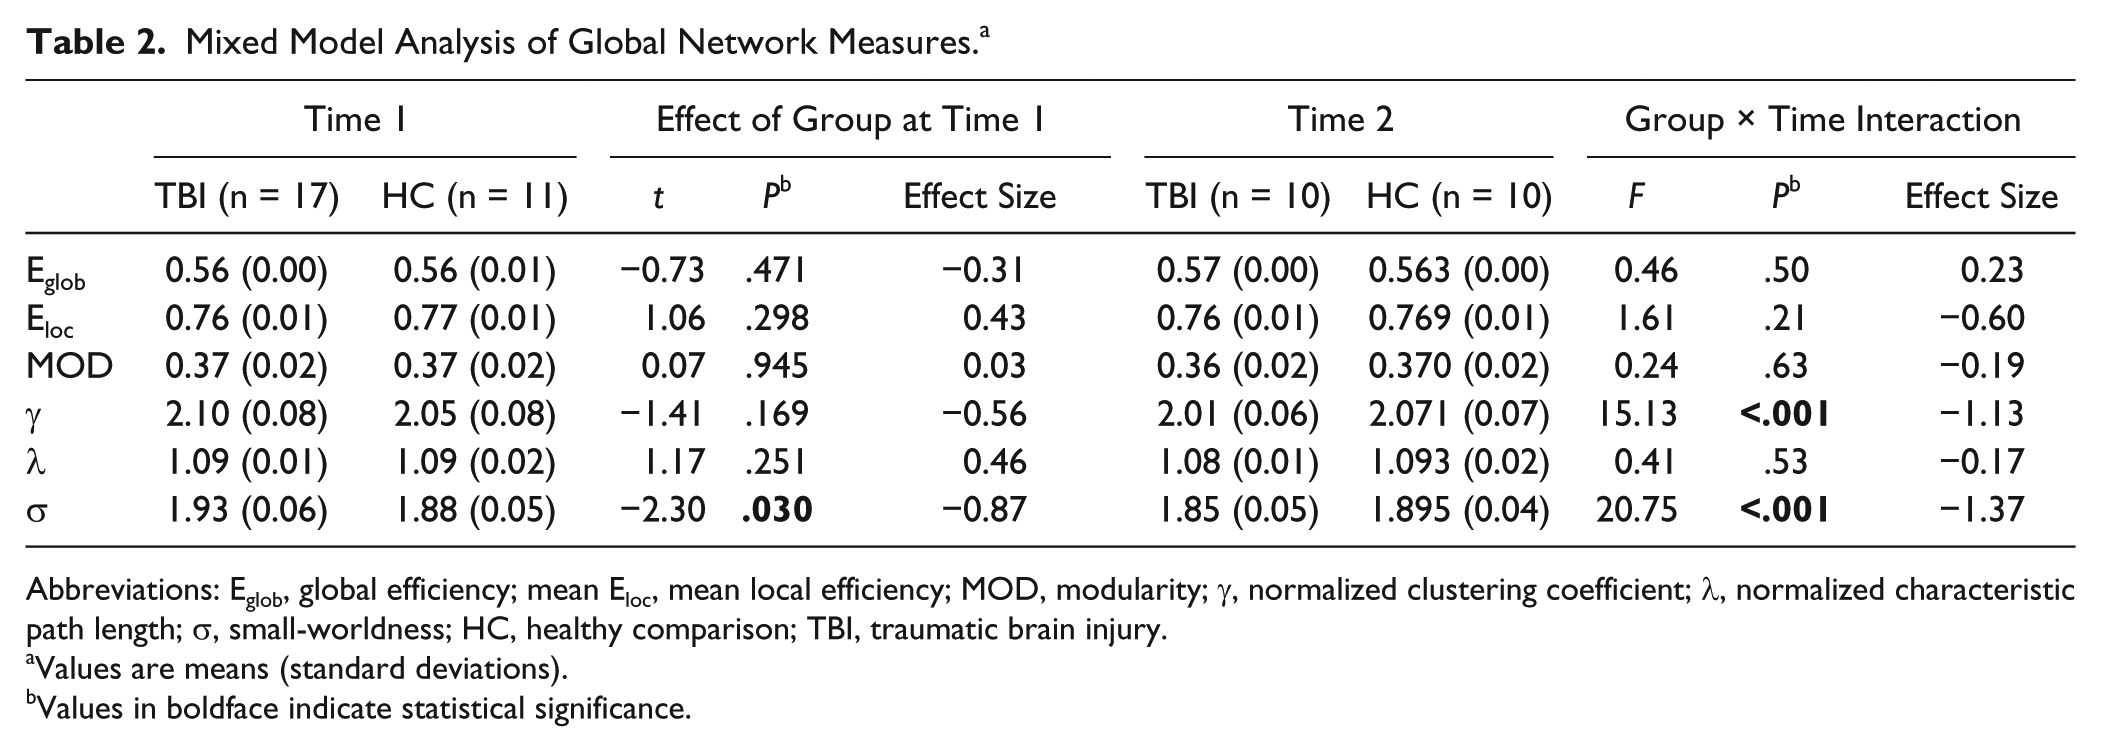
Abbreviations: Eglob, global efficiency; mean Eloc, mean local efficiency; MOD, modularity; γ, normalized clustering coefficient; λ, normalized characteristic path length; σ, small-worldness; HC, healthy comparison; TBI, traumatic brain injury.
Values are means (standard deviations).
Values in boldface indicate statistical significance.
As shown in Figure 2 and Table 2, significant group × time interactions were found for the normalized clustering coefficient and small-worldness, both with large effect sizes. Simple main effects revealed that the TBI group’s normalized clustering coefficient decreased significantly from time 1 to time 2, t(26) = 4.47, P < .001, large effect size = 0.91, whereas the normalized clustering coefficient in the HC group remained relatively unchanged. Similarly, the small-worldness decreased significantly from time 1 to time 2 in the TBI group, t(26) = 5.20, P < .001, large effect size = 1.09, whereas it remained relatively unchanged in the HC group. The group × time interactions for the other structural connectivity measures were not statistically significant and effect sizes were trivial to medium in magnitude.
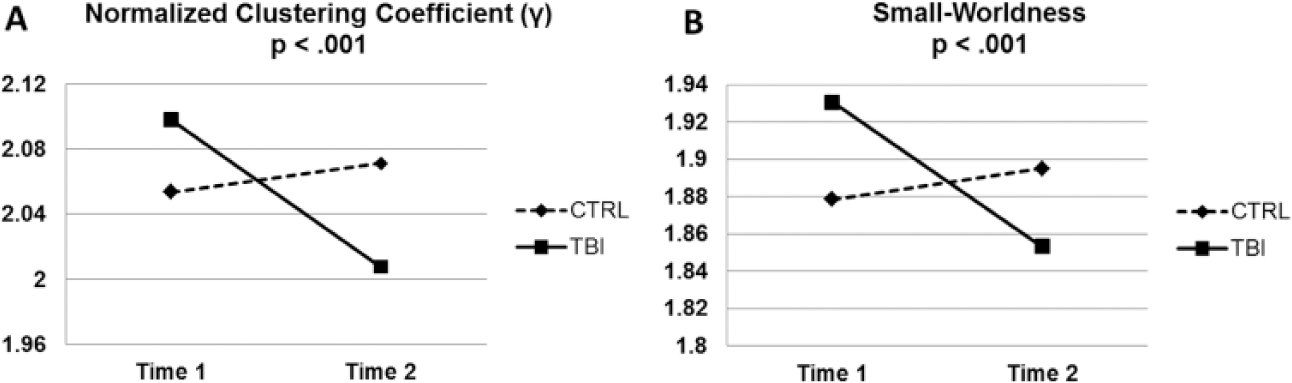
Group × time interaction effect on the (A) normalized clustering coefficient and (B) small-worldness measures. CTRL = healthy control; TBI = traumatic brain injury.
Figure 3 shows the small-worldness value of all the individual participants displayed separately based on study groups and time points. Significant decrease in the small-worldness was found from time 1 to time 2 within the TBI group (paired t test, P < .001) but not in the HC group. Significant group difference in the small-worldness was found at time 1 (higher in TBI, Student t test, P < .03) but not at time 2.
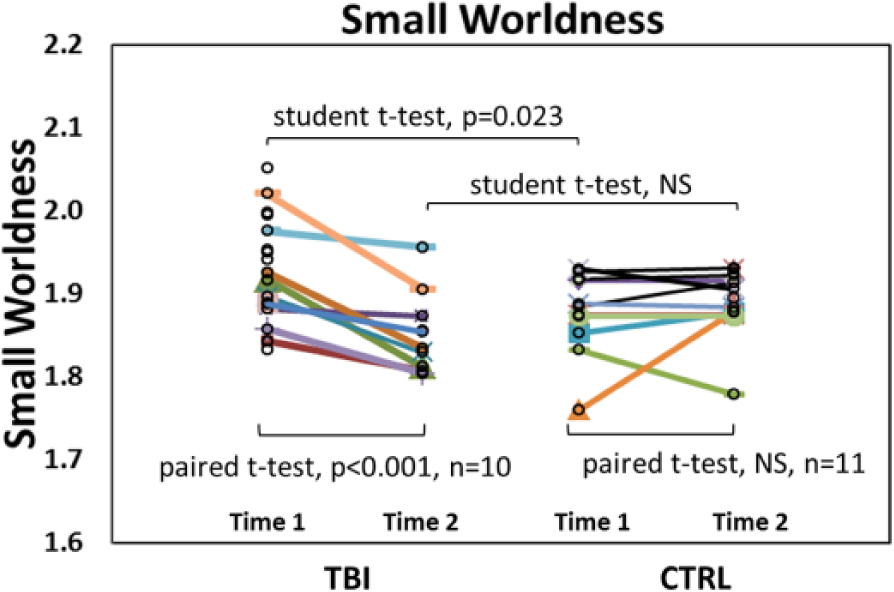
Scatter plot of small-worldness in individual participants. CTRL = healthy control; TBI = traumatic brain injury. NS = not significant. Sample size for TBI group was 17 at time 1 and 10 at time 2 (10 had imaging data at both time points). Sample size for CTRL was 11 at both time 1 and time 2 (all had imaging data at both time points).
Regional Network Measures
At time 1, group differences in one or more of the regional network connectivity measures were found in a series of brain regions at P < .05 (uncorrected) during the initial assessment. These regions included superior frontal gyrus, superior frontal gyrus orbital part, inferior parietal gyrus, angular gyrus, fusiform gyrus, paracentral lobule, supramarginal gyrus, superior temporal gyrus, and thalamus. However, no group difference remained significant after false discovery rate correction for multiple comparisons.
Neurobehavioral Measures
Time between assessments did not differ significantly between the TBI (19.8 ± 5.8 weeks, range = 12.0-32.7 weeks) and HC groups (15.4 ± 4.0 weeks, range = 9.9-24.6 weeks; P = .06). Detailed results of changes in neurobehavioral measures following the AIM intervention are provided elsewhere. 44 The results from the present subsample who underwent MRI are generally consistent with results from the total sample and are summarized in Table 3. Briefly, the TBI group showed significantly poorer performance at time 1 relative to the HC group on the TEA-Ch Code Transmission subtest and the D-KEFS Color-Word Interference Test Inhibition/Switching and Trail Making Test Number-Letter Switching scores. Participants with TBI and their parents also rated their EF on the BRIEF as significantly poorer than the HC group at time 1. Following the AIM intervention, the TBI group’s scores on the TEA-Ch Code Transmission subtest and scores from the BRIEF parent report improved significantly, whereas scores in the HC who did not receive the intervention remained relatively unchanged. Changes in performance on other neuropsychological measures following the AIM treatment were not significant.
Results of Mixed Model Analysis of Neurobehavioral Outcomes. a
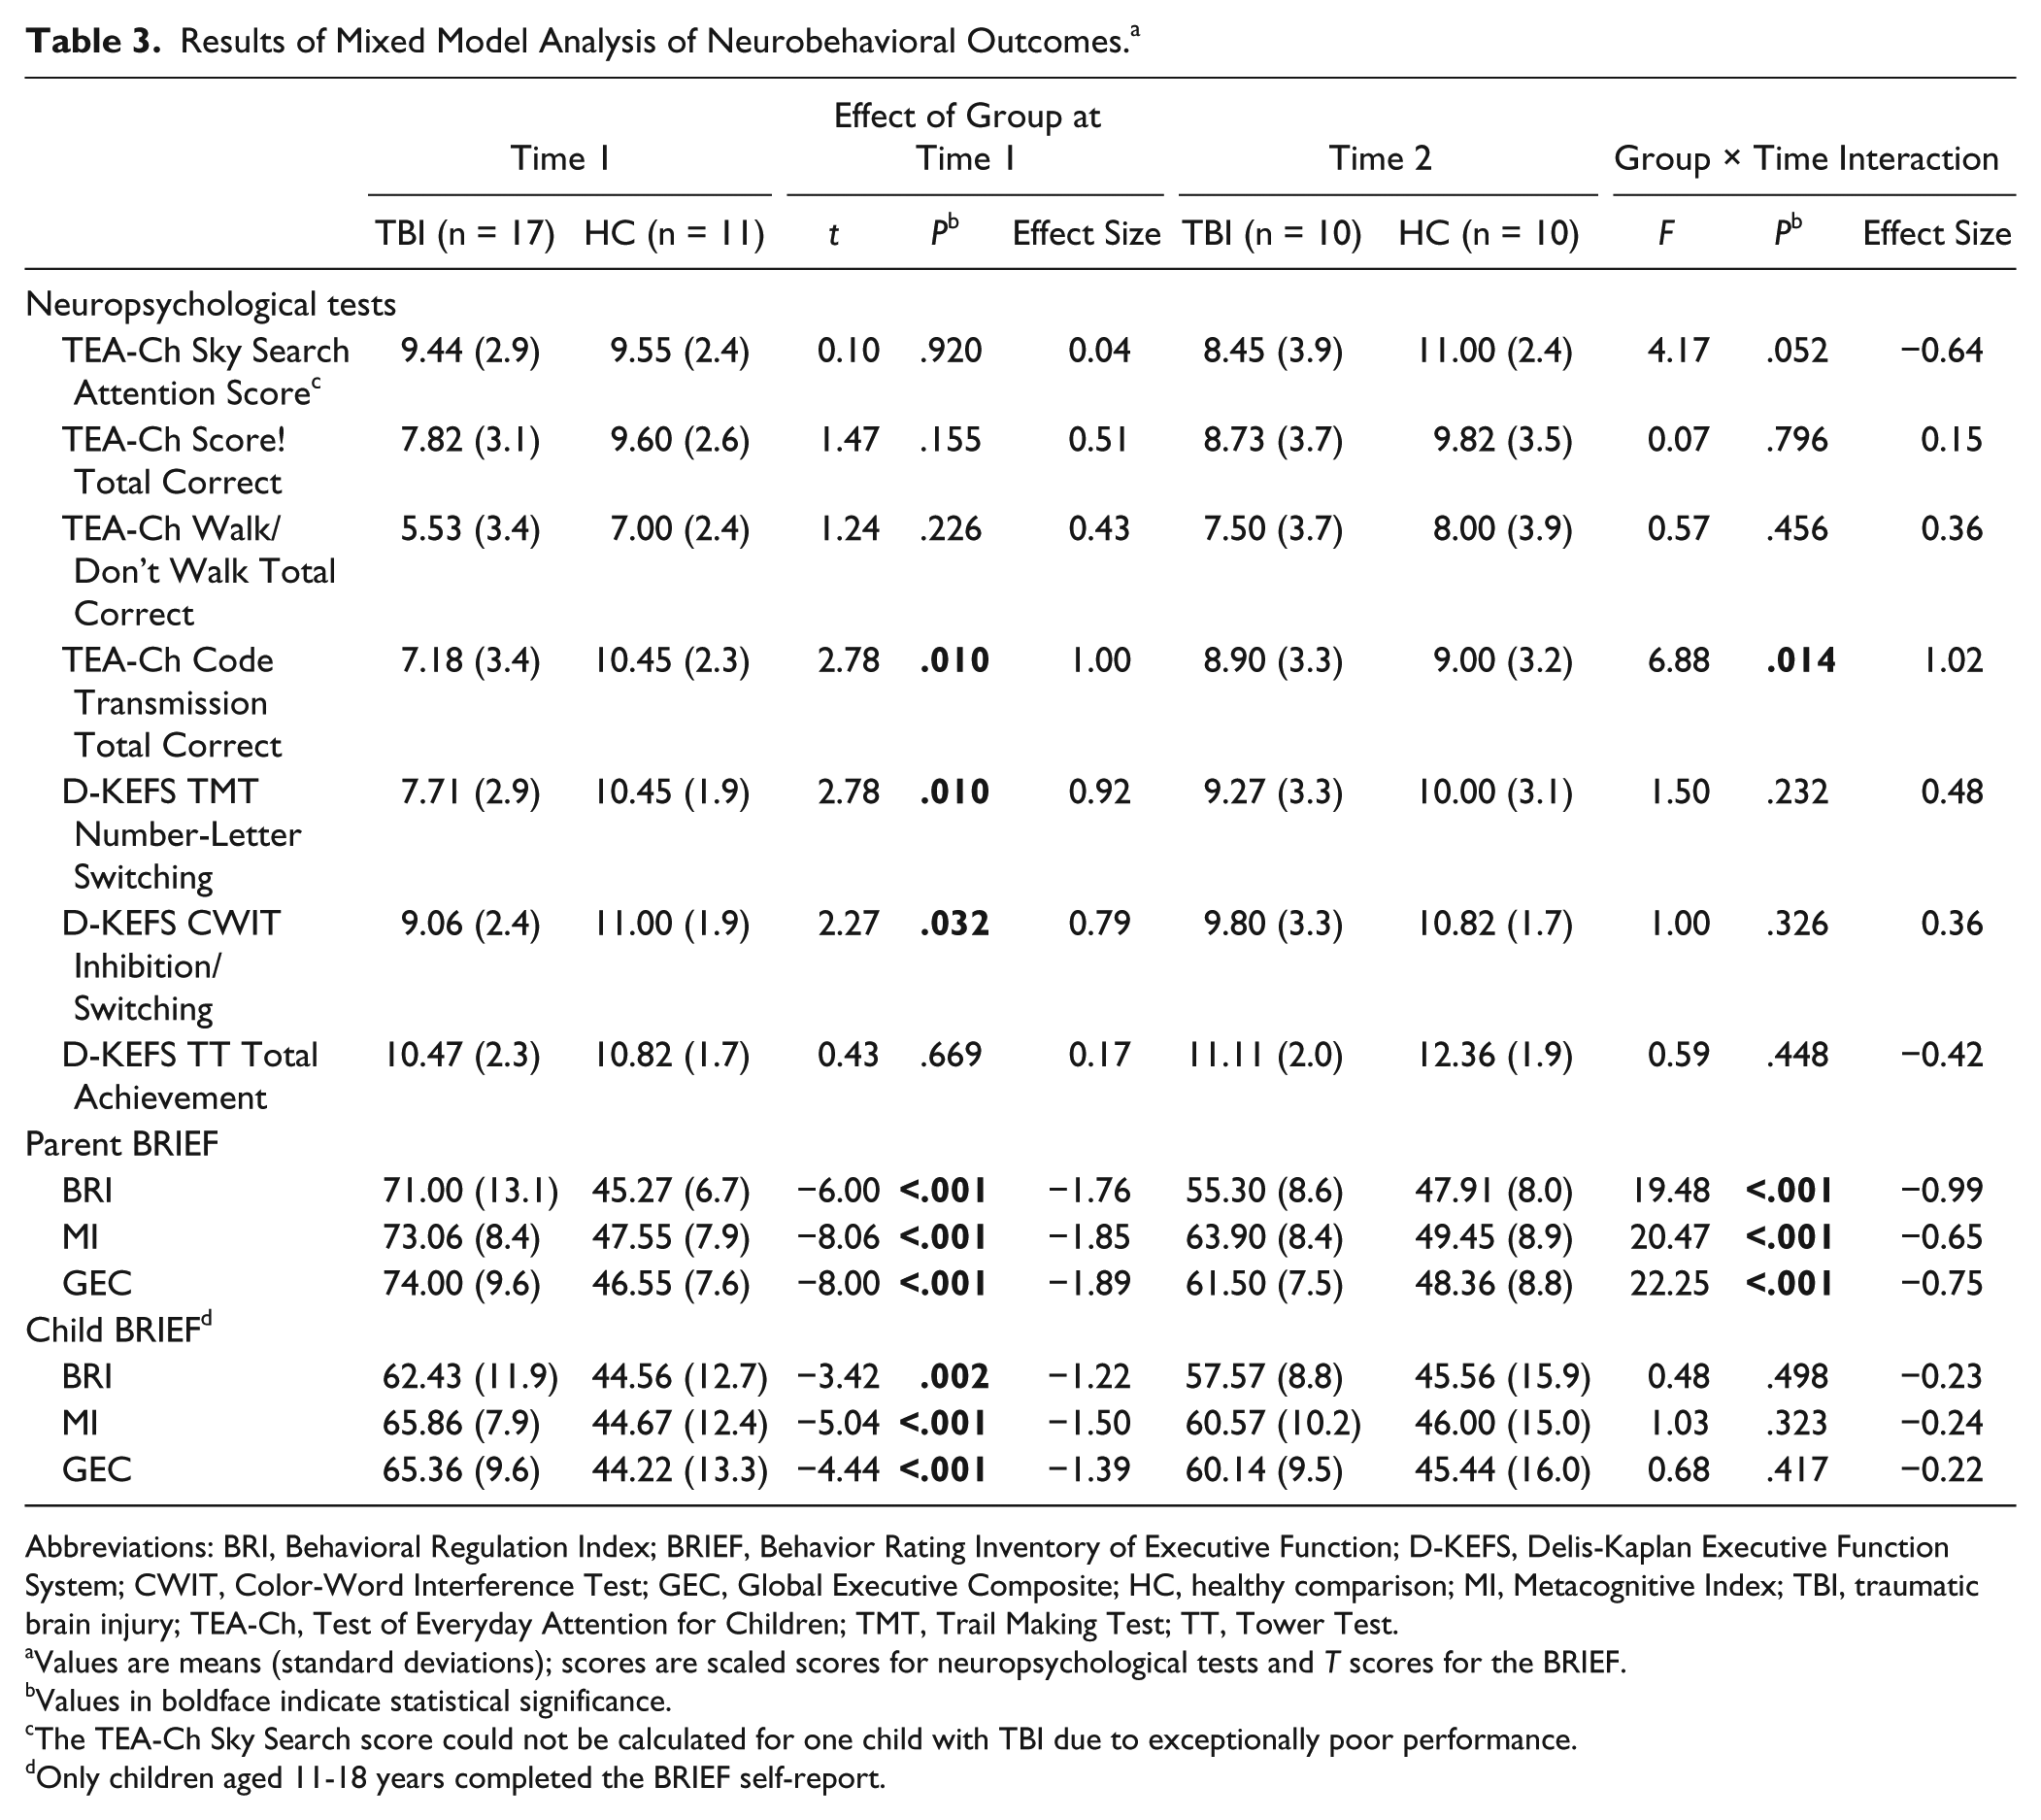
Abbreviations: BRI, Behavioral Regulation Index; BRIEF, Behavior Rating Inventory of Executive Function; D-KEFS, Delis-Kaplan Executive Function System; CWIT, Color-Word Interference Test; GEC, Global Executive Composite; HC, healthy comparison; MI, Metacognitive Index; TBI, traumatic brain injury; TEA-Ch, Test of Everyday Attention for Children; TMT, Trail Making Test; TT, Tower Test.
Values are means (standard deviations); scores are scaled scores for neuropsychological tests and T scores for the BRIEF.
Values in boldface indicate statistical significance.
The TEA-Ch Sky Search score could not be calculated for one child with TBI due to exceptionally poor performance.
Only children aged 11-18 years completed the BRIEF self-report.
Correlations Between Changes in Structural Connectivity and Changes in Neurobehavioral Outcomes
As shown in Table 4 and Figure 4, reductions in mean local efficiency were significantly associated with improvements in D-KEFS CWIT inhibition/switching, parent-reported BRIEF MI, and child-reported MI and GEC. Increased normalized characteristic path length was significantly associated with improved TEA-Ch Code Transmission Total Correct. All significant correlations were large in magnitude.
Spearman Rank-Order Correlations Between Changes in Global Structural Connectivity and Changes in Neuropsychological and Parent-/Child-Report Measures in TBI Group.
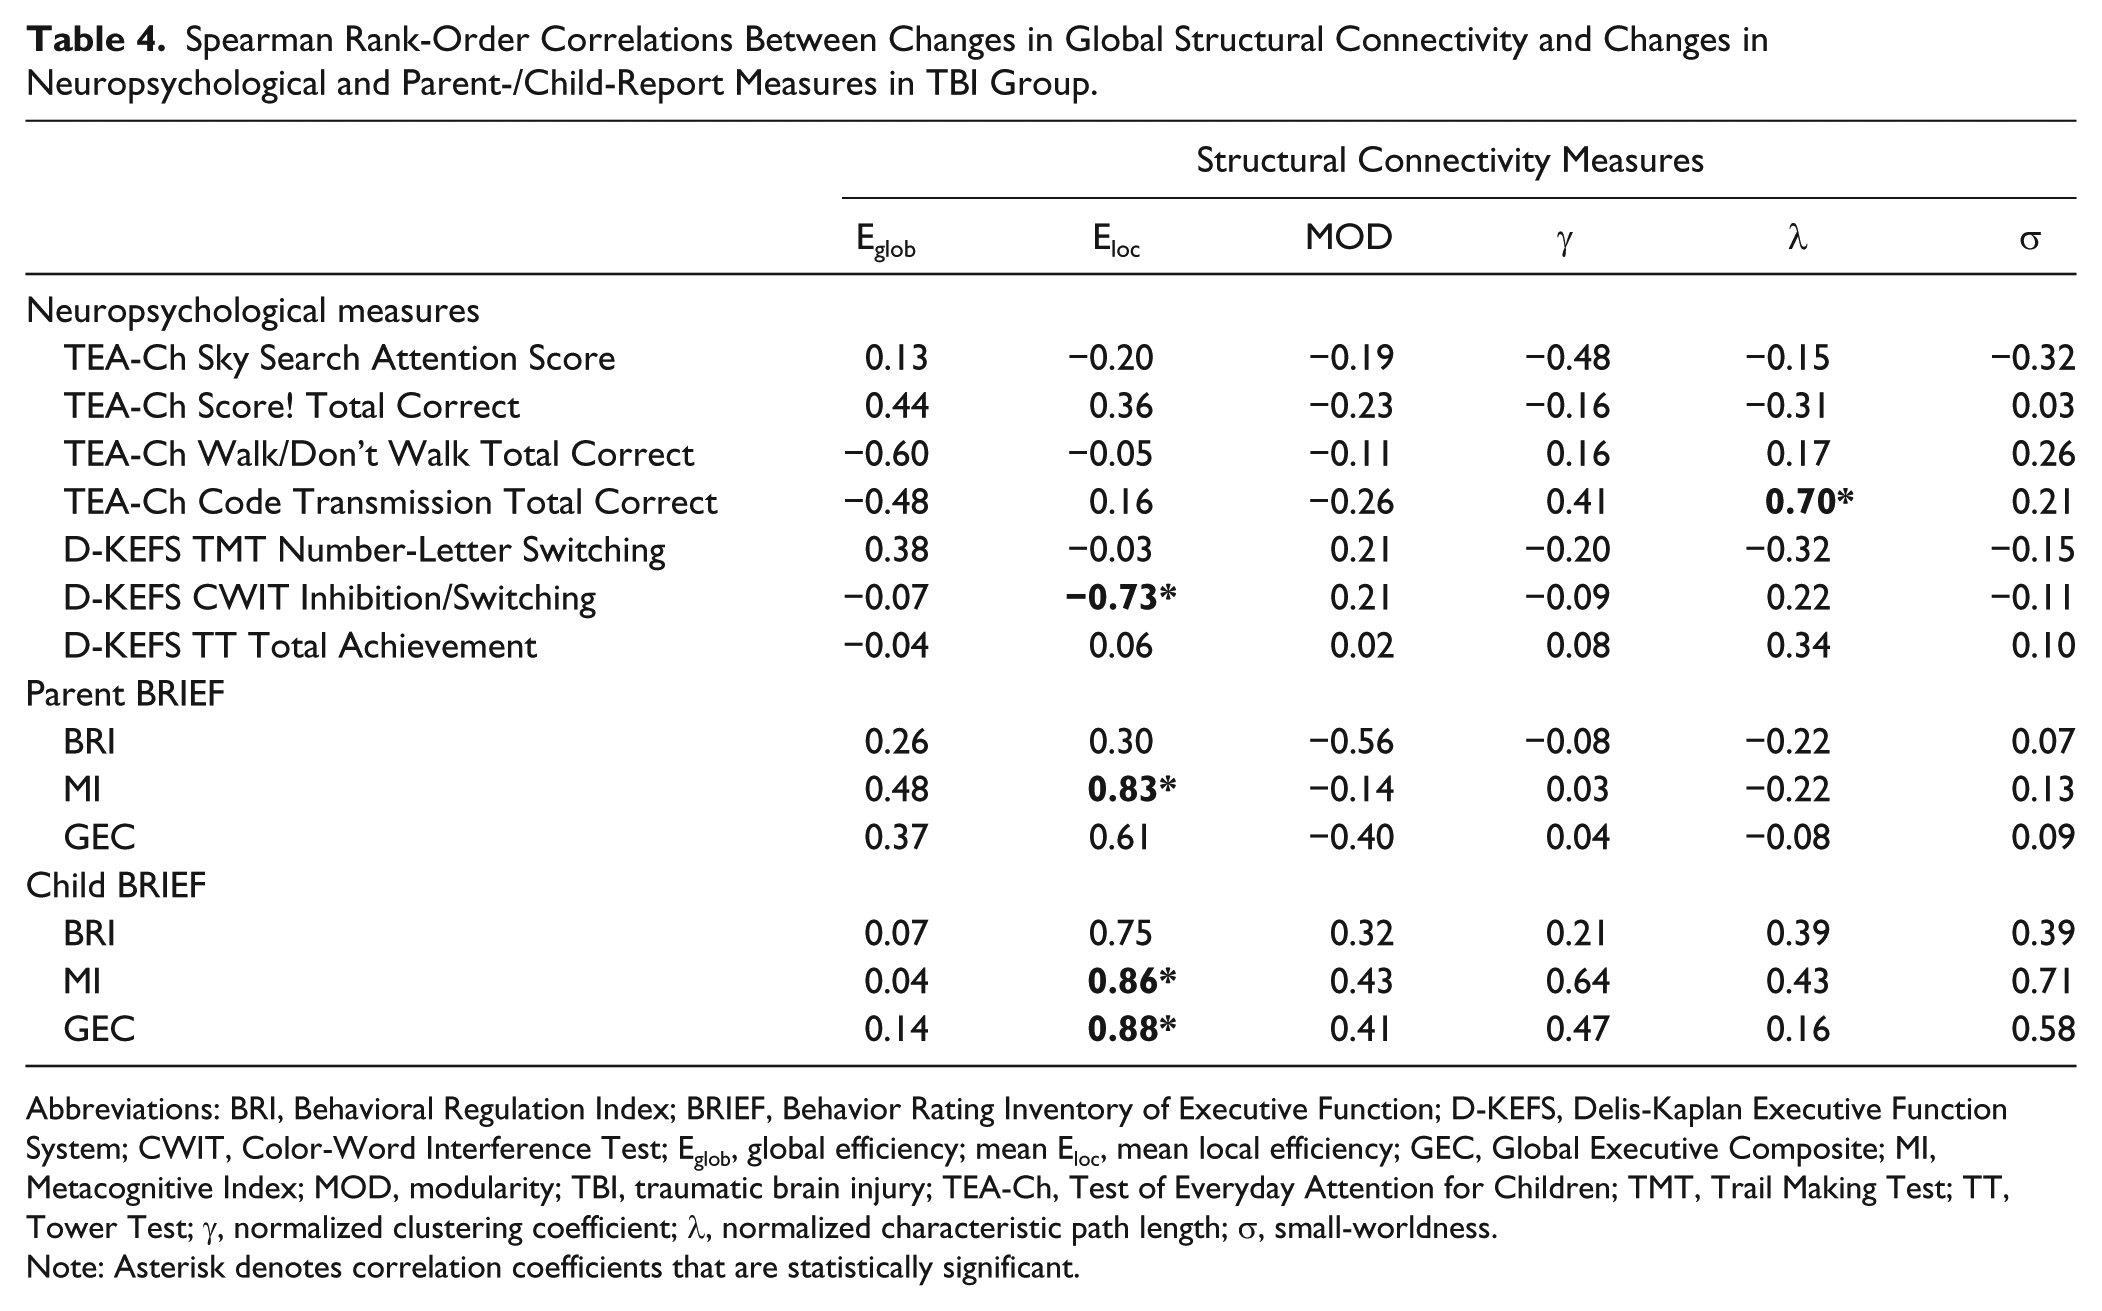
Abbreviations: BRI, Behavioral Regulation Index; BRIEF, Behavior Rating Inventory of Executive Function; D-KEFS, Delis-Kaplan Executive Function System; CWIT, Color-Word Interference Test; Eglob, global efficiency; mean Eloc, mean local efficiency; GEC, Global Executive Composite; MI, Metacognitive Index; MOD, modularity; TBI, traumatic brain injury; TEA-Ch, Test of Everyday Attention for Children; TMT, Trail Making Test; TT, Tower Test; γ, normalized clustering coefficient; λ, normalized characteristic path length; σ, small-worldness.
Note: Asterisk denotes correlation coefficients that are statistically significant.
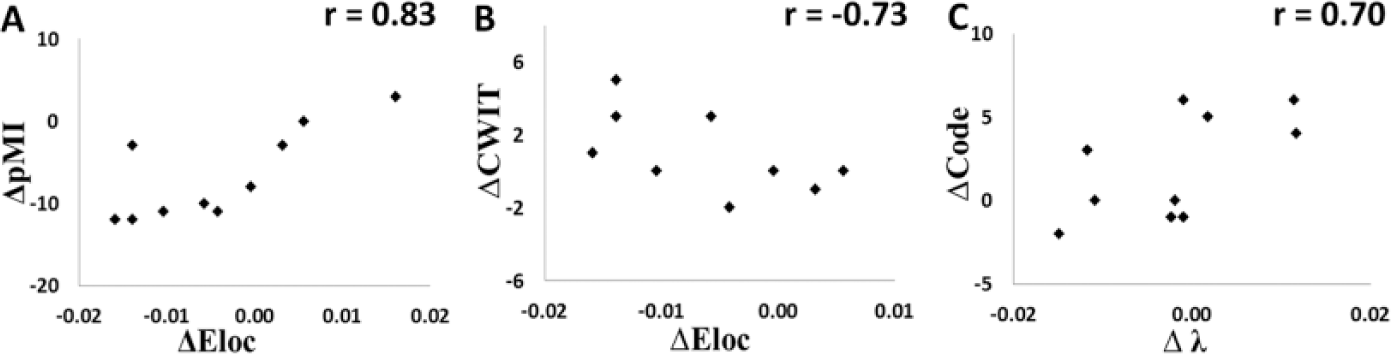
Significant correlations between changes in global network measures and changes in neurobehavioral outcome measures. (A). ΔEloc versus ΔpMI (r = 0.83); (B) ΔEloc versus ΔCWIT (r = 0.73); (C) Δλ versus ΔCode (r = 0.70). In addition, ΔEloc also strongly correlated with ΔsMI (r = 0.86) and ΔsGEC (r = 0.88, not shown). Eloc, mean local network efficiency; λ, normalized characteristic path length; pMI, Metacognitive Index from Parent Report of Behavior Rating Inventory of Executive Function; sMI, Metacognitive Index from Self-Report of Behavior Rating Inventory of Executive Function; sGEC, Global Executive Composite from Self-Report of Behavior Rating Inventory of Executive Function; CWIT, Color-Word Interference Test; Code, Code Transmission Total Correct in Test of Everyday Attention for Children.
Discussion
To the best of our knowledge, this is the first longitudinal neuroimaging study using graph theoretical analysis to investigate network changes in structural connectivity in response to intervention, and to examine the association between changes in connectivity and changes in neurobehavioral outcomes in children with TBI more than 12 months after the initial injury. Our findings provide initial evidence of structural neuroplasticity associated with neurobehavioral improvement following a drill-based intervention addressing attention and EF. The findings also support the utility of graph theoretical analysis in quantifying long-term brain network abnormalities following pediatric TBI and changes in structural connectivity in response to cognitive intervention.
Abnormalities in Structural Connectivity in Pediatric TBI
In graph theory, a “small-world” network is a system characterized by the existence of many short-distance connection and some long-distance connections, the balance of which represents a compromise between network wiring cost and the demand for speed and efficiency at different system levels. It is a global measure representing the balance between network segregation and integration. 45 In the present study, although both children with TBI and HC children demonstrated typical characteristics of small-world system at both time points (normalized clustering coefficient ≫1, normalized characteristic path length ≈1, and small-worldness ≫1), the TBI group had significantly higher small-worldness than the HC group at time 1. This suggested that the network in the TBI group had relatively more closely connected nodes with short-distance connections, which represented a shift of balance toward being a more segregated network. Our results are similar to the finding of increased small-worldness in a recent study of children with acute mild TBI. 29 Higher small-worldness can be determined by changes in either the normalized clustering coefficient, normalized characteristic path length, or both. In children with acute mild TBI, 29 higher small-worldness was driven mainly by the elevated normalized clustering coefficient, although the normalized characteristic path length was also elevated relative to orthopedically injured controls. Caeyenberghs et al26,27 also reported the increase of normalized clustering coefficient and normalized characteristic path length in adults at 4 years after moderate to severe TBI, suggesting that the increase of these two parameters could extend to the chronic stage following severe TBI in adult patients. However, no follow-up data have been reported regarding how long alterations in normalized clustering coefficient and normalized characteristic path length persist and whether they resolve over time without rehabilitation. In the present study, children with TBI were injured 1 to 9 years previously (mean = 5.91 years, SD = 6.6). Although no significant abnormality was found in either normalized clustering coefficient or normalized characteristic path length at time 1, a significantly higher small-worldness was found in the TBI group, suggesting that postinjury network alteration can persist long term in children with complicated mild to severe TBI more than 12 months postinjury. In addition, no significant correlation was found between time since injury and small-worldness, an indication that the impact of injury did not resolve linearly over time during the up to 9 years of recovery in this cohort.
Initial analysis of regional network measures showed significant group differences with P < .05 at time 1 in a number of brain regions. Some of these regions, for example, orbitofrontal gyrus and inferior parietal gyrus have been linked to either normal development and normal functioning of attention and EF or the compensatory mechanism or neuroplasticity response in neurological disorders.46-51 However, none of the differences survived the correction for the large number of multiple comparisons. Therefore, the regional network findings in the present study should be regarded as exploratory.
Structural Neuroplasticity in Response to Short-Term Intervention
Conventional DTI has been found to be sensitive to WM alterations after training or intervention in both HC and various patient populations. 19 Training length varied widely, from 2 to 8 weeks19,52-55 to up to 3 to 6 months,56,57 with posttraining functional improvement found in a number of domains, including reasoning, memory, and learning. Taken together, these studies suggest that short-term training is often practical and effective in triggering brain structural reorganization. In the present study, the length of the attention and metacognitive strategy training was approximately 3 months. Small-worldness decreased significantly in the TBI group following intervention, suggesting that the AIM intervention may have affected the course of recovery after an average of 5.91 years since injury in this cohort in terms of the network balance between segregation and integration to more closely approximate small-worldness of the HC group. Combined with the significant change in normalized clustering coefficient but not in normalized characteristic path length, our data suggested that the network response to the AIM intervention was mainly through the change of local cliquishness, that is, change in connectivity with a small and local neighboring nodes, across the network rather than the change in long-distance connections.
The underlying mechanism of the long-term postinjury abnormalities of structural connectivity, as well as the normalization after intervention, remains to be examined in future neuropathological studies. Currently no data exist on the neuropathological correlates for the alterations in these network topological measures. Conventional DTI studies of neuroplasticity in response to rehabilitation intervention based on WM fractional anisotropy often attribute the changes to a series of factors, for example, the alteration of anisotropy in myelin sheath, axonal membrane, and oligodendroglia, as well as the size, orientation, and density of axon. It is plausible that the neural plasticity observed in the present study was a manifestation of some of these factors that contributed to the results of fiber tracking and eventually affected the topological nature of the network. Apart from the possible influence of small sample size for type II error, it is unclear why only small-worldness demonstrated significant group difference at time 1 and only small-worldness and normalized clustering coefficient had significant change in response to the AIM intervention. Nevertheless, our data provided initial evidence that these measures are sensitive to detect the impact of injury and the neuroplasticity in response to cognitive intervention, and thus are expected to play a prominent role in future TBI studies of structural connectivity.
Associations Between Changes in Structural Connectivity and Changes in Outcomes
In the present study, 5 statistically significant correlations, with corresponding large effect sizes, were found between changes of global network measures and changes in neurobehavioral outcomes. Specifically, reductions in mean local efficiency were significantly associated with improvements in verbal inhibition as well as both parent- and child-reported everyday EF. Mean local efficiency is an estimation of network segregation with lower values associated with lower levels of local clustering and higher levels of segregation. In the 10 TBI participants, mean local efficiency decreased in 6, increased in 3, and did not change in 1 participant. This association suggests that the response to AIM is underpinned by the decrease of system segregation, thus shifting the balance between segregation and integration toward the normal range. The significant association between increased normalized characteristic path length and improved sustained attention can be interpreted through the difference in the level of network integration. Larger normalized characteristic path length typically means lower level of integration, that is, information on average needs to cross more edges to reach its final destination. Although no significant group effect was found at time 1 or in the response to AIM in normalized characteristic path length, the correlations observed in the study seems to suggest that the initial change in normalized characteristic path length was in the direction of lowering of small-worldness, which was in line with the actual changes in the small-worldness measure.
Limitations
The small number of participants included in the present pilot study definitely limited the overall power in our statistical analysis. Our analysis of regional network connectivity was limited by insufficient power after correcting for multiple comparisons. The DTI data collected in this study have been analyzed using conventional approaches, including ROI- and voxel-based analyses of DTI indices. No significant findings were generated from these analyses, which may be attributable to the small sample size. However, the discrepancy between the presence of significant findings in conventional DTI metrics and the current analyses may be a reflection of the relative strength of the structural connectivity analysis in its capability to detect subtle but significant changes that affect the overall brain network. This was an open-label trial and did not include a control group with TBI. The study design was based on expectation about the lack of natural recovery after 12 months postinjury. 31 There has been no evidence in the literature that shows significant longitudinal findings within a period of 3 to 4 months in patients with TBI who are more than 1 year postinjury. Therefore, we did not anticipate significant neural changes due to natural recovery over the 10- to 15-week intervention period. Nevertheless, this approach precluded inferences that changes in the TBI group relative to the HC group were only attributable to the attention training program rather than other factors such as therapist attention. In addition, participants were relatively heterogeneous with respect to age, age at injury, time since injury, and injury severity. Factors such as neural maturation, interventionist attention, or an increased focus on memory and attention may all have contributed to observed improvements. Although some of these factors can be tested analytically and excluded for potential confounding effect for the group difference, we acknowledge that more carefully controlled studies with more stringent designs are needed to fully attribute connectivity changes to the AIM program.
Conclusions
Our results suggest that graph theoretical analysis of structural connectivity based on DTI tractography may be a sensitive tool for detecting brain network alterations in children with TBI at over 12 months postinjury. We found significant changes in global network measures in response to the AIM training and the changes in some of the network measures were significantly correlated with changes in the behavioral outcomes. These results suggest that the network connectivity approach may be a new avenue for exploring neuroplasticity in the brain network in response to cognitive training in children with TBI.
Footnotes
Authors’ Note
This material does not necessarily represent the policy of the funding agencies; nor is the material necessarily endorsed by the federal government.
Declaration of Conflicting Interests
The authors declared no potential conflicts of interest with respect to the research, authorship, and/or publication of this article.
Funding
The authors disclosed receipt of the following financial support for the research, authorship, and/or publication of this article: This work was supported in part by the Department of Education’s National Institute on Disability and Rehabilitation Research (Center on Intervention for Children and Youth with Traumatic Brain Injury; Grant No. H133B090010-10, PI Wade), the National Institute on Disability, Independent Living, and Rehabilitation Research (Grant No. 90RT5004, PI Wade), and an Emergency Medical Services Grant from the Ohio Department of Public Safety Emergency Medical Services (Title: The Effects of Cognitive Training on Attention and Neural Processing Following Pediatric TBI, PIs Wade/Yuan).
References
Supplementary Material
Please find the following supplemental material available below.
For Open Access articles published under a Creative Commons License, all supplemental material carries the same license as the article it is associated with.
For non-Open Access articles published, all supplemental material carries a non-exclusive license, and permission requests for re-use of supplemental material or any part of supplemental material shall be sent directly to the copyright owner as specified in the copyright notice associated with the article.