
Abstract
Objective. Traumatic brain injury (TBI) is not a single insult with monophasic resolution, but a chronic disease, with dynamic processes that remain active for years. We aimed to assess patient trajectories over the entire disease narrative, from ictus to late outcome. Methods. Twelve patients with moderate-to-severe TBI underwent magnetic resonance imaging in the acute phase (within 1 week of injury) and twice in the chronic phase of injury (median 7 and 21 months), with some undergoing imaging at up to 2 additional time points. Longitudinal imaging changes were assessed using structural volumetry, deterministic tractography, voxel-based diffusion tensor analysis, and region of interest analyses (including corpus callosum, parasagittal white matter, and thalamus). Imaging changes were related to behavior. Results. Changes in structural volumes, fractional anisotropy, and mean diffusivity continued for months to years postictus. Changes in diffusion tensor imaging were driven by increases in both axial and radial diffusivity except for the earliest time point, and were associated with changes in reaction time and performance in a visual memory and learning task (paired associates learning). Dynamic structural changes after TBI can be detected using diffusion tensor imaging and could explain changes in behavior. Conclusions. These data can provide further insight into early and late pathophysiology, and begin to provide a framework that allows magnetic resonance imaging to be used as an imaging biomarker of therapy response. Knowledge of the temporal pattern of changes in TBI patient populations also provides a contextual framework for assessing imaging changes in individuals at any given time point.
Introduction
Despite being precipitated by an acute event, it is becoming clear that traumatic brain injury (TBI) is not a single insult with monophasic resolution, but a chronic disease, with dynamic processes that remain active for years. 1 Both the acute illness and dynamic change over time result in physical and neuropsychological problems, which represent a substantial burden on the individual and society. Although ameliorating these deficits would be of substantial benefit, the mechanisms that underlie them are poorly characterized.
One of the most promising techniques to provide a means of addressing the neuroanatomical substrate of such disease evolution is diffusion tensor imaging (DTI).2,3 This technique characterizes the diffusion of water molecules in tissue environments, which are influenced by the microstructural organization of tissues and their constituent cells and can provide unique insights into pathophysiology, particularly in white matter (WM).
Previous studies in TBI have typically found consistent reductions in fractional anisotropy (FA) in classical areas affected by traumatic axonal injury, even when conventional magnetic resonance imaging showed no lesion.4-9 There is some evidence of dynamic white matter change over a longer time period.10,11 Both these studies found that most change (especially in the corpus callosum [CC]) occurred between their first (approximately 1-2 months), and second (approximately 1-2 years) time points. This temporal framework of comparing imaging within weeks of injury with repeat imaging only at chronic time points (months to years) is a disadvantage where imaging changes are being used to interrogate processes involved in either progressive pathology or repair, since the resolution of edema in the first few weeks after TBI introduces an important confound, which dominates imaging changes. Early after an injury edema may be associated with an increase in diffusivity (vasgogenic edema) and/or restricted diffusivity (cytoxtoxic edema). 12 Such pathology will also lead to changes with the diffusion tensor, influencing the calculated fractional anisotropy. This makes tractography difficult and confounds the interpretation of reduction in fiber counts at early stages, since this may be due to edema rather than true tract loss.
In order to gain insight into the microstructural substrates of late recovery or progressive deterioration the dynamic evolution of pathology from the acute to the postacute phase after TBI needs to be examined. Our aims in this study were to use DTI to fully characterize the entire narrative of disease between hours and years following TBI, to identify the microstructural substrates for both late recovery and deterioration in individual patients, and to undertake correlations between imaging findings and performance on a canonical neurobehavioral task, using targeted behavioral metrics with well-established neuroanatomical substrates.
Methods
Twelve patients underwent serial imaging using a 3-Tesla Siemens Magnetom TIM Trio at a minimum of 3 and up to 5 times after injury (see Table 1 for timing details). No patients had a history of previous TBI. All scans within the first 3 weeks were performed while patients required sedation and ventilation. There were no major scanner upgrades during the duration of the study. Ethical approval was obtained from the Local Research Ethics Committee (LREC 97/290) and written consent was obtained.
Demographic and Clinical Characteristics of the Patients. a
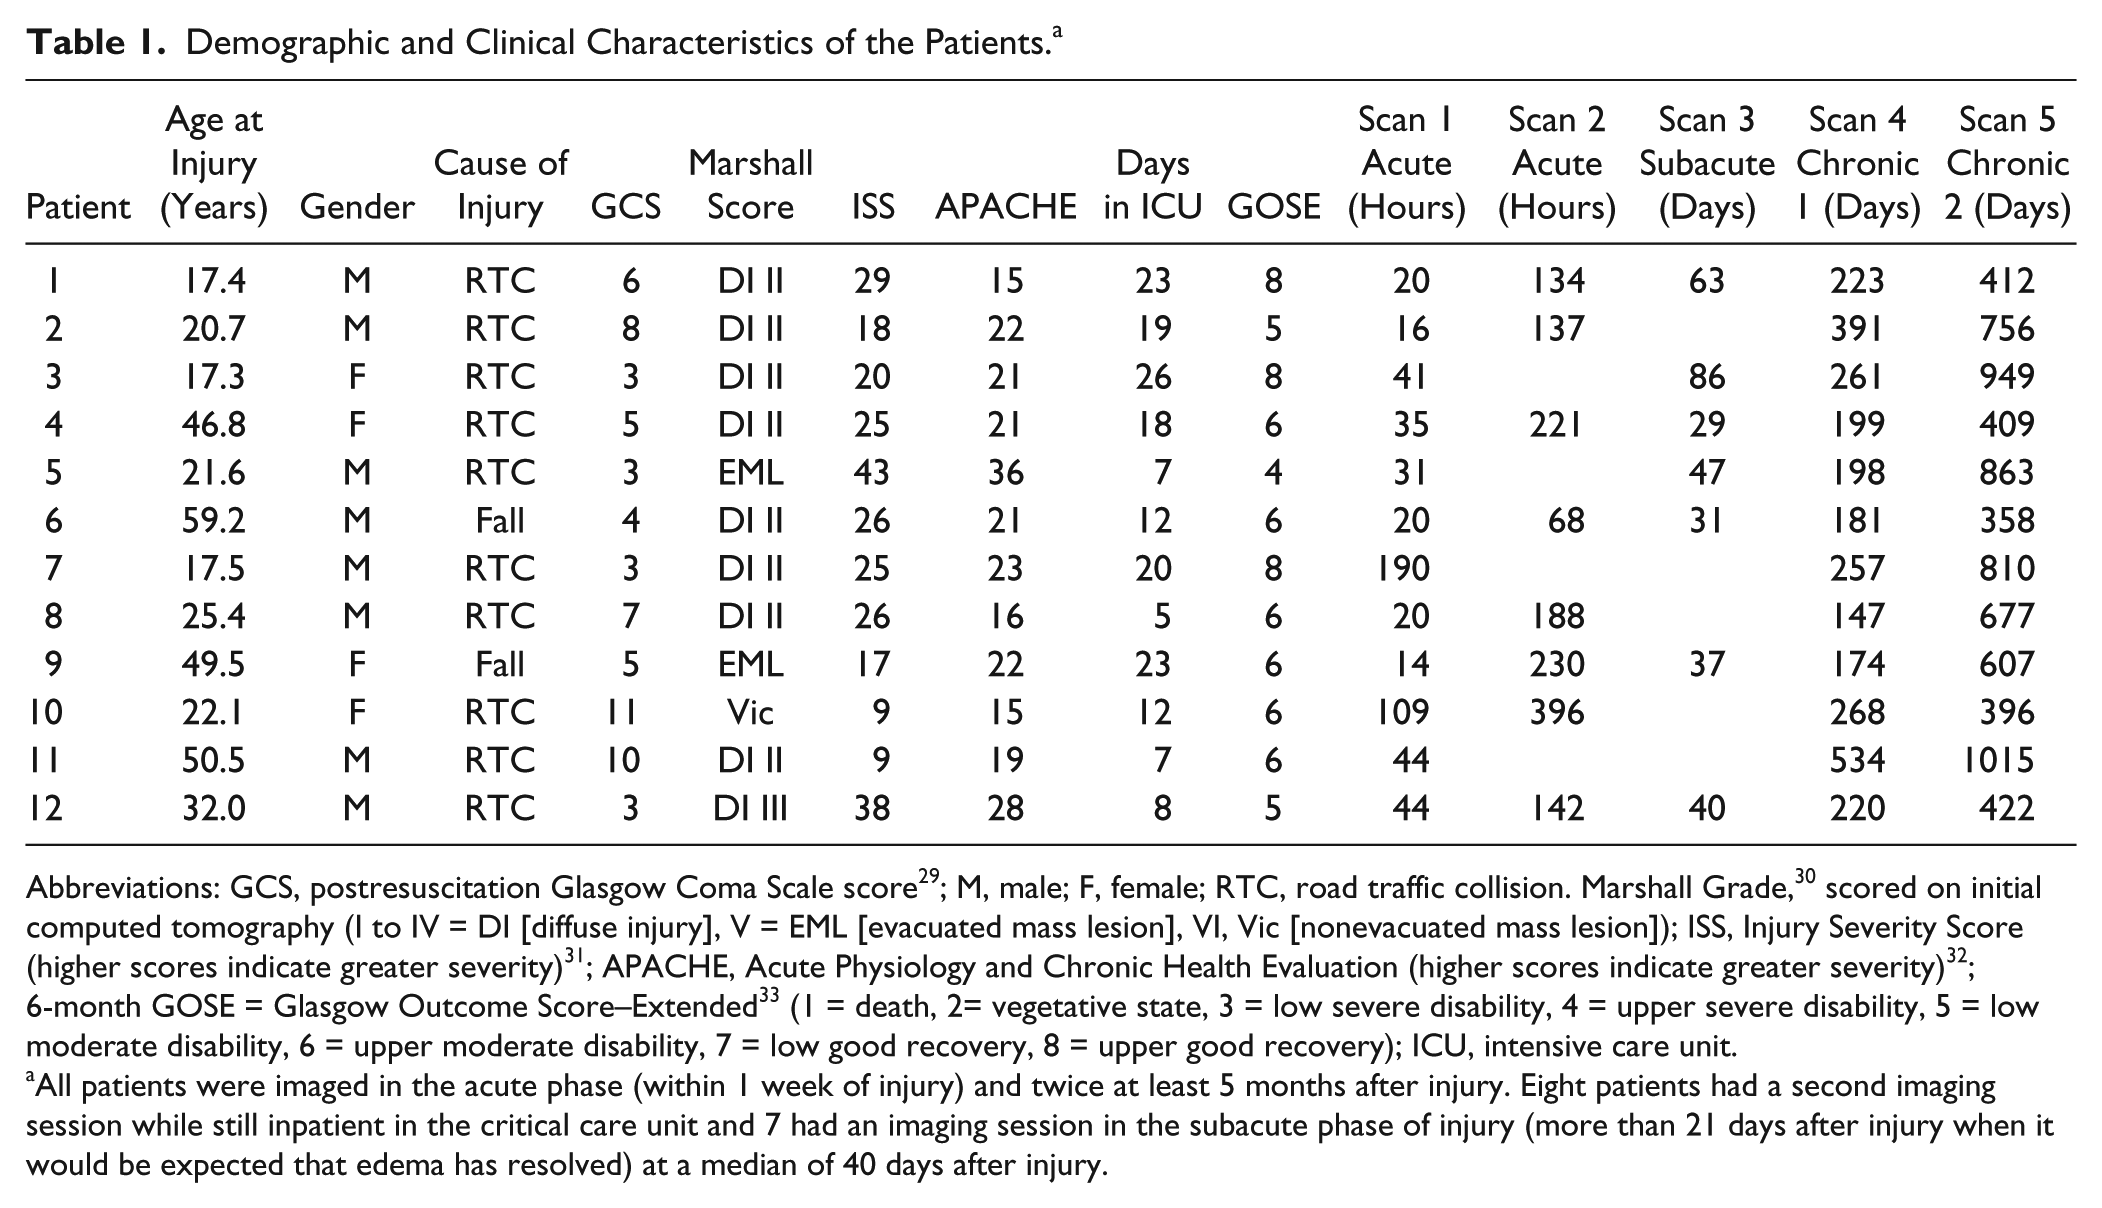
Abbreviations: GCS, postresuscitation Glasgow Coma Scale score 29 ; M, male; F, female; RTC, road traffic collision. Marshall Grade, 30 scored on initial computed tomography (I to IV = DI [diffuse injury], V = EML [evacuated mass lesion], VI, Vic [nonevacuated mass lesion]); ISS, Injury Severity Score (higher scores indicate greater severity) 31 ; APACHE, Acute Physiology and Chronic Health Evaluation (higher scores indicate greater severity) 32 ; 6-month GOSE = Glasgow Outcome Score–Extended 33 (1 = death, 2= vegetative state, 3 = low severe disability, 4 = upper severe disability, 5 = low moderate disability, 6 = upper moderate disability, 7 = low good recovery, 8 = upper good recovery); ICU, intensive care unit.
All patients were imaged in the acute phase (within 1 week of injury) and twice at least 5 months after injury. Eight patients had a second imaging session while still inpatient in the critical care unit and 7 had an imaging session in the subacute phase of injury (more than 21 days after injury when it would be expected that edema has resolved) at a median of 40 days after injury.
The imaging protocol included DTI (12 noncollinear directions, 6 b values equally spaced between 0 and 1588 s/mm2, matrix size 96 × 96, 2 mm isotropic voxels, repetition time = 8300 ms, echo time = 98 ms) and a 3-dimensional T1-weighted structural sequence (MPRAGE, isotropic voxel size of 1 × 1 × 1 mm). Imaging data were also collected in 30 age- and gender-matched controls, of which a subset of 8 subjects underwent 3 sessions over an 18-month period.
Neuropsychological testing was performed on patients on the same day as the imaging session for all time points in and beyond the sixth month after injury. Tests, designed to test memory, executive function, and attention were selected from the CANTAB battery of tests (Table 2, www.cambridgecognition.com).
Summary of the Results of the Neuropsychological Tests Used. a
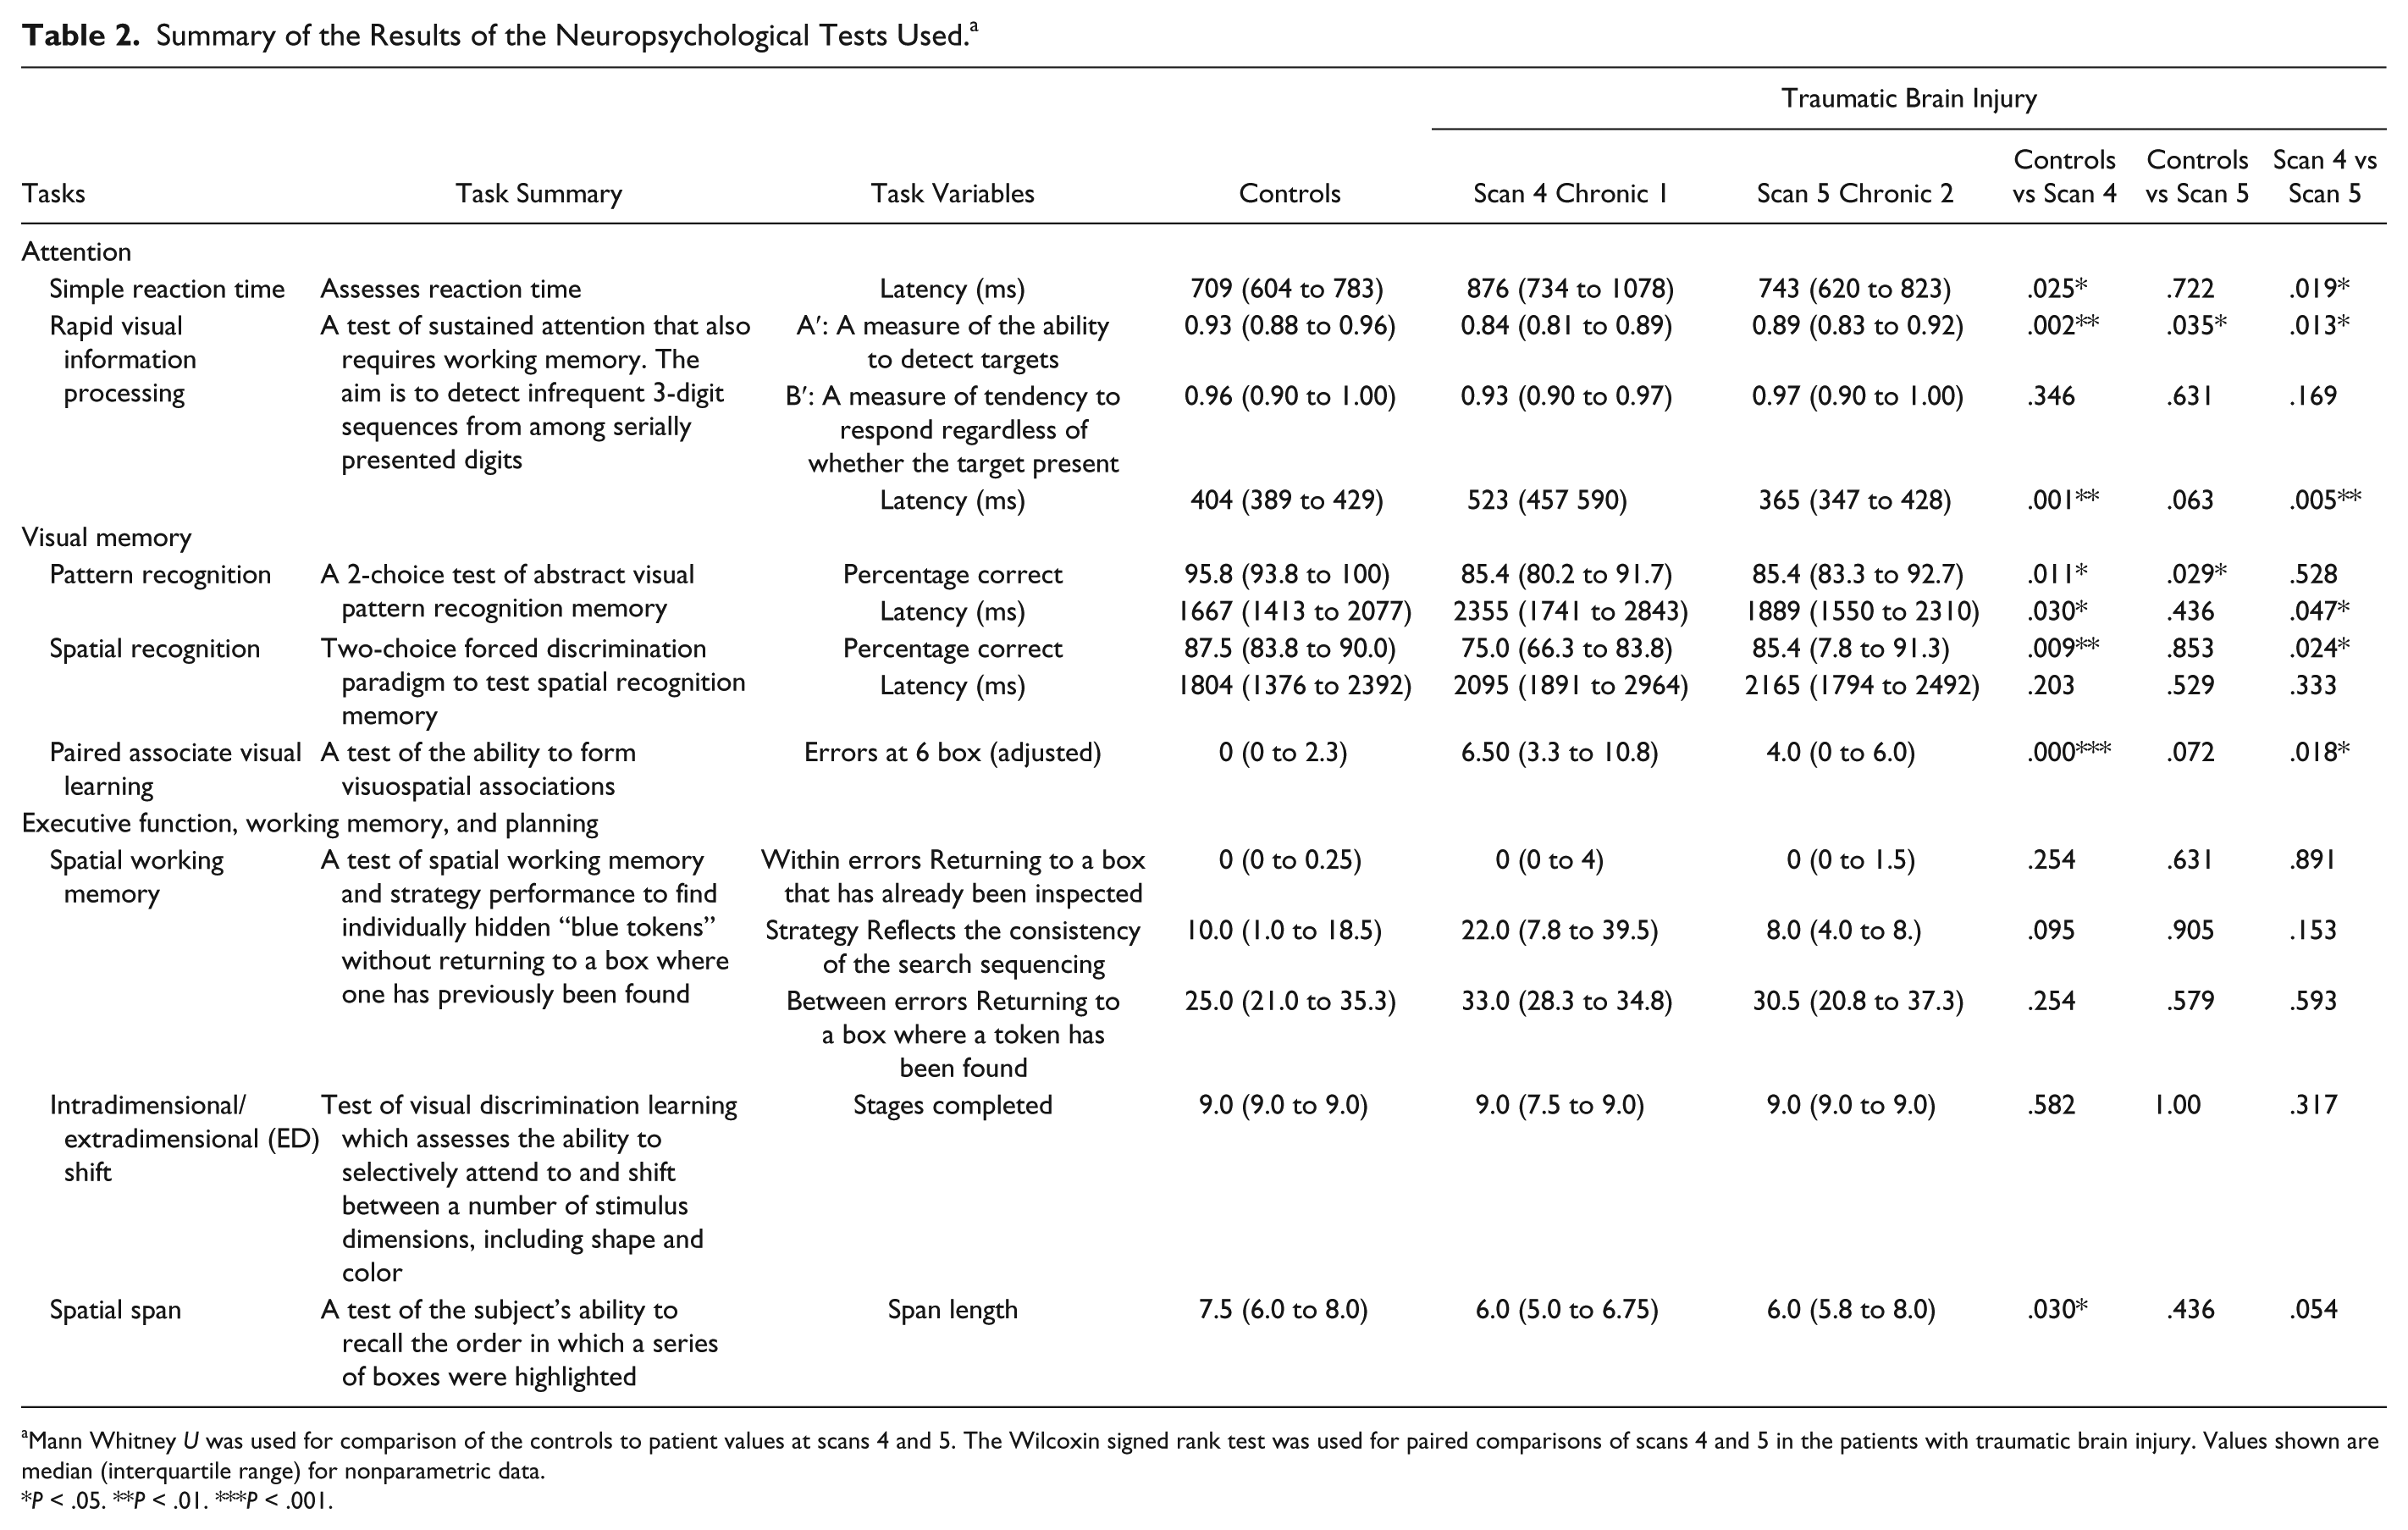
Mann Whitney U was used for comparison of the controls to patient values at scans 4 and 5. The Wilcoxin signed rank test was used for paired comparisons of scans 4 and 5 in the patients with traumatic brain injury. Values shown are median (interquartile range) for nonparametric data.
P < .05. **P < .01. ***P < .001.
Structural Volumetric Analysis
The T1-weighted images were preprocessed using the N4 algorithm to correct for intensity inhomogeneities. 13 The images were extracted with a brain mask calculated with pincram (www.soundray.org/pincram/). A multiatlas segmentation approach based on manually segmented brains from the OASIS database was used to segment the images (http://neuromorphometrics.com). 14 Registration was performed using MAPER, an approach that incorporates tissue probability maps into the registration and relies on a nonrigid registration based on free-form deformations.15,16 Using symmetric intrasubject registration,17,18 temporally corresponding scans were aligned. In an expectation-maximization framework, the availability of probabilistic segmentation estimates were exploited to perform a symmetric intensity normalization and segmentation. Symmetric differential bias correction for images in presence of pathologies was performed. A consistent multi–time point segmentation was achieved using a spatially and temporally varying Markov random field. 19 Volumetric analysis was performed in 2 canonical regions that have been strongly correlated with injury mechanisms and sites that have an impact on TBI outcome; whole brain white matter (WBWM) and the thalami.
Diffusion Tensor Imaging Analyses
Tractography
Whole brain deterministic tractography was performed for all patient scans and the larger set of controls to provide a representation of the overall atrophy of the WM. Streamline tractography was performed in the native diffusion space based on the Euler Delta Crossings algorithm using Diffusion Imaging in Python software (http://dipy.org) and the number of these “tracts” quantified. 20 Ten thousand seed points were used with a FA threshold of 0.2.
Region of Interest Analysis
FMRIB’s Diffusion Toolbox (FDT) was used to create FA, mean diffusivity (MD), and eigenvalue maps (www.fmrib.ox.ac.uk/fsl). To aid coregistration, the skull, and extracranial soft tissue were stripped from the MPRAGE images using the Brain Extraction Tool. 21 Head motion metrics were derived from the 3 translation (x, y, and z, in mm) and 3 rotation (α, β, and γ, in radians) parameters calculated with the motion and eddy current correction function eddy_correct. To acquire a summary measure of motion, the root mean square (RMS) volume of the 6 parameters describing the rigid body movement was calculated relative to the preceding volume, giving a measure of the head motion between volumes.
Region of interest (ROI) analysis was performed in the anterior CC, chosen as being representative of WM damage from traumatic axonal injury, and the thalamus as being, an important gray matter (GM) region affected in TBI. No significant differences in any diffusivity values were found between the right and left thalamic regions of interest (data not shown, available on request) and so for ease of assessment they were combined in this analysis. Regions were manually drawn on the T1 weighted image in MNI space using Analyze 7.0 (http://www.mayo.edu/bir). ROIs were transformed to the native diffusion space of patients using the vtkCISG mutal information algorithm. 16 Mean FA, MD, and eigenvalues for each ROI were obtained.
Voxel-Based Analysis of Diffusion Tensor Imaging
Although some studies have use tract-based spatial statistics (TBSS) to quantify white matter changes after TBI,22,23 we chose to use tensor-based morphometry (TBM) analysis to address the hypothesis that that WM injury would not be restricted to the center of major tracts but would also affect more peripheral WM, as well as the GM. FA maps were coregistered to MNI152 space and averaged to create a customized template. 16 FA and MD maps were coregistered to this study specific template and smoothed with a 10 mm isotropic Gaussian kernel.
To ascertain which areas of the brain were affected by longitudinal change after TBI, a flexible factorial model (allowing for unequal variances) was implemented in subjects who had an acute (the patient’s first scan, median 31 hours, range 14-44 hours), subacute (median 40 days, range 29-86 days), and chronic scans (the patient’s last scan, median 422 days, range 358-949 days). These 3 time points were chosen a priori, as it was hypothesized that the largest changes would be observed between these time points. The model included 8 controls who had undergone 3 imaging sessions.
To examine whether change in cognitive and motor performance was related to changes in imaging parameters, change in FA and MD was correlated with changes in performance in 2 canonical tasks (simple reaction time, and an index of memory function as measured by a paired associates learning [PAL] task). These tasks were chosen based on their relevance to TBI. Motor slowing is a pervasive finding in this patient group,24,25 and the PAL, a visuospatial associative learning task sensitive to mild cognitive impairment, has previously been shown in a cross-sectional analysis to correlate with diffusivity parameters after chronic TBI.25,26 Differences in performance metrics between the 2 time points were calculated for each subject, as were difference maps in FA and MD for the same interval. Correlations between change maps and changes in test scores were assessed using linear regression (www.fil.ion.ucl.ac.uk/spm/spftware/spm8), where changes in test scores were independent variables and change maps were the dependent variables. To increase sensitivity, all correlations of neuropsychological variables were limited to the WM for FA correlations and to GM for MD correlations. For all TBM correction for multiple comparisons was based on the family-wise error rate (P < .05). 27 To create scatterplots relating the change in FA and MD to change in reaction time, the significant regions were extracted and applied to the FA and MD change maps to obtain the individual patient values.
Statistical Analyses
Except for the TBM, statistical analyses were conducted using SPSS (SPSS 22.0, Chicago, IL, USA, www.spss.com). Mann-Whitney U was used for unpaired tests and the Wilcoxon signed rank test for paired comparisons. P ≤ .05 was accepted as significant.
In order to investigate the longitudinal changes of neuroanatomical volume and number of tracts, the data were fitted to a mixed linear models for repeated measures. All patients and their individual scan time points were included in this analysis. Three different models were set up: in model 1, each patient’s successive measurements over time are defined by an individual change trajectory plus random error, and used to assess whether time since injury is significant in explaining the changes in the neuroanatomical volume and number of tracts; in model 2, the linear rate of change is allowed to vary across individuals, which can be used to assess differences in the longitudinal trajectories; and finally, in model 3, patients are split into 2 groups (median split on Glasgow Coma Scale [GCS] score), and the differences in trajectories between groups is examined.
All 3 models were set up following the guidance of Heck et al 28 for the analysis of individual changes with repeated-measures data.

where Yti represents the independent variable being investigated (neuroanatomical volume for a given structure or number of tracts), i represents each individual, t the successive measurements and ati is the time since injury for subject i and scan point t; u0i (representing the mean change across all time points for patient i), β00 and β10 are parameters to be fitted by the model and εti is the error which cannot be explained by the model.

In this model, the intercept and linear components are assumed to be randomly varying across individuals, and u1i is a new parameter to be fitted.
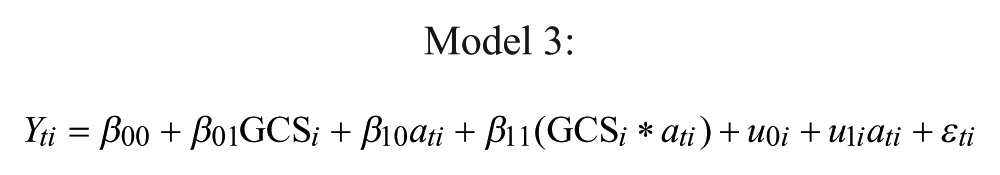
where GCS i indicates to which group (high or low GCS) patient i was included in after median split.
Mixed linear models can easily be fitted when more than 100 data points are available. 28 Since only 52 data points are available in this study, we also built a simpler general linear model (GLM). A GLM model has the disadvantage of assuming the successive measurements for the same subject are independent, but due to its simplicity we can be assured convergence will be achieved with only 52 data points.
Since we are not interested in generalizing the results for a wider population of TBI patients, the different patients were modelled as a fixed factor and the time since injury was included as a covariate. The interaction between patients and time since injury was also considered.
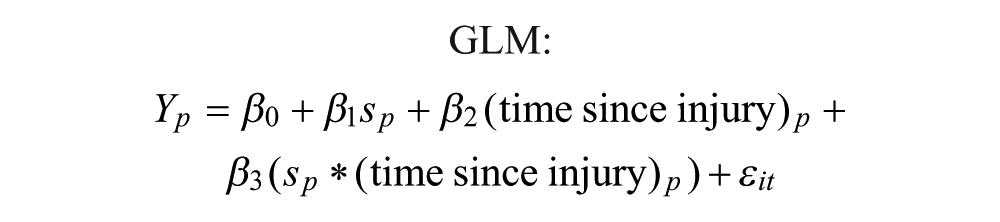
where p represents each data point and sp represents the patient associated with data point p.
Results
The patients’ median (range) admission GCS score was 5 (3-11) and Glasgow Outcome Score was 4 (3-5) (Table 1). The median time since injury for scan one was 33 hours (range 16-190 hours), scan two 165 hours (68-395 hours), scan three 40 days (range 29-86 days), scan four 225 days (range 147-534 days), and scan five 651 days (range 358-1015 days).
At the time of first neurocognitive testing (scan four) performance on spatial working memory was no different from controls (Table 2). In contrast, significant differences were found in all or some components of reaction time, rapid visual information processing, pattern recognition, spatial recognition, PAL, and spatial span. Between the 2 neurocognitive testing sessions, for the group as a whole, there were significant improvements in reaction time, rapid visual information processing A′, spatial recognition, and PAL.
Structural Volumetric Analysis
The volumes calculated at each time point for the patients can be seen in Figure 1 for the thalamus and WBWM. The percentage change in volume over 18 months (Tables 3 and 4) for controls was significantly less than the patients (median [interquartile range]: thalamus, −0.66 [−2.01 to 1.81], P < .001; WBWM, −0.17 [−0.74 to 0.44], P < .001).
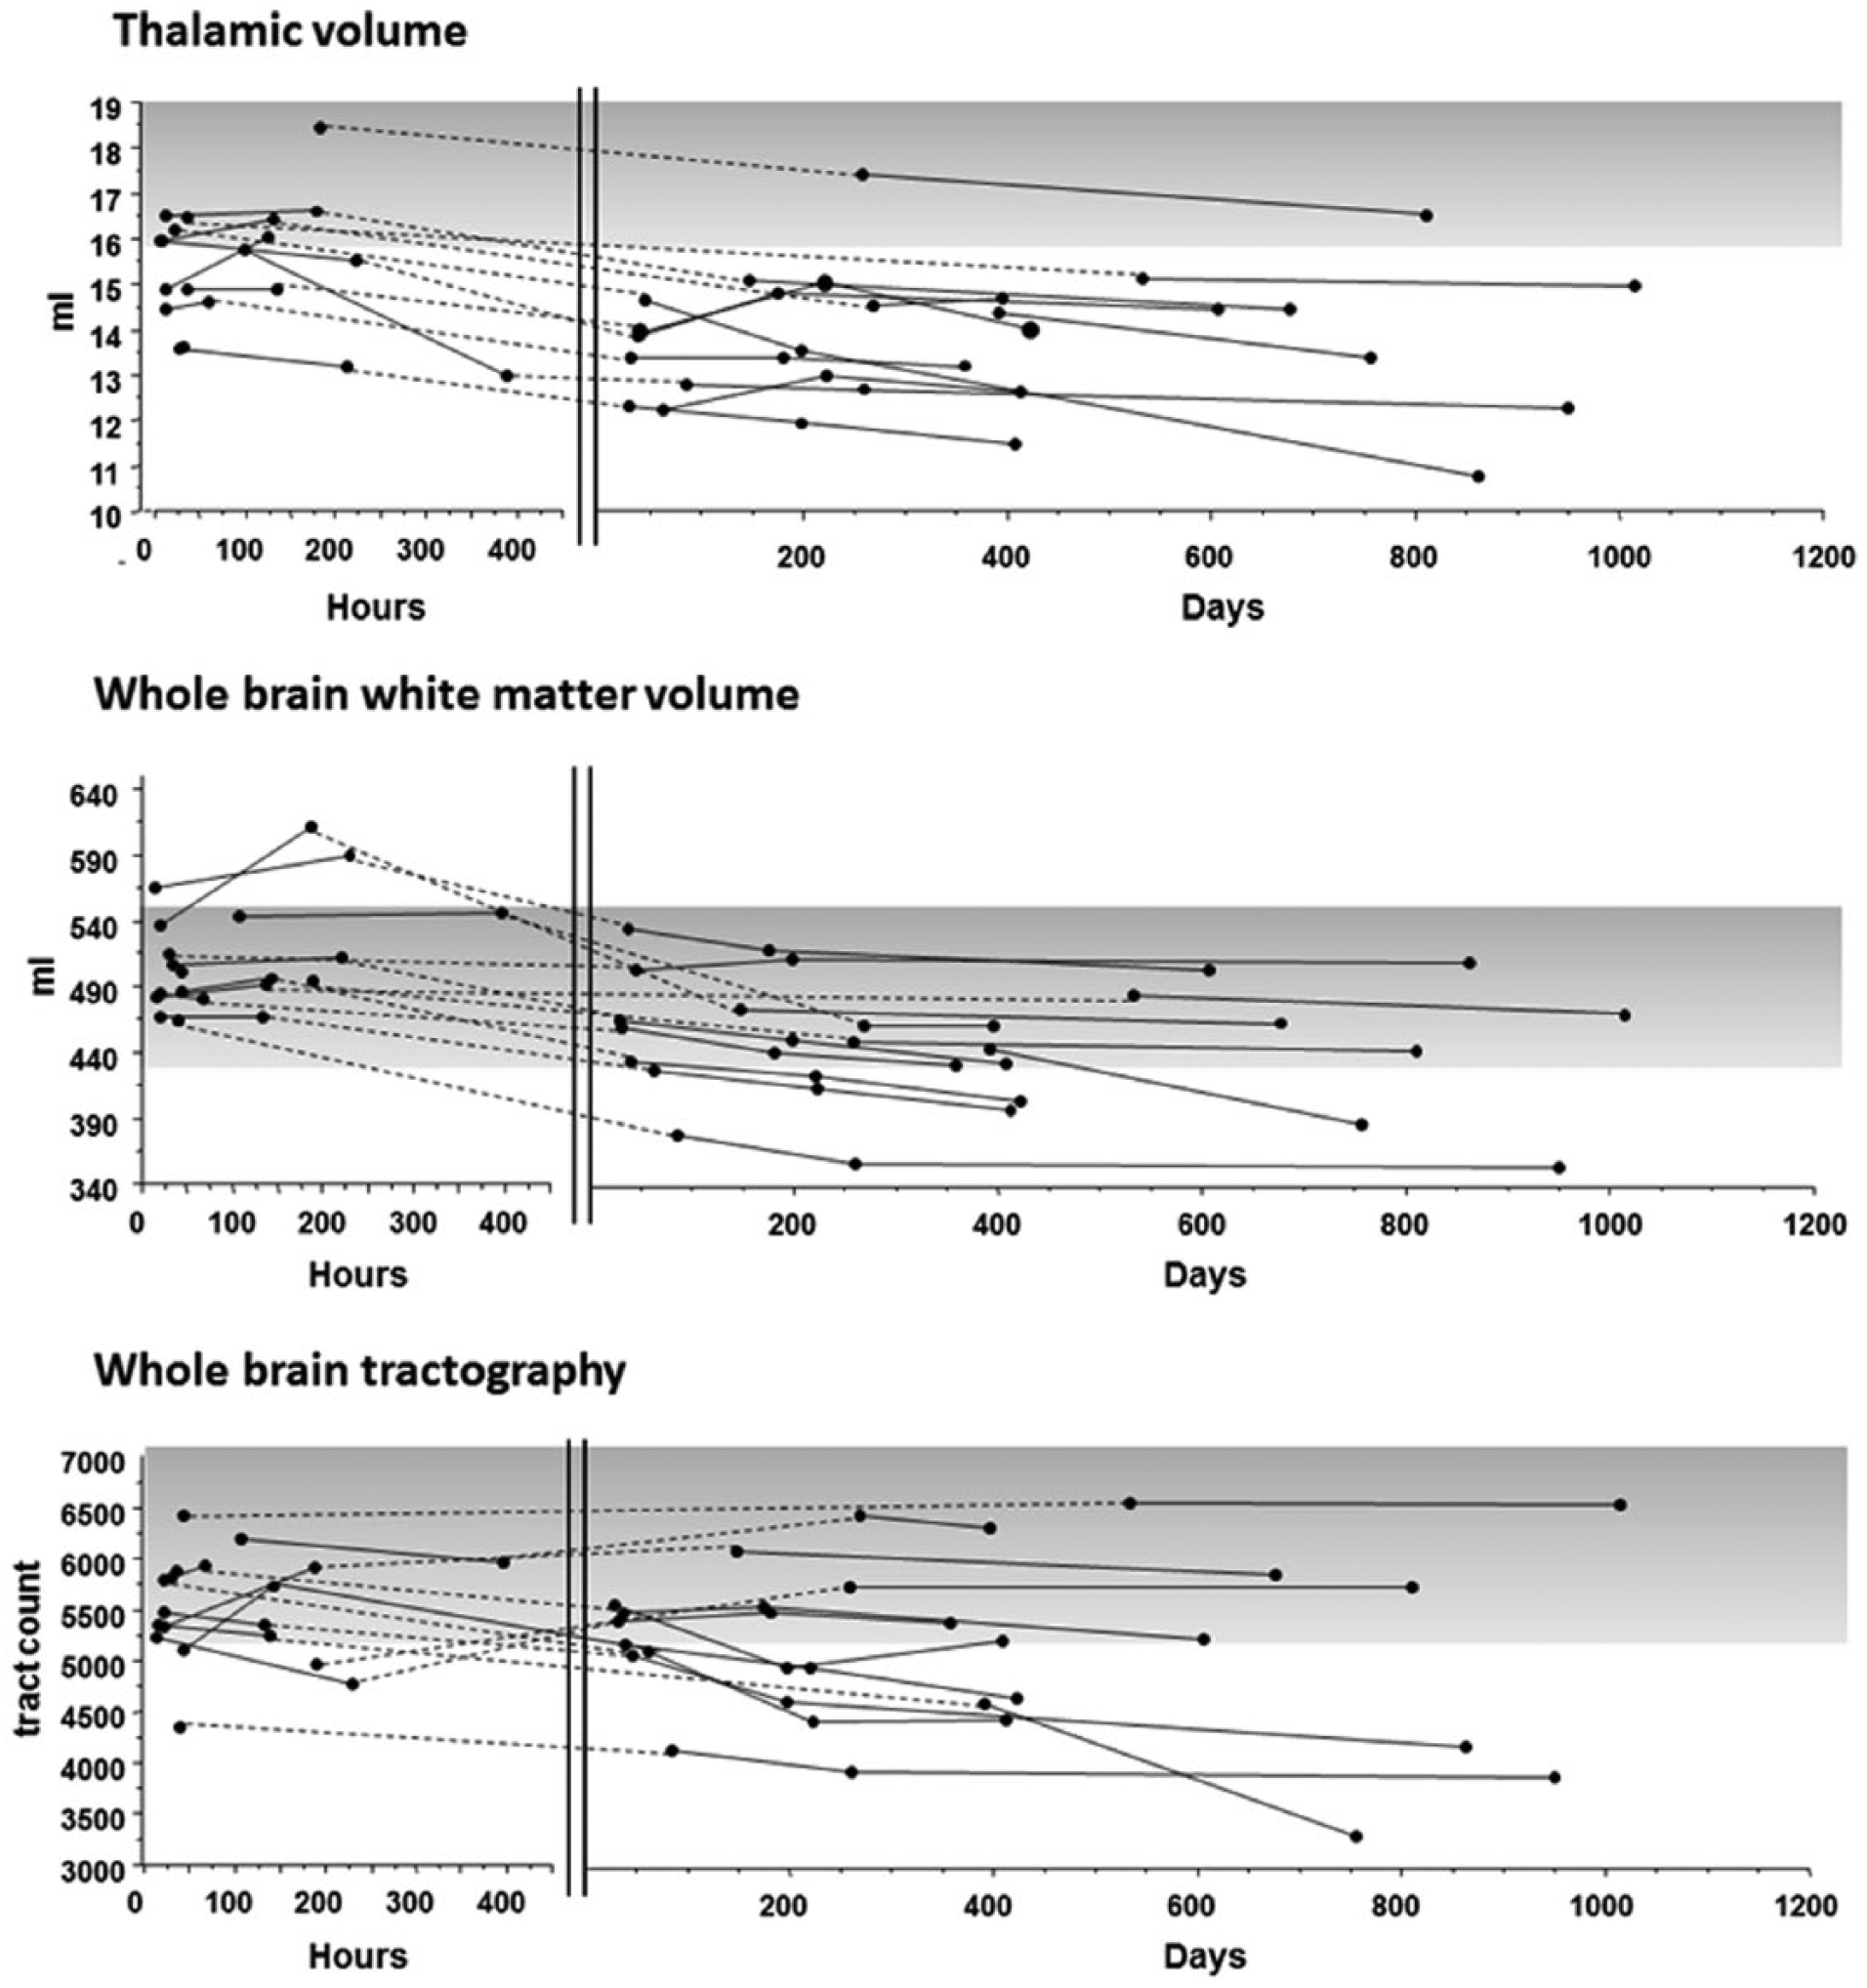
Individual patient trajectories for thalamic volume, whole brain white matter volume, and whole brain tractography in control subjects and patients after severe traumatic brain injury longitudinally. Dashed lines have been superimposed on the figure to show continuity of subjects between the acute phase (shown in hours) and the more chronic phases of recovery (shown in days). The shaded areas indicate the range for controls.
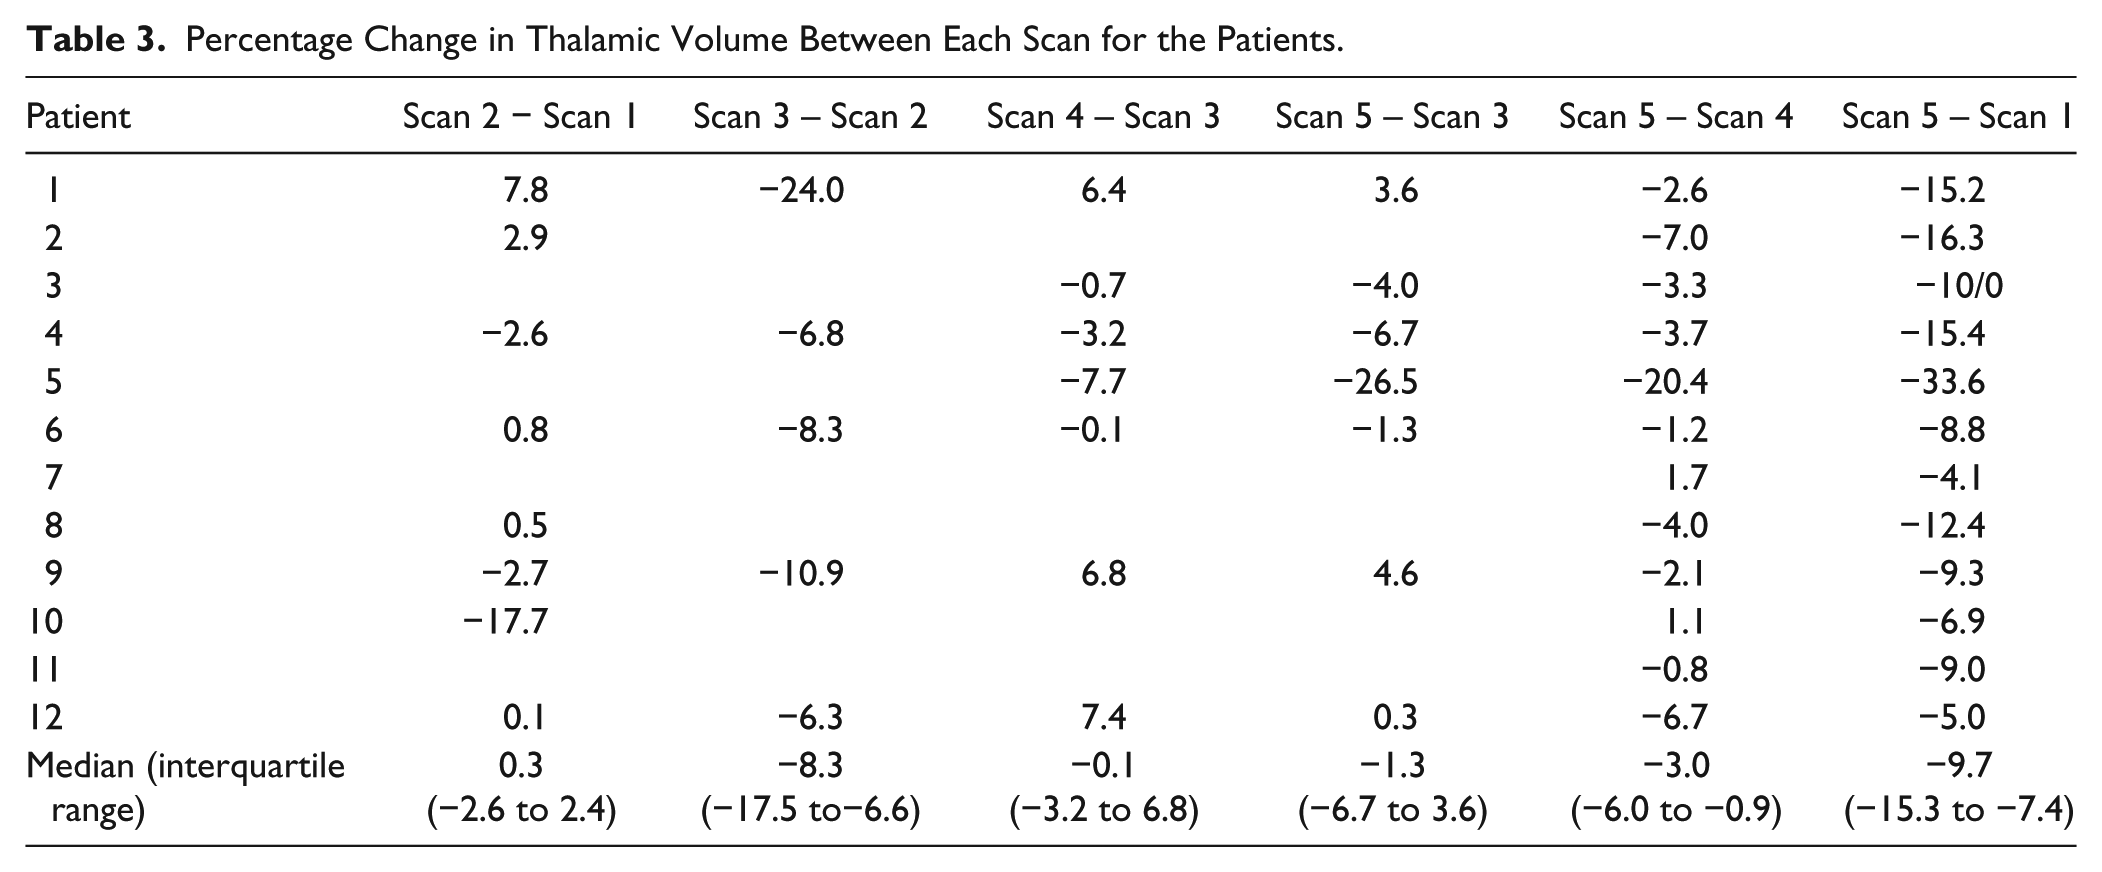
Percentage Change in Thalamic Volume Between Each Scan for the Patients.
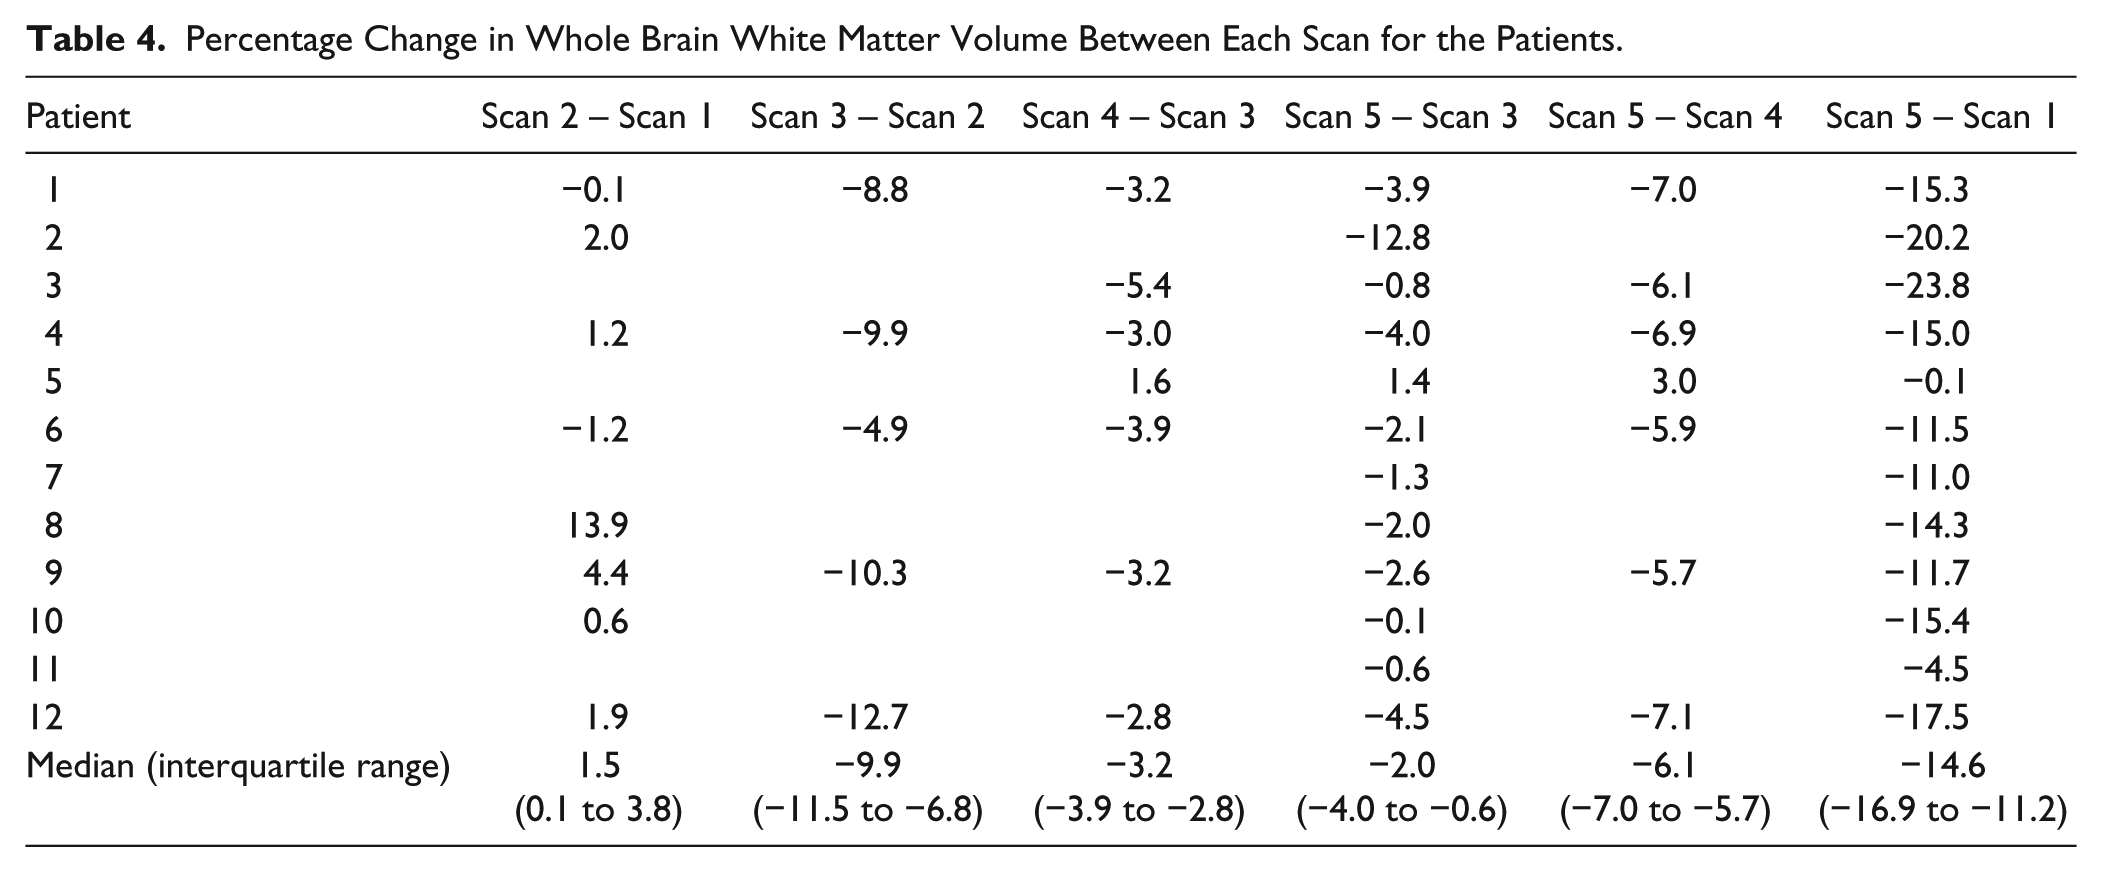
Percentage Change in Whole Brain White Matter Volume Between Each Scan for the Patients.
Model 1 found a negative correlation with time since injury for the thalamus (P = .002), and a positive correlation with the volume of the third and fourth (P < .001) and the lateral (P < .001) ventricles, consistent with atrophy over time. These results were also observed using the GLM approach. Model 1 did not converge for WBWM and whole brain volume, but the GLM model found a negative correlation with time since injury for both (P < .001 for both).
Model 2 converged only for the thalamus. The estimate of variance for the random linear slope across individuals for this structure was nonsignificant (P = .294), which suggests no difference between individual trajectories of change.
Model 3 did not converge for any of the structures analyzed, and therefore it was not possible to assess whether high or low GCS could explain the variability in the random parameters across individuals.
Diffusion Tensor Imaging Analysis
Head Motion Results
The average relative head displacement between volumes was as follows: controls = 0.50 mm, patients scan 1 = 0.64 mm, scan 2 = 0.61 mm, scan 3 = 0.60 mm, scan 4 = 0.53 mm, and scan 5 = 0.52 mm. There was a significant difference between controls and the first acute scan for the patients (P = .026) but not difference for subsequent time points (P = .09, .08, .40, .56). There was no significant correlation between mean displacement and time since injury for the patients (P = .074). The mean displacement was only greater than half the voxel size (1 mm) for one patient and time point, and in that case the mean displacement was 1.02 mm.
Tractography Analysis
Qualitative inspection of the streamline tractography images showed WM loss in all patients with TBI, which was widespread not only in the supratentorial compartment but also involved the cerebellum and brainstem (Figure 2). The temporal progression of these changes varied between patients, with some patients showing gradual recovery of WM tracts following acute injury, whereas others showed a progressive loss of WM. Quantitative assessment of fiber counts in individual patients was performed with mixed models 1 and 2, as well as the GLM described in the Methods section. Model 1 found no significant negative relationship between time since injury and the number of tracts (P = .095). The estimate of variance for the random linear slope across individuals in model 2 was also nonsignificant (P = .109), which suggests no difference between individual trajectories. Model 3 did not converge, so no link with GCS could be established. The GLM analysis, however, found that both time since injury (F = 12.68, P = .002) and the interaction between subject and time since injury (F = 4.20, P = .002) was significant, consistent with different patient trajectories.
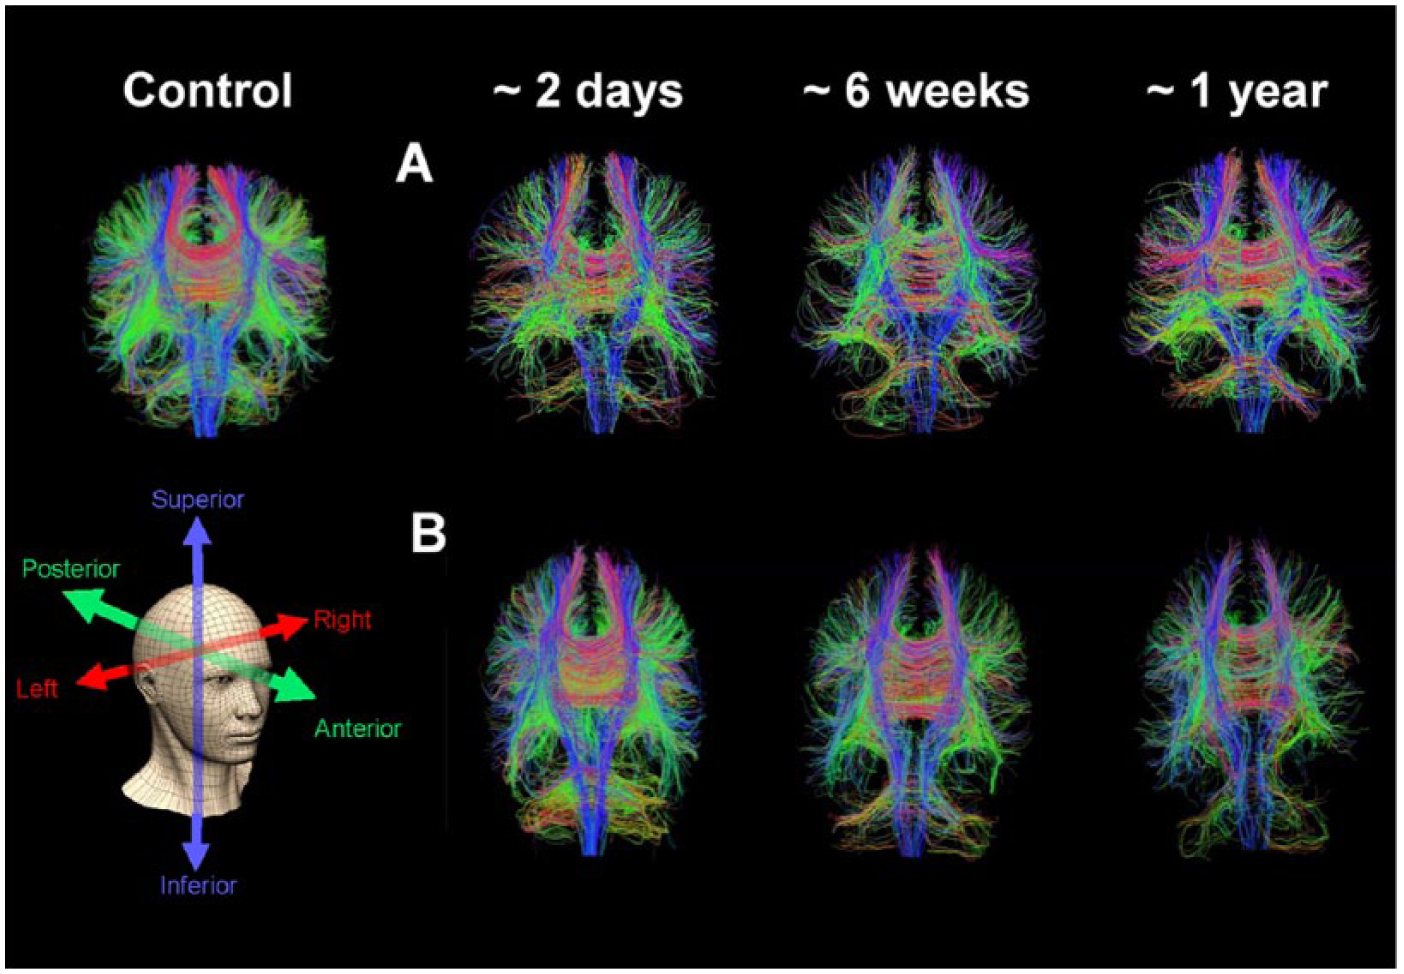
Whole brain diffusion tensor tractography in an age-matched control subject and two patients with serial images at approximately two days, six weeks, and one year following severe traumatic brain injury. The series of images for the first patient shows gradual temporal recovery of white matter integrity in traumatic brain injury, with continuing incremental change between weeks and months post-traumatic brain injury. In the second patient such recovery does not occur; in contrast, there appears to be continuing and progressive white matter loss weeks to months post-injury. Tracts that run superiorly/inferiorly are blue, anterior/posterior green and left/right red.
Region of Interest Analysis
In the 8 controls scanned over time, FA and MD in both the CC and thalamic ROIs showed no significant change. In a group analysis comparing all patients with the larger control group, FA in the CC was significantly lower in patients than in controls at second acute (scan 2), subacute (scan 3), and first chronic scan (scan 4) (P < .05, Mann-Whitney U) (Figure 3, Table 2). An inspection of temporal patterns showed that FA appeared to continue to decrease from the first scan to a nadir at scan 4 (first chronic scan). The CC FA in patient regions of interest was not significantly different from the control group at the second chronic scan (scan 5). The MD in the CC was significantly lower than control values in the first scan after injury, but increased to control or supracontrol levels at subsequent time points. The changes in FA and MD were driven by a decrease in the axial and radial diffusivities at the most acute time point. For all subsequent time points FA reduction was driven by increases in the axial and disproportionately larger increases in radial diffusivities. In contrast the thalamic region of interest showed a transient significant increase in FA and decrease in MD in the first acute scan (Figure 3, Table 2), but subsequently showed reduced FA and increased MD by scan 5.
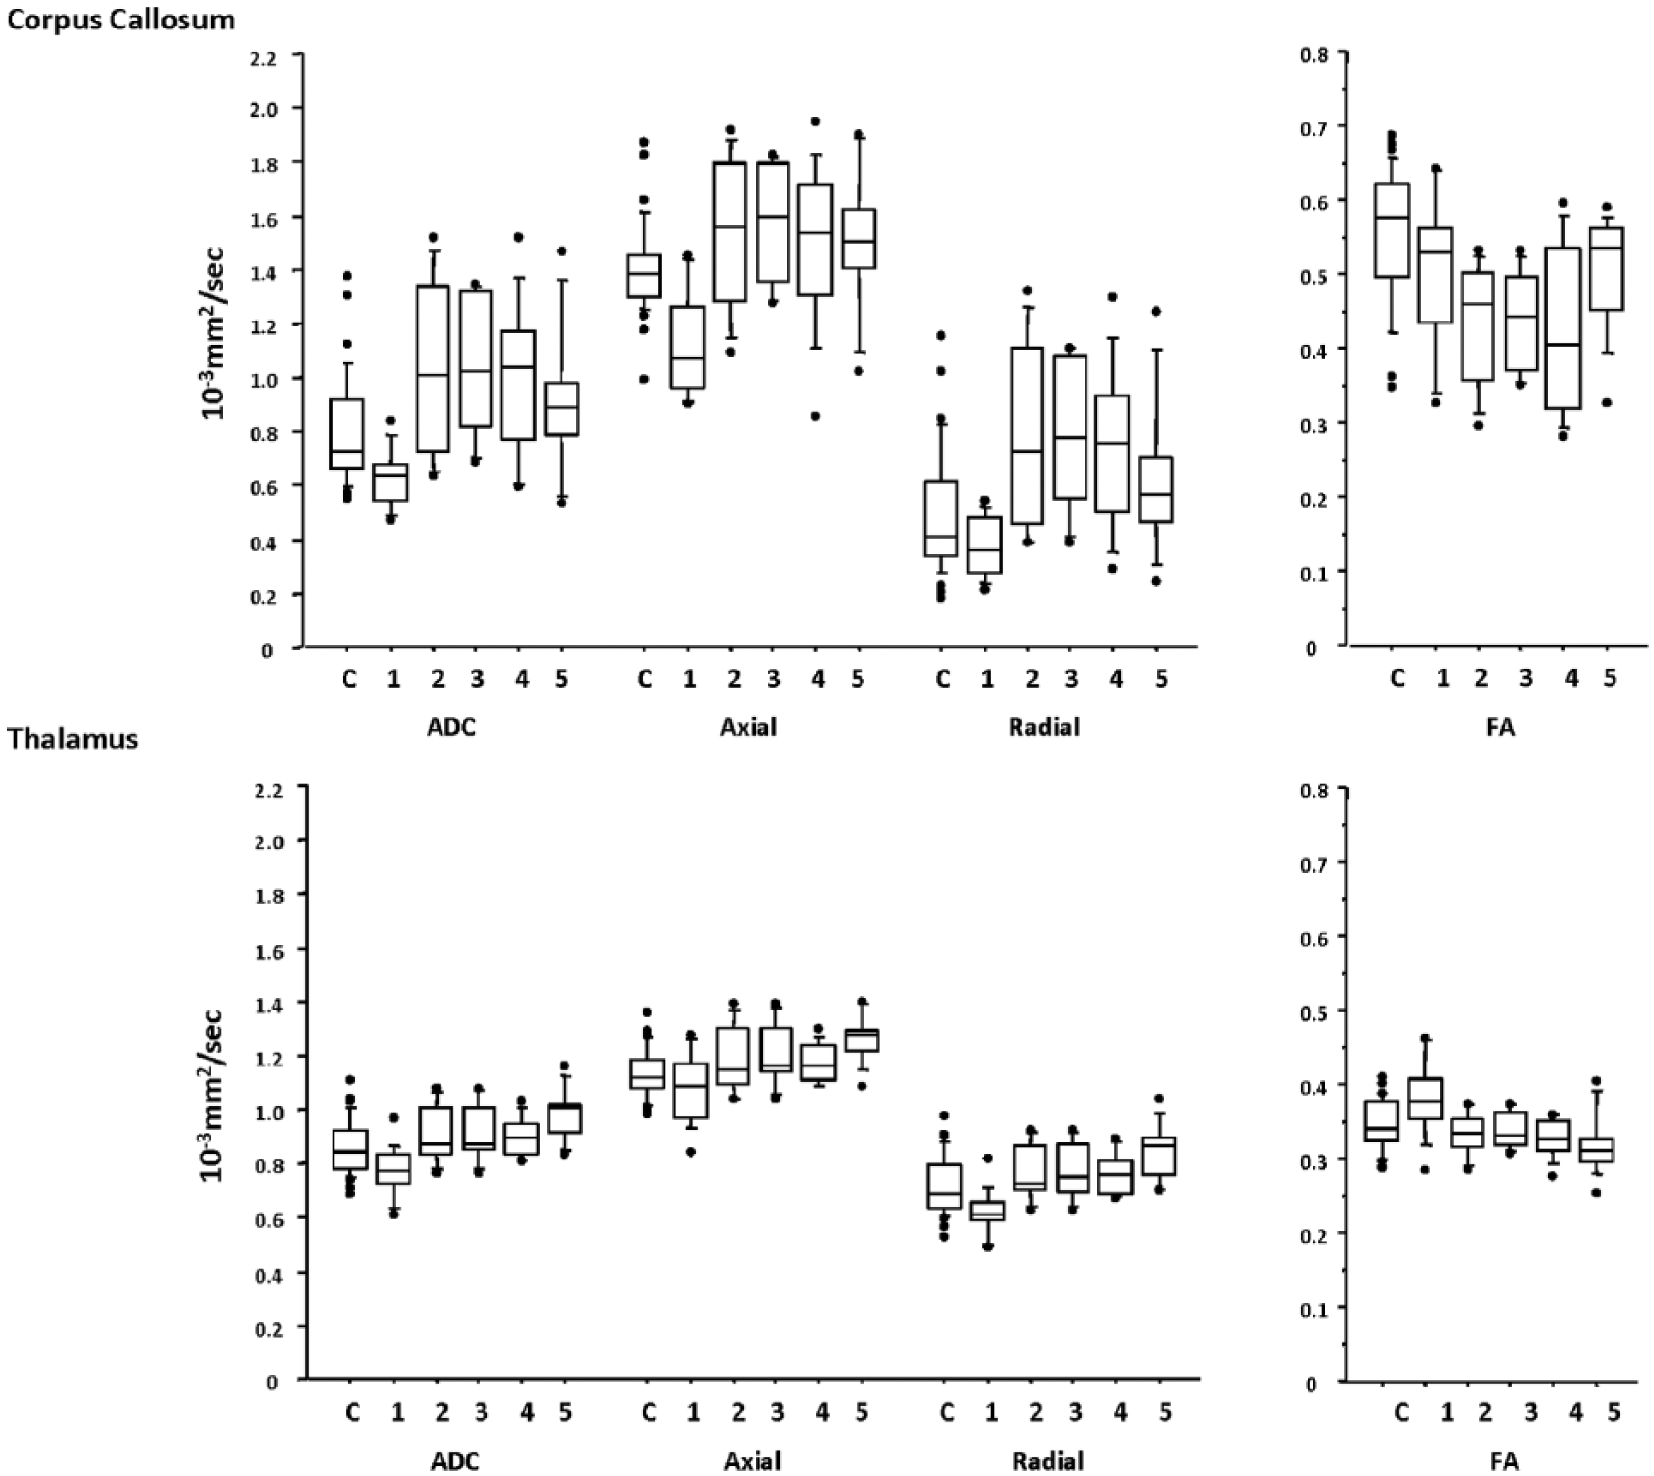
Trends over time for fractional anisotropy (FA), mean diffusivity (MD), axial diffusivity, and radial diffusivity for the anterior corpus callosum (top) and thalamic (bottom) regions of interest. The central lines in the boxes denote the median values, the upper and lower edges denote the 75th and 25th percentiles, the error bars denote the 90th and 10th percentiles, and closed circles denote the data outside these percentiles.
Voxel-Based Diffusion Tensor Analysis
The FA factorial analysis of DTI images over time in the control and patient groups revealed a group by time interaction. Regions which showed significant changes over time in the TBI cohort on serial FA maps included the anterior and posterior CC, the parasagittal WM, and frontal and posterior WM (Figure 4). Significant changes on MD maps in the TBI cohort included the thalamus and gray-white matter junctions. Changes in FA and MD over serial images were driven by alterations in both axial and radial diffusivity.
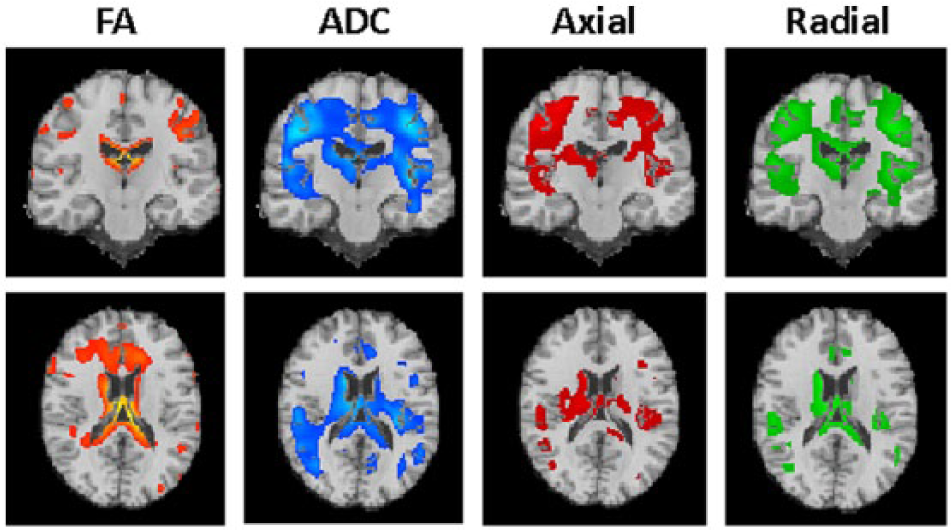
Changes over time in fractional anisotropy (FA), mean diffusivity (MD), axial diffusivity, and radial diffusivity. FA changes (orange) are mainly confined to the white matter, including the anterior and posterior corpus callosum, the parasagittal white mater, and frontal and posterior white matter. MD changes (blue) occur mainly in the gray matter, including the thalamus and gray-white matter junctions. Axial diffusion (red) and radial diffusion (green) follow a similar pattern to the MD. For all voxel-based diffusion tensor analyses, correction for multiple comparisons was based on the family-wise error rate (P < .05).
Neuropsychological Correlations With DTI
Contemporaneous measures of cognitive and motor performance were available for time points 4 and 5. Significant correlations were found between change in reaction time with change in FA in the anterior and posterior WM, anterior CC, and the anterior limb of the internal capsule (Figure 5A). Improvements in reaction time were associated with an increase in FA in these regions. In contrast, a reduction in thalamic MD on serial assessment was associated with improvements in reaction time. These correlations were most prominent in the ventral tegmentum and anterior cingulate cortex (Figure 5A). There were no significant associations showing a positive correlation with FA or negative correlation with MD. The correlation for the change for regions identified in Figure 5A versus change in reaction time were as follows: FA (r = −0.601, P = .039) and MD (r = 0.790, P = .002).
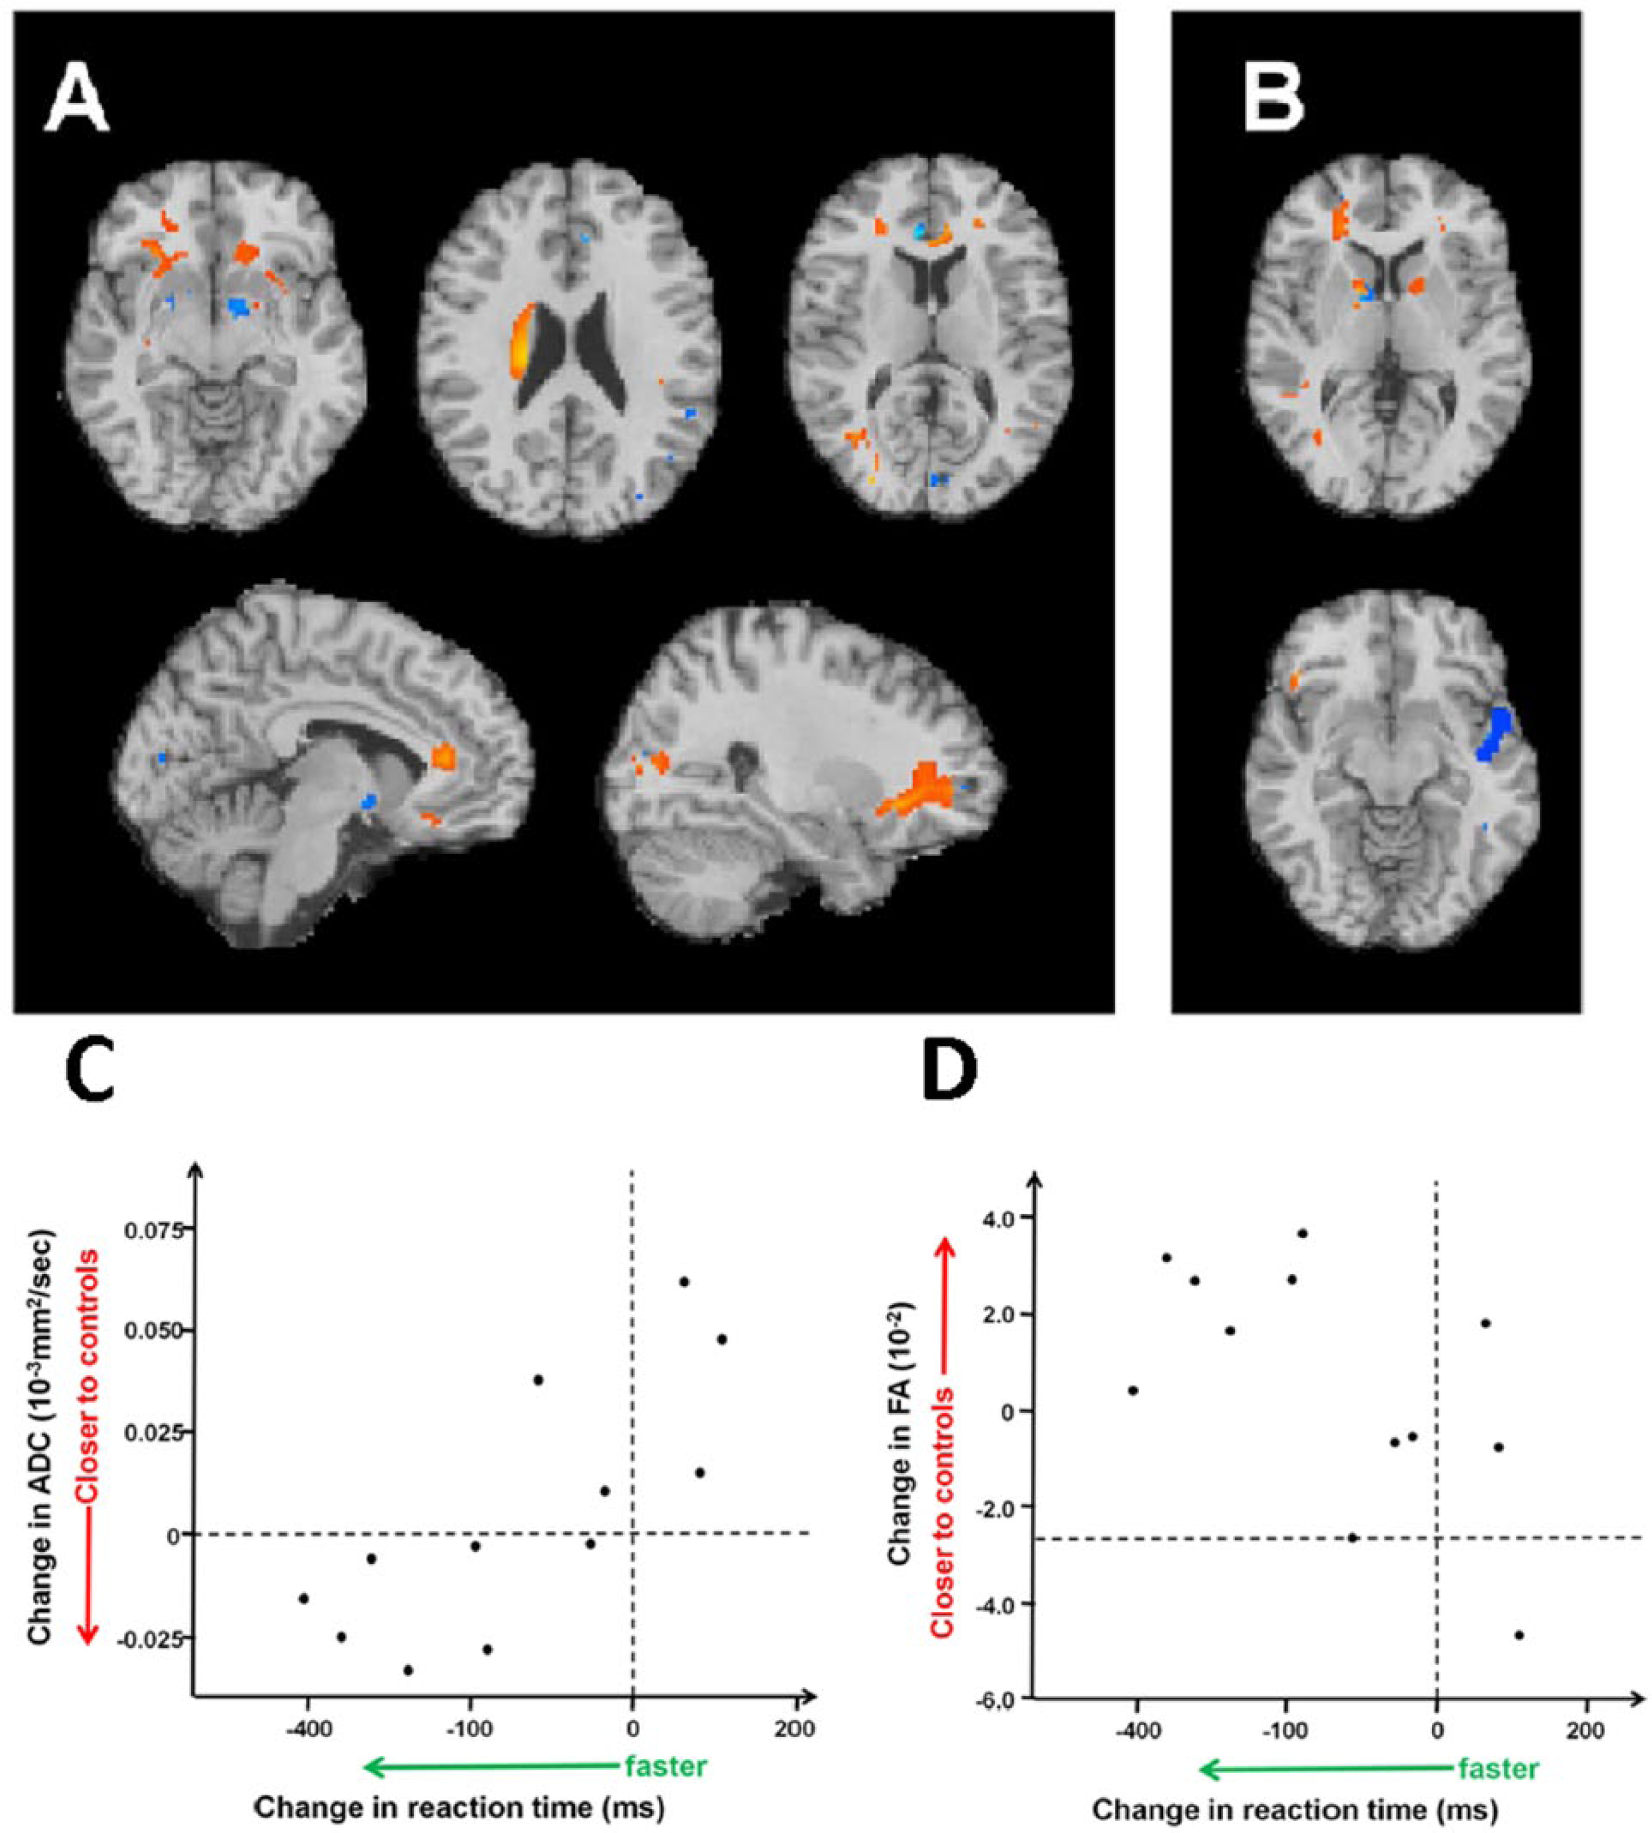
Change in cognitive function is significantly correlated with change in cerebral microstructure in patients over the early chronic phase of traumatic brain injury. Panel A shows the association of diffusion imaging parameters with reaction time. Negative correlation with fractional anisotropy (FA) is shown in orange/yellow indicating a faster reaction time with an increase in FA. Positive correlation with the mean diffusivity (MD) is shown in blue indicating a faster reaction time with a decrease in MD. There were no significant association with a positive correlation with FA or negative correlation with MD. Panel B shows how performance on the paired associates learning task correlated with FA in the white matter (orange/yellow) and MD in the gray matter (blue). Only a negative correlation was found with FA indicating more errors were associated with lower FA in the left parasagittal white matter, anterior limb/genu of the internal capsule (bilateral) and frontal white matter (left > right). For MD only a positive correlation was found concentrated in the right insula. Panels C and D show scatterplots of change in diffusion imaging parameters for significant brain regions in Panel A with change in reaction time (Spearman’s ρ; graph C, MD [r = 0.790, P = .002]; graph D, FA [r = −0.601, P = .039]). In patients where the imaging parameters moved closer to those of controls their reaction time tended to improve, with the converse for those whose imaging parameters worsened.
Figure 5B shows the association between changes in performance on PAL (measured as errors at six boxes) with serial changes in FA and MD. Decrements in PAL performance correlated with reductions in FA in the anterior limb of the internal capsule (bilaterally) and the frontal WM, predominantly on the right (r = −0.814, P < .014 for the composite ROI). Decrements in PAL performance correlated with increases in MD, predominantly in the right insula (r = 0.898, P < .002).
While most patients showed improvements (defined as moving toward control values) in DTI metrics between these 2 late time points (increases in FA and reductions in MD), some patients showed continued deterioration (further reductions in FA and increases in MD, when compared with control values). Critically, for both tasks that we analyzed, improvement in DTI metrics toward control values was associated with improvements in performance, and deterioration in DTI metrics further away from control values was associated with worsening in performance. Importantly, these correlations showed a clear double disassociation—they were only restricted to regions expected to be involved in the functional neuroanatomy of the cognate tasks.
Discussion
In this study changes in structural volumes, FA and MD were observed continued for months to years postictus. Changes in diffusion tensor imaging were driven by alterations in both axial and radial diffusivity, and were associated with changes in reaction time and performance in a visual memory and learning task (paired associates learning).
This study therefore provides compelling evidence of dynamic changes after moderate to severe TBI, which continue into the subacute and chronic phases after TBI. We believe that our study is the first to provide data at multiple time points, ranging over the entire disease narrative, ranging from the hyperacute phase through to chronic follow-up. Critically, we also show that these changes in structure may relate to changes in function.
The exact time course, relative importance and trajectory of each pathophysiological process after TBI is still open to great debate. Indeed, given the heterogeneity seen in TBI, there are likely to be different interindividual differences between patients and within the patients at different time points. In addition, multiple mechanisms may underlie the imaging changes observed, further complicating the assessment and interpretation of findings. Given this background, it is critical to specify a temporal context for imaging changes, since the same imaging finding may have very different meaning and significance at different points, and even at the same time point but different location (eg, in GM and WM). 34
Both the initial injury and second insults (such as hypoxia, hypotension, and raised intracranial pressure) trigger a complex array of microscopic and microstructural changes, including cytotoxic oedema, astrocyte swelling, microglial activation, and vasogenic edema. 35 Animal studies indicate that diffusivity parameters change rapidly in the first hours to days after injury, 36 a finding replicated in the changes between our earliest scan (median 33 hours) and the second scan (median 165 hours) (Figure 4). Animal studies implicate early cytotoxic edema as a driver for these rapid changes, which include a transient early increase in FA in GM regions 37 (as seen in our thalamic ROI). This is consistent with early human ischemic stroke where a transient increase in FA has been found in the first 4.5 hours after ischemic stroke. 38 The disproportionate increase found in radial diffusivity in the second acute scan leading to an increase in MD and reduction in FA is consistent with worsening (likely) vasogenic edema. The rapidity of such changes underlines the need to precisely account for time after injury in group analyses in imaging studies of TBI. By 4 weeks after injury, many of the acute processes, including edema, are likely to have largely resolved, even in those patients with raised intracranial pressure in the acute phase.
Changes in diffusivity parameters in chronic TBI have been shown to correlate with outcome at specific time points. 39 However, changes occurring in the later stages of TBI are likely to be the result of a complex interplay of many processes. Wallerian degeneration and demyelination, can occur (for example) in thalamic projection fibers, 40 and progress for several months. 41 Neuronal loss, particularly in the frontal cortex (shown with histopathology) 42 and thalamus (as illustrated using 11C-flumazenil positron emission tomography) 43 correlate with outcome. TBI also appears to trigger a long-term inflammatory response, with microglial activation in areas remote to the original site of injury. 24 Histopathological evidence of gliosis has been associated with an increase in FA in the GM and decrease in the WM in a rat model. 44 Finally, both adaptive and maladaptive plasticity may also occur, and studies in status epilepticus suggest that FA increases in the dentate gyrus of the rat hippocampus may be the imaging correlate of an increase in density of myelinated fibers and mossy fiber sprouting. 45
In clinical studies, maximal behavioral recovery occurs in the early months after injury with a plateau at 6 to 18 months. Longer term studies suggest that patients continue to evolve for years after injury. Whitnall et al 29 reported that when survivors were assessed 5 to 7 years after injury, 29% had improved and 25% deteriorated when compared to assessments performed 1 year after injury. The fact that patients may improve, stay the same, get progressively worse, or decline after many years of stability indicate a complex interplay of factors, and it is likely that adaptive and maladaptive processed are occurring in parallel. The pattern and heterogeneity of dynamic changes in our study is consistent with the clinical patterns of recovery reported by Whitnall et al. 29
Our data replicate the large decreases in brain volume reported in earlier studies (8.4% at 2 months and a further 4% by a year), 46 which far exceed that seen in healthy controls (who show no loss between 18 and 35, and annual brain volume losses of 0.5% after age 60 years). 47 However, the ability to trace trajectories of regional volume change from the initial phase of acute edema offers additional insights, by demonstrating different regional vulnerabilities and trajectories of atrophy in response to injury.
Whole brain tractography has the advantage of requiring no a priori selection of specific tracts, and so may provide a picture of the overall burden of WM loss, and by implication, of connectivity in the injured brain. However, it is important to note that the path counts from such analyses are not a true reflection of the actual fiber number but instead represent a measure of the relative anatomical integrity of fibers. The decrease in paths counted may reflect microstructural changes in the cortex, including the loss of fibers or demyelination, either of which could lead to consequent axonal and tract dysfunction and cognitive sequelae. Future studies with higher angular resolution data could further subdivide tracts to see whether particular pathways have a predilection for damage after TBI and correlate with functional status.
Diffusion tensor imaging has been used in cross-sectional analyses to study neurocognitive function in TBI with varying success, and performance in specific cognitive areas (executive function, memory, and attention), 6 evoked motor responses, 48 and decision making 39 have been shown to correlate with the burden of WM injury in select areas. Farbota et al 11 were able to show that changes in DTI metrics were related to performance on serial neuropsychological measures but were unable to isolate such coordinated change in imaging and behavioral measures to the first or second imaging intervals. Furthermore, their analysis was limited to the supratentorial WM, and could simply reflect the overall severity of traumatic axonal injury, rather than representing specific neuroanatomical substrates for cognate cognitive deficits. It is also not possible from their analyses to determine whether the relationship between DTI and behavioral change was bidirectional (ie, showing concordance for both improvement and deterioration). Our data suggest that DTI might provide a biomarker of both recovery and progression of pathophysiology. The specificity of the correlations between individual behavioral metrics and their cognate neuroanatomical substrates raise the possibility that we may be able to use these approaches to selectively address neuroanatomical change relevant to target cognitive processes. We recognized that inclusion of acute imaging data in correlational analyses may have provided an artifactual confound due to inappropriate dependence on the acute data, where edema was a prominent pathophysiological process. Consequently, the correlations that we present between behavior and imaging only reflect imaging data obtained at late points at which such behavioral assessment was possible, and make no use of data obtained at early time points.
The PAL is sensitive to mild cognitive impairment in TBI. 25 Previous work by our group correlated increased errors on this task with increased diffusivity in neural areas known to be important in this task, including the hippocampal formation, frontal and temporal cortices. 26 In other studies, performance on memory tasks in patients a year after mild TBI was found to correlate with the uncinate fasciculus. 7 The cross-sectional correlations between patients in these past studies are now replicated in the temporal associations we show within patients, in the form of correlations between performance on the PAL and imaging changes in left parasagittal and left frontal WM and right insula GM (Figure 5).
Our study has clear limitations that need to be acknowledged. Some of these limitations are dictated by our clinical substrate. Imaging patients, particularly those at the severe end of the TBI spectrum, presents significant challenges. At early stages, patients may be sedated and mechanically ventilated, making scanning sessions long and complex. During the early recovery period, patients may be agitated and find it difficult to lie still in the scanner. Such challenges mean that the exact timing of scans in this study varies between patients, and in the case of the two chronic scans means there is some overlap. As a consequence, where possible, the actual scan date has been used as a variable. This was not possible for the flexible factorial model in the voxel based diffusion tensor analysis. However, longitudinal studies with larger numbers of patients, and more tightly defined time points, are required to more completely understand the temporal trajectory of TBI. Additional imaging studies with other modalities will be required to confirm some of the mechanistic inferences that we hypothesize, such as the use of [11C]flumazenil positron emission tomography for selective neuronal loss, [11C]PK11195 positron emission tomography for microglial activation, and functional magnetic resonance imaging to map the functional consequences of structural abnormalities that we demonstrate.
Conclusions
Our assessment of longitudinal changes in diffusivity parameters at multiple time points, and correlation of these changes with dynamic changes in function has allowed improved characterization of the spectrum and behavioral associations of temporal changes in TBI. These data may enhance outcome evaluation and help provide a mechanistic basis for deficits that remain unexplained by other approaches. Such knowledge of longitudinal patterns of change in patient populations is important to aid interpretation of imaging findings in individuals. Future studies with larger numbers of patients will help provide further insight into late pathophysiology, help select appropriate patients for clinical trials, and provide a framework that allows magnetic resonance imaging to be used as an imaging biomarker of therapy response.
Footnotes
Authors’ Note
The funders of the study had no role in study design, data collection and analyses, decision to publish, or preparation of the article.
Declaration of Conflicting Interests
The author(s) declared no potential conflicts of interest with respect to the research, authorship, and/or publication of this article.
Funding
The author(s) disclosed receipt of the following financial support for the research, authorship, and/or publication of this article: This work was supported by a Medical Research Council (UK) Program Grant (Acute brain injury: heterogeneity of mechanisms, therapeutic targets and outcome effects [G9439390 ID 65883]), the UK National Institute of Health Research Biomedical Research Centre at Cambridge, and the Technology Platform funding provided by the UK Department of Health. VFJN is supported by a Health Foundation/Academy of Medical Sciences Clinician Scientist Fellowship. TG was supported by the Société Française d’Anesthésie et de Réanimation (SFAR). PJAH is supported by a National Institute for Health Research Professorship. DKM is supported by an NIHR Senior Investigator Award and by an FP7 grant from the European Commission.