
Abstract
Background. Evolution of changes in intracortical excitability following stroke, particularly in the contralesional hemisphere, is being increasingly recognized in relation to maximizing the potential for functional recovery. Objective. The present study utilized a prospective longitudinal design over a 12-month period from stroke onset, to investigate the evolution of intracortical excitability involving both motor cortices and their relationship to recovery, and whether such changes were influenced by baseline stroke characteristics. Methods. Thirty-one patients with acute unilateral ischemic stroke were recruited from a tertiary hospital stroke unit. Comprehensive clinical assessments and cortical excitability were undertaken at stroke onset using a novel threshold-tracking paired-pulse transcranial magnetic stimulation technique, and repeated at 3-, 6-, and 12-month follow-up in 17 patients who completed the longitudinal assessment. Results. Shortly following stroke, short-interval intracortical inhibition (SICI) was significantly reduced in both lesioned and contralesional hemispheres that correlated with degree of recovery over the subsequent 3 months. Over the follow-up period, ipsilesional SICI remained reduced in all patient groups, while SICI over the contralesional hemisphere remained reduced only in the groups with cortical stroke or more baseline functional impairment. Conclusions. The current study has demonstrated that evolution of intracortical excitability, particularly over the contralesional hemisphere, may vary between patients with differing baseline stroke and clinical characteristics, suggesting that ongoing contralesional network recruitment may be necessary for those patients who have significant disruptions to the integrity of ipsilesional motor pathways. Results from the present series have implications for the development of neuromodulatory brain stimulation protocols to harness and thereby facilitate stroke recovery.
Introduction
Following stroke, the initial recovery process revolves around resolution of reversible pathophysiological events. However, subsequent stages of recovery largely comprise functional and structural reorganization at both a “motor systems” as well as a cellular level, forming the basis of neuroplasticity.
Functional imaging studies in stroke patients have consistently identified task-related brain overactivation during recovery, changes were often bilateral, involving multiple brain regions.1-7 Recruitment of these regions may facilitate recovery, 8 at least in the early stages. 7 However, there continues to be debate regarding the role of these widespread changes during chronic phases of recovery, particularly in the context of incomplete or poor recovery.1,2,9
Electrophysiological approaches utilizing transcranial magnetic stimulation (TMS) have also demonstrated changes in intracortical excitability in both hemispheres after stroke,10-15 reflecting changes in intrinsic cortical circuits 15 and alter-ations in GABAergic neurotransmission.16,17 However, debate continues regarding the relationship of these changes to timing and location of stroke, and more important, evolution of these changes in relation to recovery. Discrepancies between studies may in part be related to lack of longitudinal design, and heterogeneity across stroke cohorts and timing from onset.
With growing use of novel noninvasive brain stimulation (NIBS) to facilitate recovery,18-23 it seems important to clarify the nature and evolution of cortical changes, to better select patients that may benefit from such intervention, as it seems unlikely that such therapies will prove successful with “one-size-fits-all” approach. 24 Moreover, some studies have demonstrated negative impact of NIBS over the contralesional cortex, suggesting the concept of restoring interhemispheric balance between motor cortices may not apply to all patients.
As such, to better delineate changes within motor cortices, the present study utilized a novel threshold-tracking paired-pulse TMS technique to explore evolution of excitability changes in a cohort of acute stroke patients at multiple time points (within 1 week, 3 months, 6 months, 12 months). A further aim was to define changes within the contralesional hemisphere, with respect to functional improvement since the role of this hemisphere with respect to functional stroke recovery remains controversial. Analyses of subgroups by stroke location and baseline impairment underpinned the hypothesis that functionally relevant intracortical excitability changes differed in their evolution.
Methods
For Supplemental Methods, please see the online supplement.
Subjects
Thirty-one stroke patients (15 males; aged 28-86 years, mean 64.3 ± 14.3 years) diagnosed with acute unilateral ischemic stroke were studied in the acute period (mean 6 days, range 1-18 days) (Table 1). Inclusion criteria for the study were first-ever ischemic stroke with brain magnetic resonance imaging demonstrating acute infarct on diffusion weighted imaging. Exclusion criteria were (a) cognitive impairment or dysphasia sufficient to affect informed consent, (b) drugs or neurological disorders beyond stroke that may affect cortical excitability, and (c) any contraindications to TMS.
Baseline Patient Characteristics.
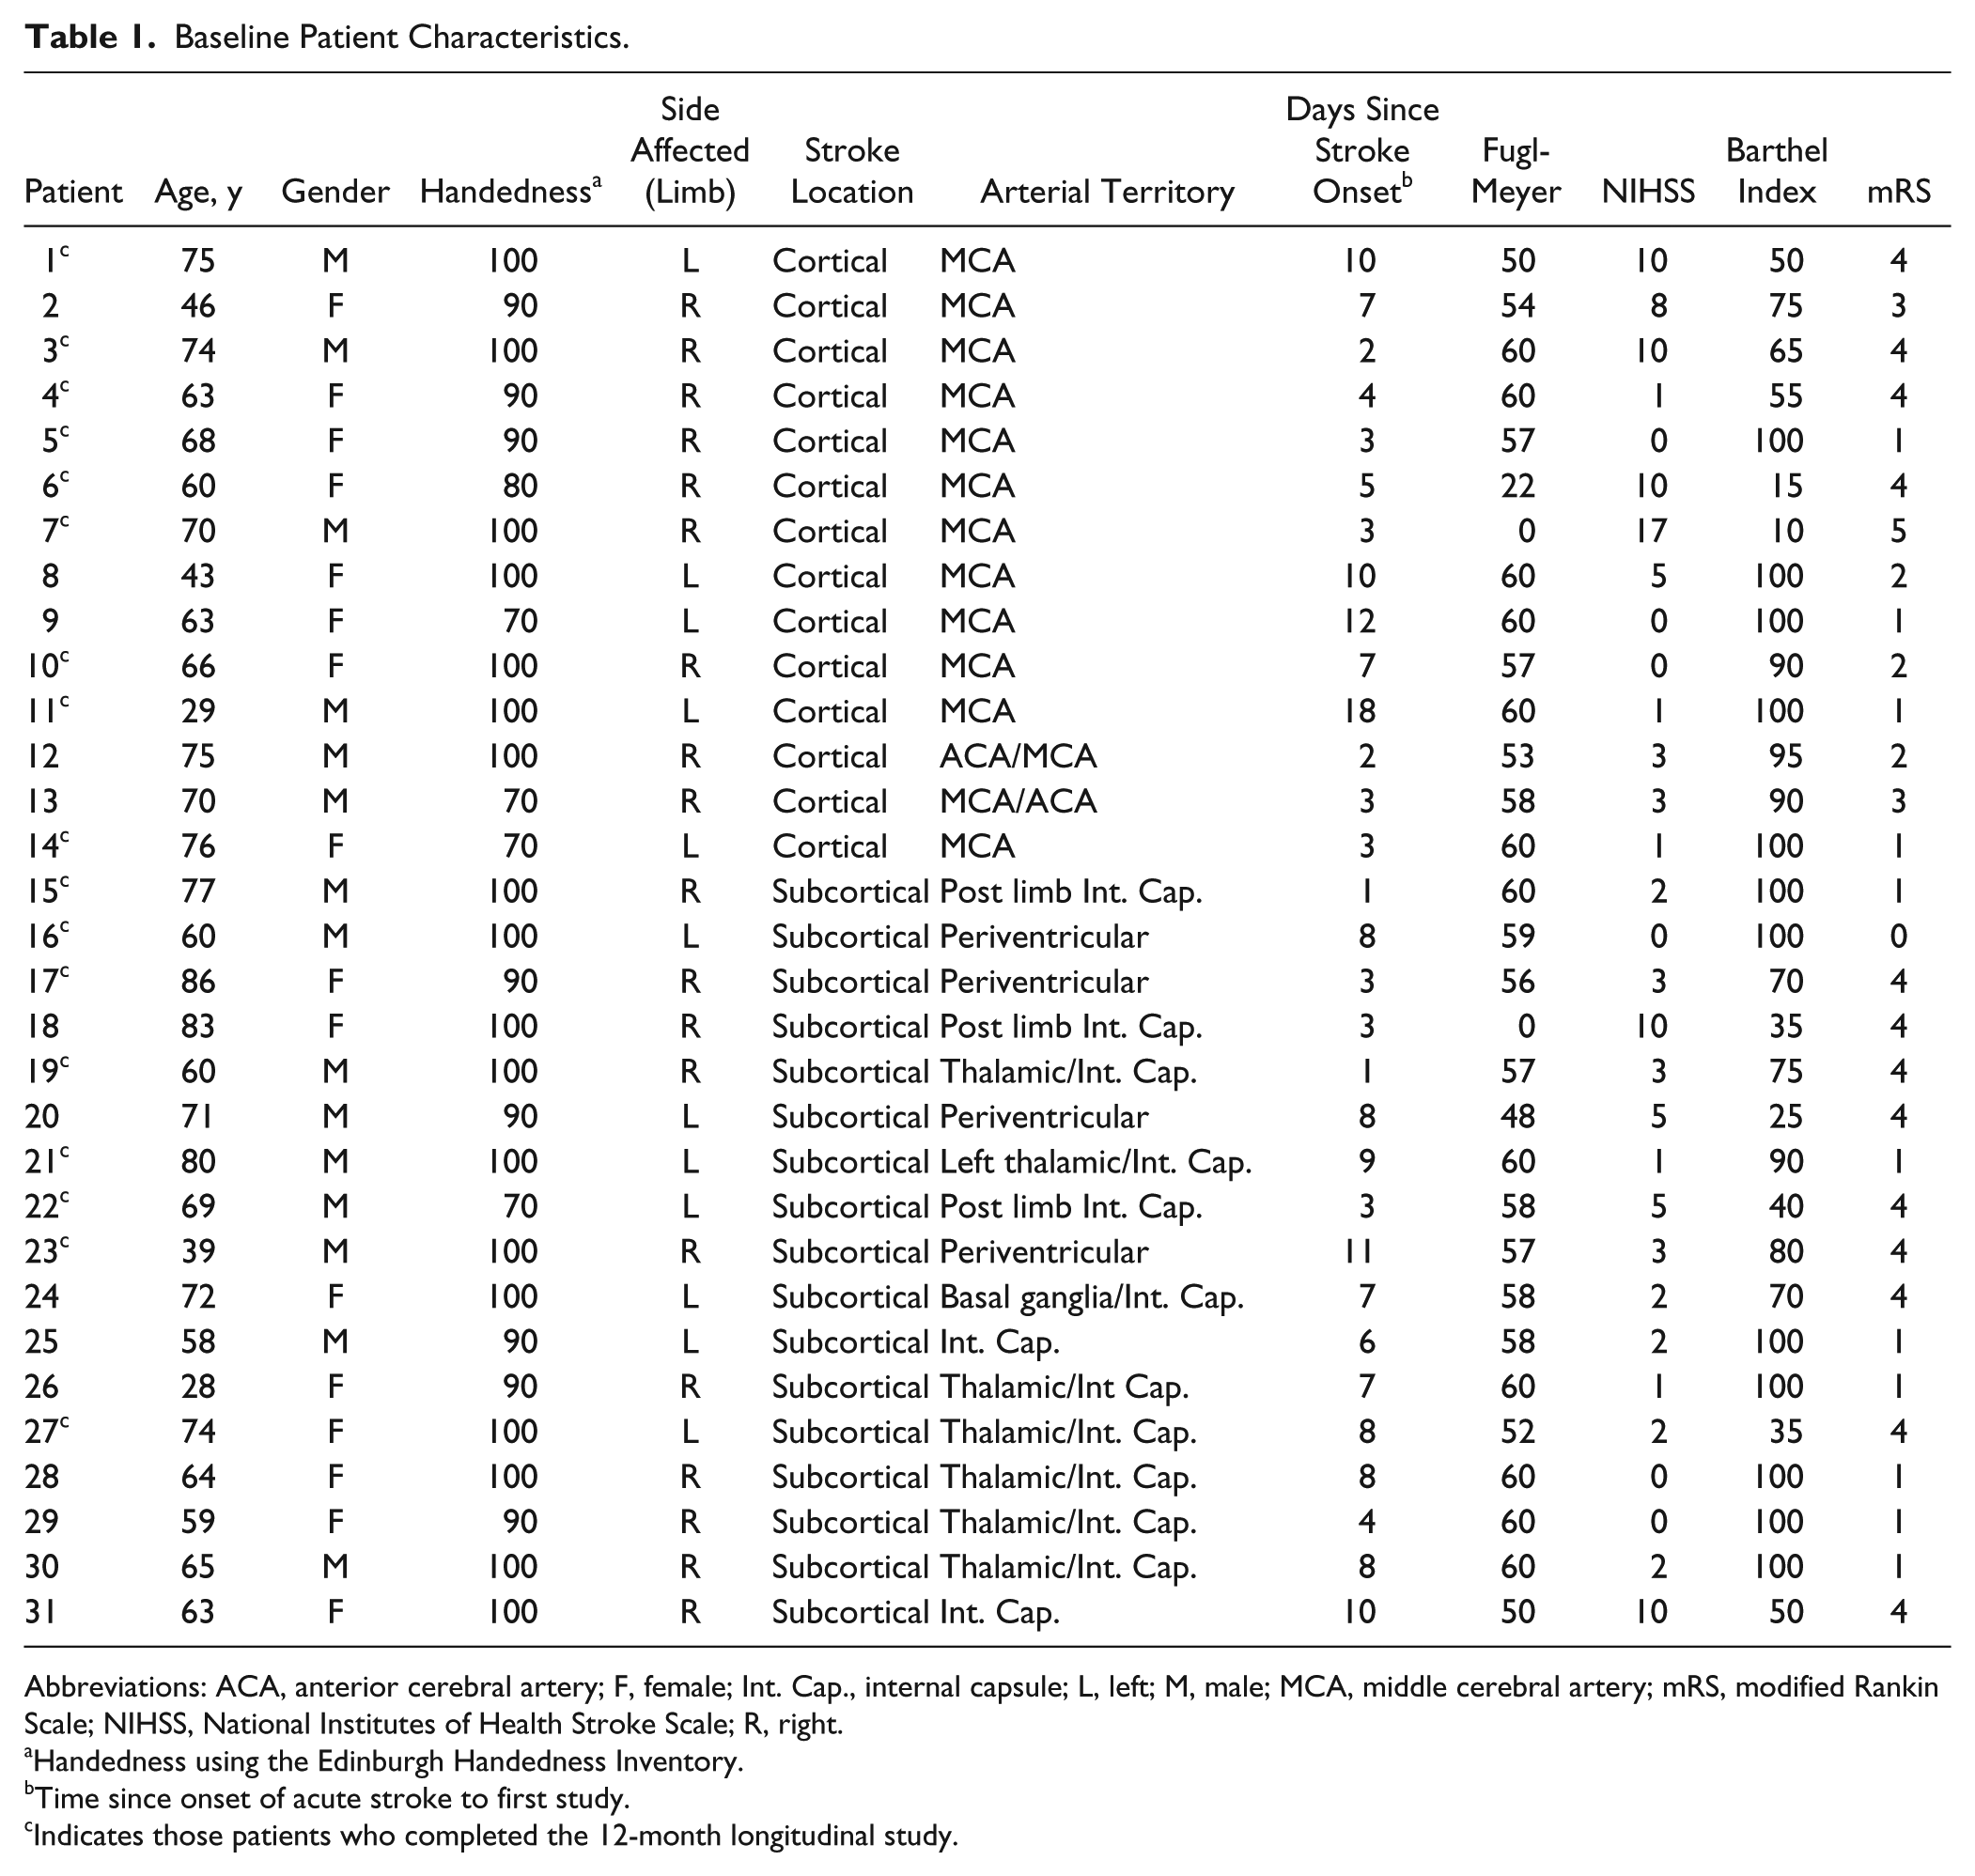
Abbreviations: ACA, anterior cerebral artery; F, female; Int. Cap., internal capsule; L, left; M, male; MCA, middle cerebral artery; mRS, modified Rankin Scale; NIHSS, National Institutes of Health Stroke Scale; R, right.
Handedness using the Edinburgh Handedness Inventory.
Time since onset of acute stroke to first study.
Indicates those patients who completed the 12-month longitudinal study.
All patients received standard multidisciplinary and rehabilitative care determined by their clinical requirements. Patients were subdivided according to lesion location into cortical (14 patients) and subcortical groups (17 patients). Subcortical infarcts were defined as location within basal ganglia, internal capsule, or corona radiata that did not involve the motor cortex, while cortical defined as wedge-shaped, superficial lesions in the territory of the large major cerebral arteries or lesions in a border zone that involved the motor cortex and may also involve underlying white matter.
Patients were assessed clinically and electrophysiologically within the same session at baseline (6.0 ± 0.7 days), and repeated at several time points during the follow-up period at 3 months (26 patients), 6 months (21 patients), and 12 months (17 patients).
Results were compared with 29 control subjects (aged 47-83 years, mean 58.8 ± 9.7 years), with cortical stimulation over the left hemisphere. Reproducibility in TMS parameters were previously demonstrated in control subjects 25 and hence repeat testing in this control cohort were not performed across the different time points in this study. All subjects provided written informed consent and study was approved by the local Health and Research Ethics Committee.
Clinical Assessments
Patients were assessed using the Barthel index (BI), upper-limb component of the Fugl-Meyer Score (FM), National Institutes of Health Stroke Scale (NIHSS), and modified Rankin Scale (mRS). Patients were further subdivided according to functional disability 26 with a BI >70 being mild (20 patients), and BI ≤70 moderate to severe (11 patients).
Cortical Excitability
Participants were seated on a comfortable reclining chair. Measures of cortical excitability were assessed by applying a 90-mm circular coil and assessing motor cortices ipsilateral and contralateral to the infarct separately, with recordings measured over the contralateral abductor pollicis brevis muscle (APB). The side of stimulation was dependent on the side of the coil (A or B) facing upward. The induced current flow was from the posterior to anterior direction in both hemispheres, such that when stimulating the left motor cortex, side A of the coil was facing up ensuring a posterior-to-anterior current flow within the left motor cortex, while side B was facing up when stimulating the right motor cortex. The coil was adjusted over the patient’s scalp until optimal position for a motor-evoked potential (MEP) was obtained from the APB. Currents were generated by 2 magnetic stimulators connected via a BiStim2002 (Magstim Co, Whitland, UK), such that both conditioning and test stimuli were independently set and delivered through 1 coil.
Paired-pulse threshold-tracking transcranial magnetic stimulation (TMS) techniques were utilized to assess intracortical neuronal excitability according to a previously reported and validated method using threshold-tracking25,27,28 that has now been used for studies in a broad range of neurological disease.29-34 The threshold-tracking strategy used a target response of 0.2 mV (±20%) located in the middle of the established linear relationship between the logarithm of the MEP amplitude and the stimulus intensity. 25 As such, selecting a target that is located in the steepest portion of the stimulus-response (SR) curve, relatively large variations in the MEP amplitude translate to relatively small variations in stimulus intensity or threshold.
The initial part of the protocol determined the resting motor threshold (RMT), which was defined as the stimulus intensity required to consistently (average 10 trials) produce and maintain this target MEP response of 0.2 mV, with the patient seated comfortably and testing limb relaxed. Voluntary electromyographic (EMG) activity was continually monitored using audio and visual feedback displayed on a projected computer screen, to ensure that these did not contaminate the recordings. Furthermore, a “time window” for capturing the MEP response was set such that no prestimulus EMG activity was recorded or captured for analysis. If voluntary EMG activity did contaminate the recordings, then the entire protocol was repeated. SR for cortical stimulation was determined by increasing the intensity of the magnetic stimulus to the following levels: 60%, 80%, 90%, 100%, 110%, 120%, 130%, 140%, and 150% RMT. Three stimuli were delivered at each intensity level and the maximum MEP amplitudes determined. In addition, the gradient of the line of best fit for the SR recruitment curve (for stimulus intensities between 90% and 150% RMT) was obtained using the least squares method.
Cortical silent period (CSP) was evoked by single-pulsed TMS with intensities that varied as per the SR curve, and recordings made with participants performing a weak voluntary contraction with visual feedback displayed on a monitor and broadly estimated as representing between 10% and 30% maximum voluntary contraction. This was achieved through the use of a force transducer to measure APB contraction with output processed and displayed using Spike2 data acquisition software (CED, Cambridge, UK) that plots the maximum force generated by a given patient and sets a “window” between 10% and 30% of this maximum whereby patients are encouraged to keep their subsequent generated force within this window during the CSP protocol. Maximum CSP duration was measured as per convention, 35 from the beginning of MEP to the return of EMG activity at 150% RMT stimulus intensity.
Short-interval intracortical inhibition (SICI) and intracortical facilitation (ICF) were measured according to a previously described and published protocol.25,28 Subthreshold conditioning stimuli (70% RMT) were delivered in sequential order at the following interstimulus intervals: 1, 1.5, 2, 2.5, 3, 3.5, 4, 5, 7, 10, 15, 20, and 30 ms.
In this paired-pulse paradigm (Figure 1), stimuli were delivered sequentially as a series of three channels: channel 1 tracked the stimulus intensity required to evoke the unconditioned test response (ie, RMT, such that the RMT was continuously monitored throughout the testing to ensure it remained stable); channel 2 monitored the subthreshold conditioning stimulus (70% RMT) so as to ensure that an MEP response was not produced and that the subject remained relaxed; and channel 3 tracked the stimulus required to produce the target MEP when conditioned by a subthreshold stimulus equal in intensity to that on channel 2. Tracking was deemed acceptable when the test stimulus produced 2 consecutive MEP responses within 20% of the target response (0.2 mV) or consistently oscillated about the target. The 3 channels were applied sequentially and the computer advanced to the next interstimulus interval only when tracking met the target criteria. The interval between stimuli was 5 seconds.
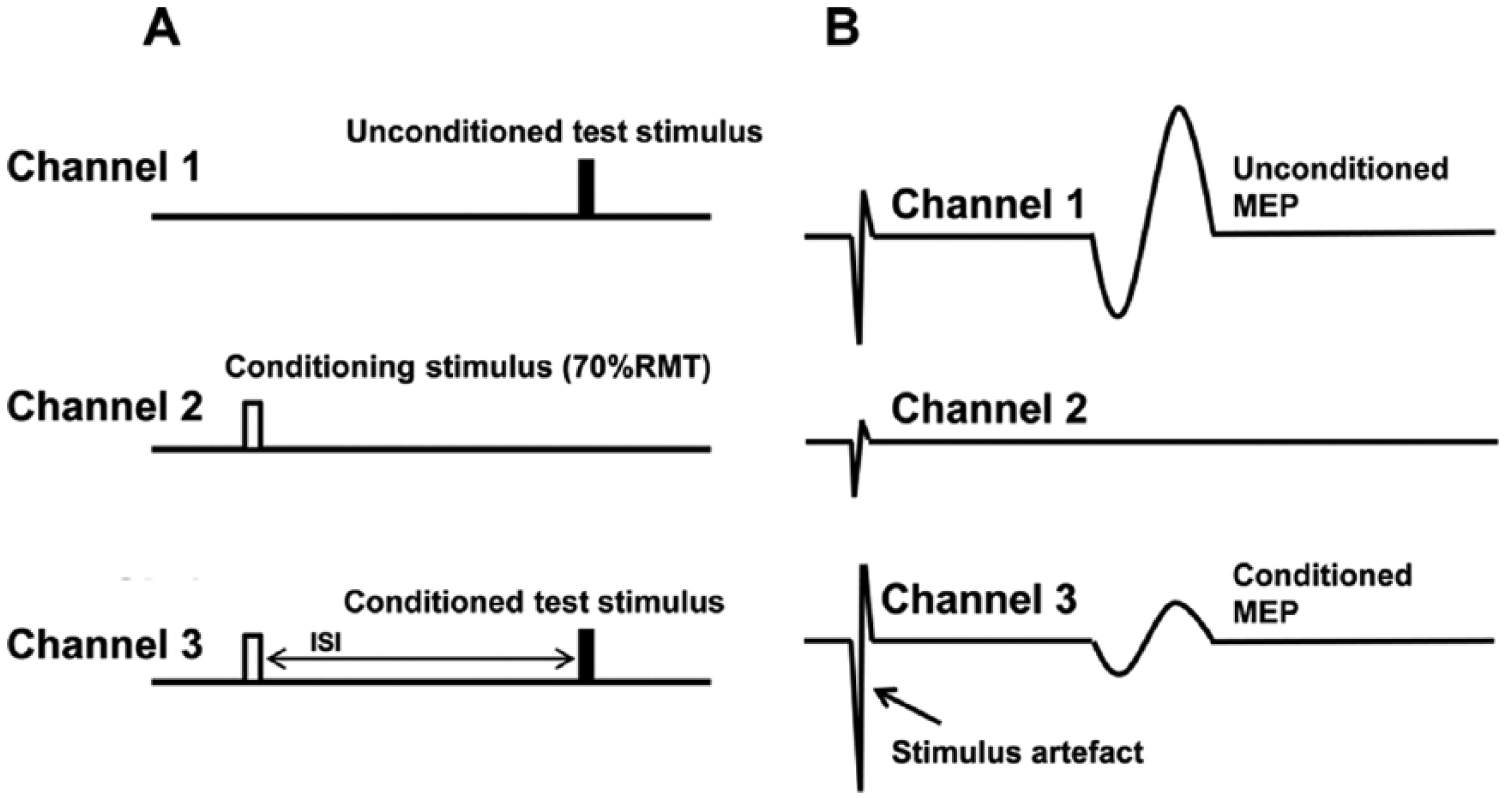
Experimental paradigm and configuration of stimulus patterns for measurement of short-interval intracortical inhibition (SICI) and intracortical facilitation (ICF). Cortical excitability was assessed by measuring changes in stimulus intensity required to generate a target motor-evoked potential (MEP) response of 0.2 mV. Channel 1, unconditioned test stimulus, measuring resting motor threshold (RMT). Channel 2, conditioning stimulus, set to subthreshold (70% RMT). Channel 3, conditioned test stimulus at different interstimulus intervals (ISIs).
Short-interval intracortical inhibition was measured as the increase in test stimulus intensity required to evoke the target MEP, and calculated as follows25,27:

Facilitation was measured as the decrease in the conditioned test stimulus intensity required to evoke the target MEP. Averaged SICI was determined over the interstimulus intervals of 1 to 7ms, while averaged ICF was determined over the intervals of 10 to 30 ms, as described previously. 25
Statistical Analysis
Statistical analysis was performed using SPSS v22 (IBM Corp, Armonk, NY, USA). Group data were compared using Student’s t tests and side-to-side data were compared using paired t tests. Post hoc Tukey honestly significant difference testing to make pairwise comparisons was used for subgroup analyses at baseline according to stroke location and impairment, with the familywise significance level set at 0.05. Changes over time of each electrophysiological parameter in either hemisphere (and their subgroups) were examined using the general linear model with repeated-measures analysis of variance (ANOVA) with within-group factor being time. To compare the difference between each subgroup (severity and location) within each hemisphere at each time point to control values, one-way ANOVA using the Dunnett test was used. Correlations between electrophysiological parameters and clinical scores were assessed by Spearman rank test. P value of <.05 was regarded as statistically significant. Results are expressed as mean ± standard error of the mean (SEM).
Results
Acute Stroke Baseline
Clinical Assessments
Functional severity of stroke patients ranged from mild to severe at baseline, with mean BI of 76.3 (range, 10-100), FM of 52.5 (range, 0-60), NIHSS of 3.4 (range, 0-17), and mRS of 2.5 (range, 0-5) (Figure 2).
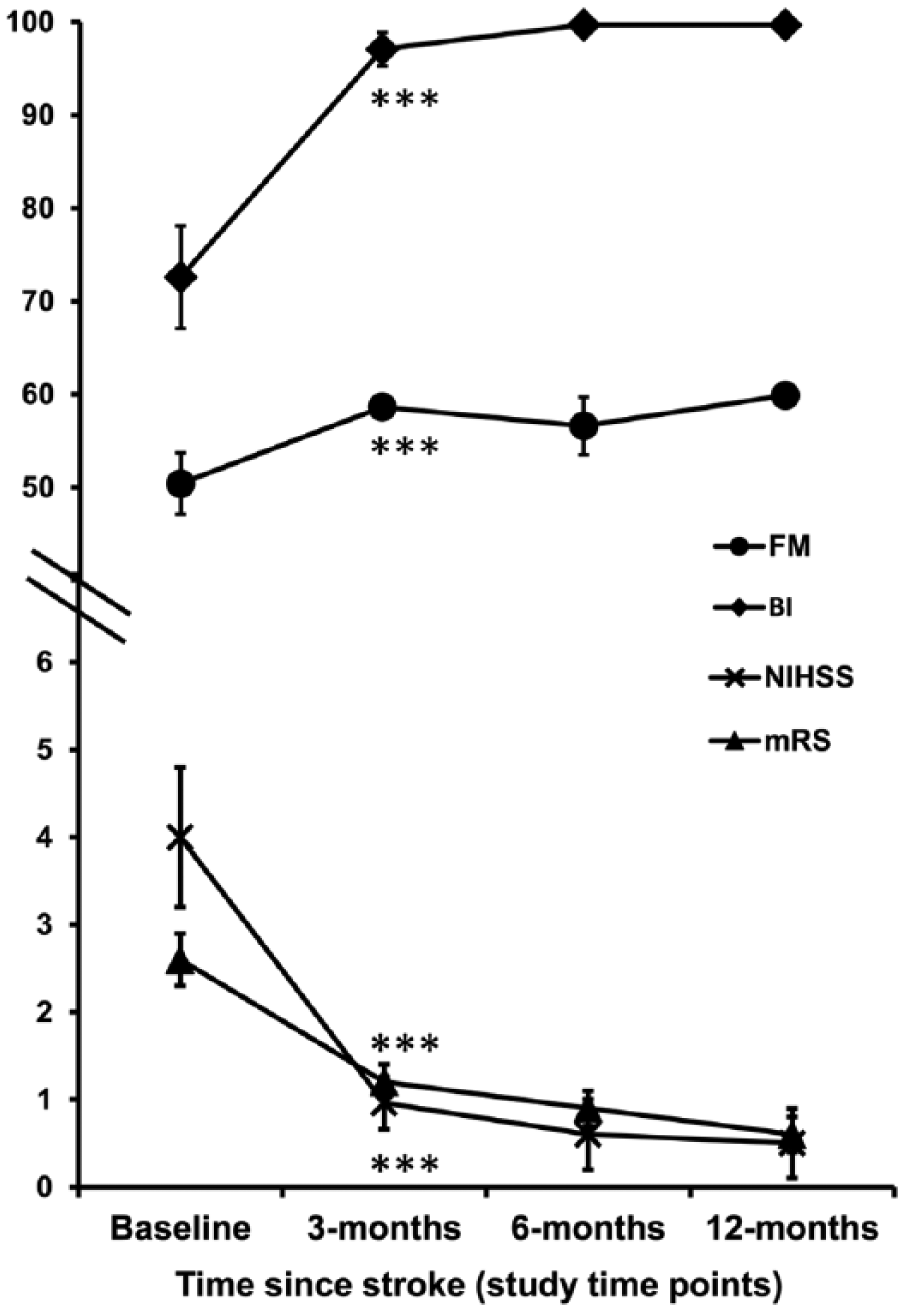
Mean clinical (± standard error of the mean) scores over 12-month follow-up (n = 17). All scales of impairment significantly improved within the first 3 months following acute stroke, after which time they plateaued. The mean scores at 12 months reflect good recovery and functional independence in all patients. ***P < .001.
Corticomotoneuronal Excitability
Baseline cortical excitability parameters are presented in Table 2. Ipsilesional cortices were relatively inexcitable in 6 patients (19% of cohort) (defined as either absent MEPs or MEP amplitudes not achieving 0.2 mV at maximum stimulator output), all of whom exhibited moderate-severe functional impairment (mean FM = 33, NIHSS = 8, BI = 50, mRS = 3.6). For the purpose of calculating mean RMT over the ipsilesional motor cortices, an arbitrary value of 100% was assigned to those with an inexcitable motor cortex. RMT of the ipsilesional hemisphere was 65.7% ± 3.6%, and was significantly higher compared with that of the contralesional hemisphere being 57.5% ± 1.7% (P = .014). Both hemispheres, however, were similar in RMT to controls (61.5% ± 1.6%; P = .19 and P = .13, respectively). Maximum MEP amplitudes were also no different between controls (2.4 ± 0.3 mV) and the ipsilesional (2.2 ± 0.3 mV, P = .63) and contralesional hemispheres (2.5 ± 0.3 mV, P = .89); nor were r=they different between hemispheres. In addition, the calculated gradient of the SR recruitment curve was no different between the contralesional (1.61 ± 0.08) and ipsilesional hemispheres (1.52 ± 0.06, P = .43).
Baseline Cortical Excitability Parameters (N = 31). a
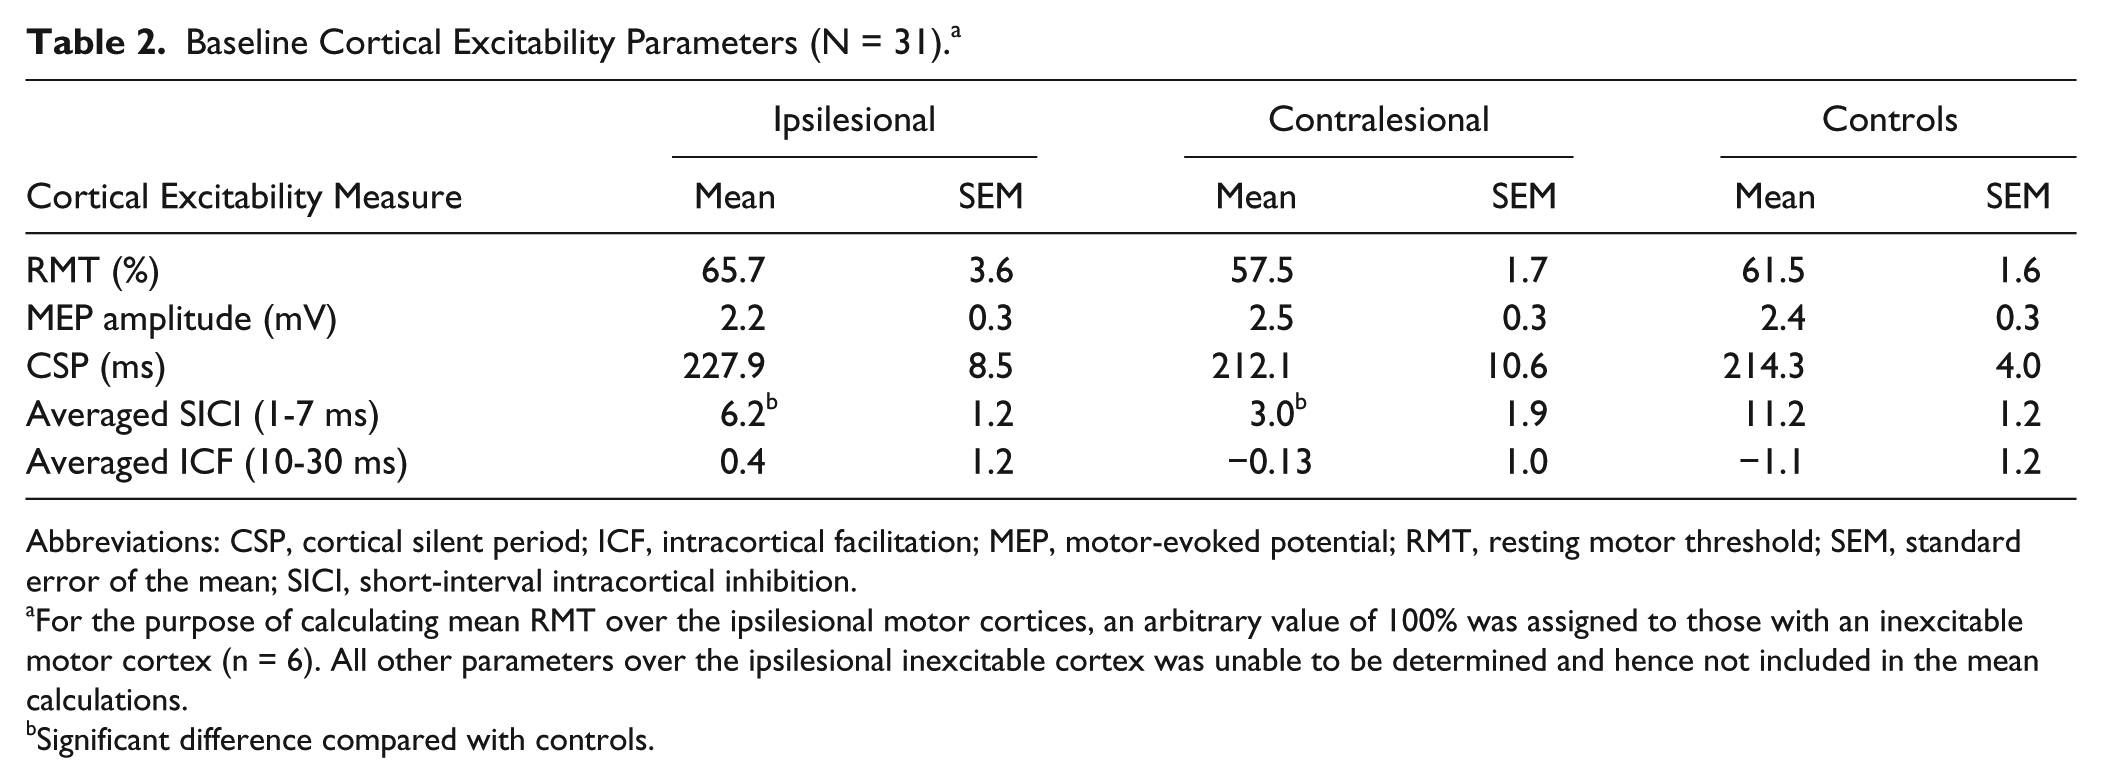
Abbreviations: CSP, cortical silent period; ICF, intracortical facilitation; MEP, motor-evoked potential; RMT, resting motor threshold; SEM, standard error of the mean; SICI, short-interval intracortical inhibition.
For the purpose of calculating mean RMT over the ipsilesional motor cortices, an arbitrary value of 100% was assigned to those with an inexcitable motor cortex (n = 6). All other parameters over the ipsilesional inexcitable cortex was unable to be determined and hence not included in the mean calculations.
Significant difference compared with controls.
Intracortical Excitability
Averaged SICI was significantly reduced in both ipsilesional (6.2% ± 1.2%, P = .004) and contralesional hemispheres (3.0% ± 1.9%, P < .001) compared with controls (11.2% ± 1.2%), without differences between sides (P = .2) (Figure 3). When analyzed according to stroke location, both cortical (5.4% ± 1.9%) and subcortical groups (6.7% ± 1.5%) in ipsilesional hemisphere, had reduced SICI compared with controls that was only significant in the cortical group and showed a trend in the subcortical group (P = .033 and P = .065, respectively), but comparable to each other (P = .88) (ANOVA, F2, 50 = 4.67, P = .014) (Figure 4A). On the contralesional side, reduced SICI was evident in both cortical (2.3% ± 3.7%) and subcortical groups (3.5% ± 1.7%) compared with controls (P = .006 and P = .01, respectively), but similar to each other (P = .99) (ANOVA, F2, 57 = 6.88, P = .002) (Figure 4A). Analyses according to severity at baseline, revealed SICI in the ipsilesional hemisphere was reduced in the moderate-severe group (2.3% ± 1.1%) but not in the mild group (8.1% ± 1.4%) compared with controls (P = .001 and P = .21, respectively), being more reduced in the more impaired compared with the mild group although this did not reach statistical significance (P = .06) (ANOVA, F2, 50 = 7.745, P = .001) (Figure 4B). Contralesionally, both mild (3.9% ± 2.5%) and moderate-severe groups (1.8% ± 3.0%) had reduced SICI compared with controls (P = .015 and P = .003, respectively), and similar to each other (P = .93) (ANOVA, F2, 57 = 7.07, P = .002) (Figure 4B).
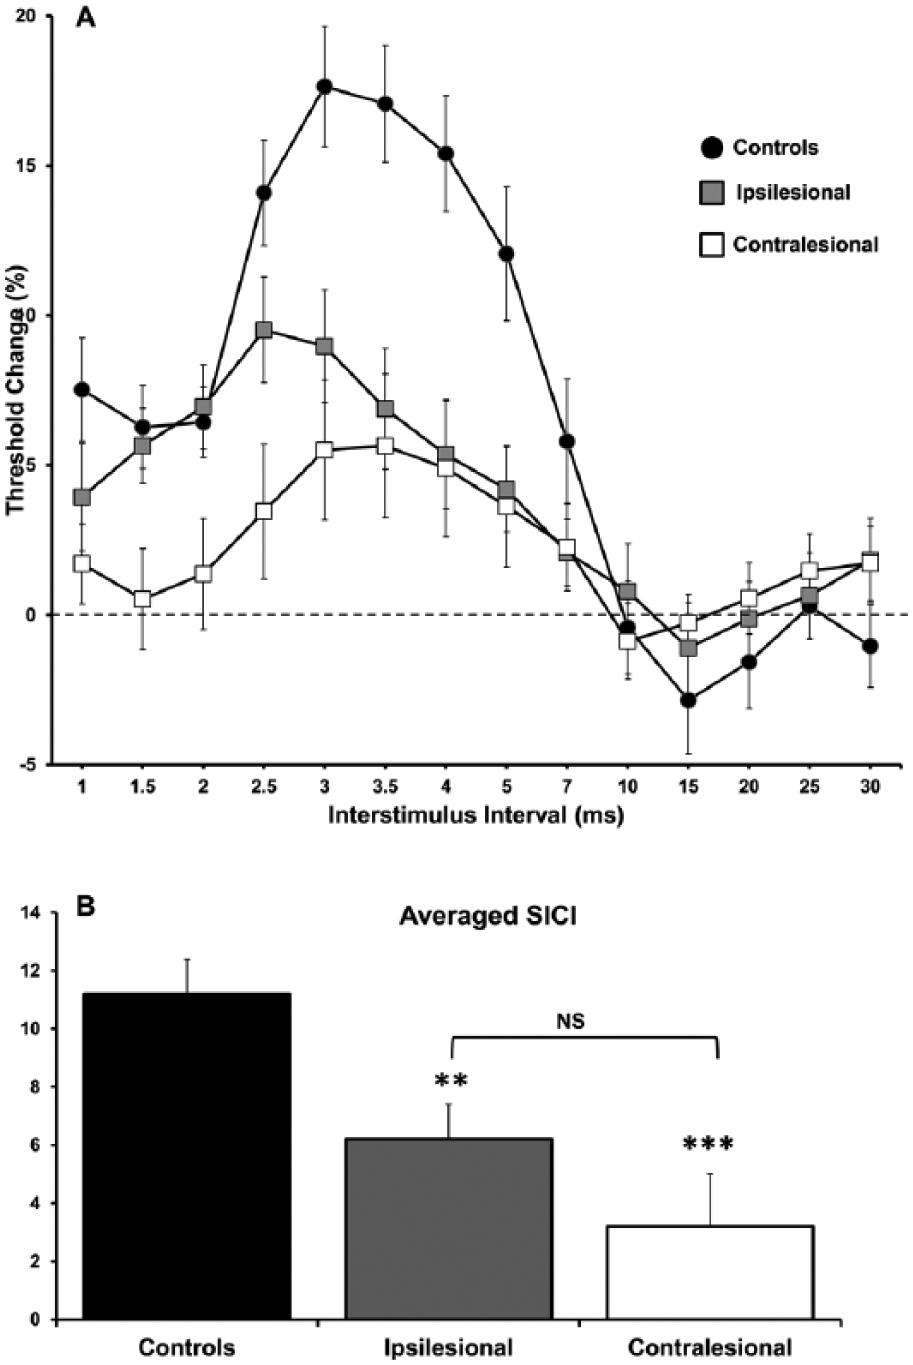
Baseline paired-pulse subthreshold conditioning transcranial magnetic stimulation (TMS) demonstrating; mean ± standard error of the mean (A) reduction in short-interval intracortical inhibition (SICI) in affected and unaffected hemispheres; (B) significant reductions in averaged SICI (between interstimulus intervals of 1 and 7 ms) in affected and unaffected hemispheres compared with controls. N = 31 although ipsilesional averages excluded 6 patients with inexcitable cortices at baseline.
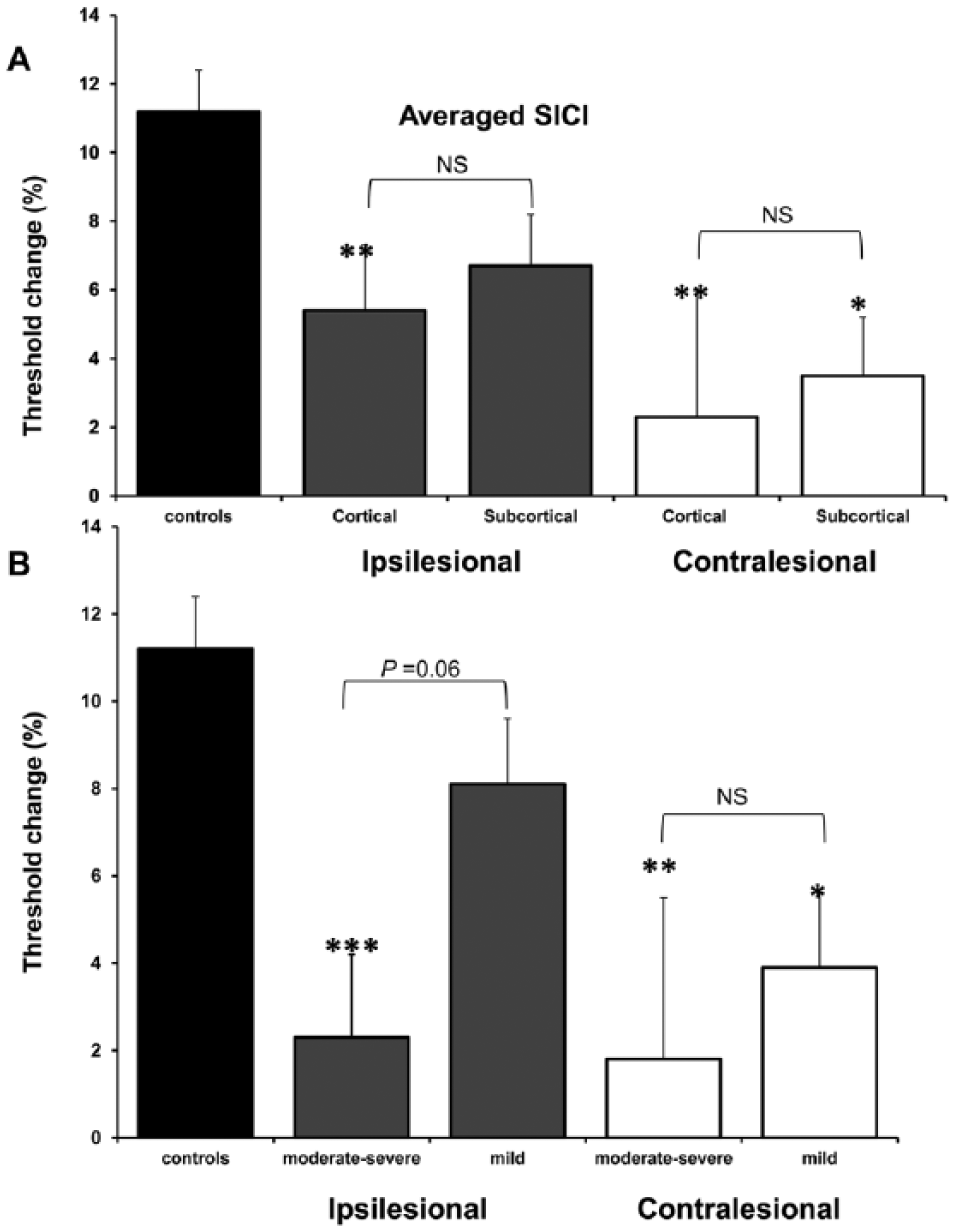
Baseline averaged (± standard error of the mean) short-interval intracortical inhibition (SICI). (A) SICI reduced in cortical and subcortical stroke location groups in both hemispheres although there was a trend for most reductions in cortical group. (B) SICI reductions more pronounced in moderate-severe impairment groups in both hemispheres. *P < .05, **P < .01, ***P < .001; NS, not statistically significant. Total N = 31 although ipsilesional averages excluded 6 patients with inexcitable cortices at baseline; ipsilesional: n = 10 for cortical group and n = 15 for subcortical group, n = 8 for moderate-severe impairment group, and n = 17 for mild group; contralesional: n = 14 for cortical group and n = 17 for subcortical group, n = 13 for moderate-severe impairment group, and n = 18 for mild group.
Averaged ICF was similar between ipsilesional (0.4% ± 1.2%) and contralesional hemispheres (−0.13% ± 1.0%, P = .97), as they were with controls (−1.1% ± 1.2%; P = .39 and P = .53, respectively). CSP duration was also comparable between controls (214.3 ± 4.0 ms) and ipsilesional (227.9 ± 8.5 ms, P = .11) and contralesional hemispheres (212.1 ± 10.6 ms, P = .84), as well as between hemispheres (P = .28).
Longitudinal Assessments
Clinical Assessments
In the cohort of 17 patients who completed the 12-month follow-up, subgroups were reasonably equal with 10 patients with baseline impairment that was moderate to severe and 7 in the mild group. Eight were from the cortical group while 9 were from the subcortical group. All functional scores improved over the 12-month period, most significantly in the first 3 months. Thereafter, scores tended to plateau over the assessment period (Figure 2), with good recovery and functional independence achieved in all patients at 12 months.
Corticomotoneuronal Excitability
Measures of corticomotoneuronal excitability over those ipsilesional cortices that were excitable at baseline, remain unchanged (RMT, ANOVA, F3, 21 = 2.15, P = .12; MEP amplitude, ANOVA, F3, 21 = 1.4, P = .26) over the 12-month follow-up period. Similarly, values pertaining to contralesional cortices were also stable over this period (RMT, ANOVA, F3, 36 = 0.87, P = .46; MEP amplitude, ANOVA, F3,36 = 1.2, P = .31).
Of the cohort of patients with initial inexcitable ipsilesional cortices, all had normalization of excitability (RMT = 60.9% ± 8%), associated with improvement in clinical scores (mean FM = 53.8; NIHSS = 2.2; BI = 88; mRS = 2.4). When analyzing the change in RMT over the 12-month period that included those with the initial inexcitable ipsilesional cortices (assigned 100% as RMT at baseline), there was a significant reduction of RMT from initial recordings over this longitudinal period (ANOVA, F3, 45 = 5.31, P = .026).
Intracortical Excitability
When examined as an entire cohort, there were no significant changes in the averaged SICI over the course of 12 months in the ipsilesional cortex (ANOVA, F3, 36 = 0.94, P = .43), while there was a trend for SICI to normalize over time in the contralesional hemisphere although this did not reach statistical significance (ANOVA, F3, 45 = 2.4, P = .08).
When analyzed according to subgroups of stroke location, there were no significant changes in SICI in the ipsilesional hemisphere across time for both the cortical (ANOVA, F3,18 = 0.55, P = .65) and subcortical groups (ANOVA, F3, 15 = 0.88, P = .47) (Figure 5A). However, over the contralesional hemisphere, there was a significant change over time in the subcortical group (ANOVA, F3, 18 = 3.7, P = .032), while those in the cortical group remained unchanged (ANOVA, F3, 24 = 2.07, P = .13) (Figure 5C).
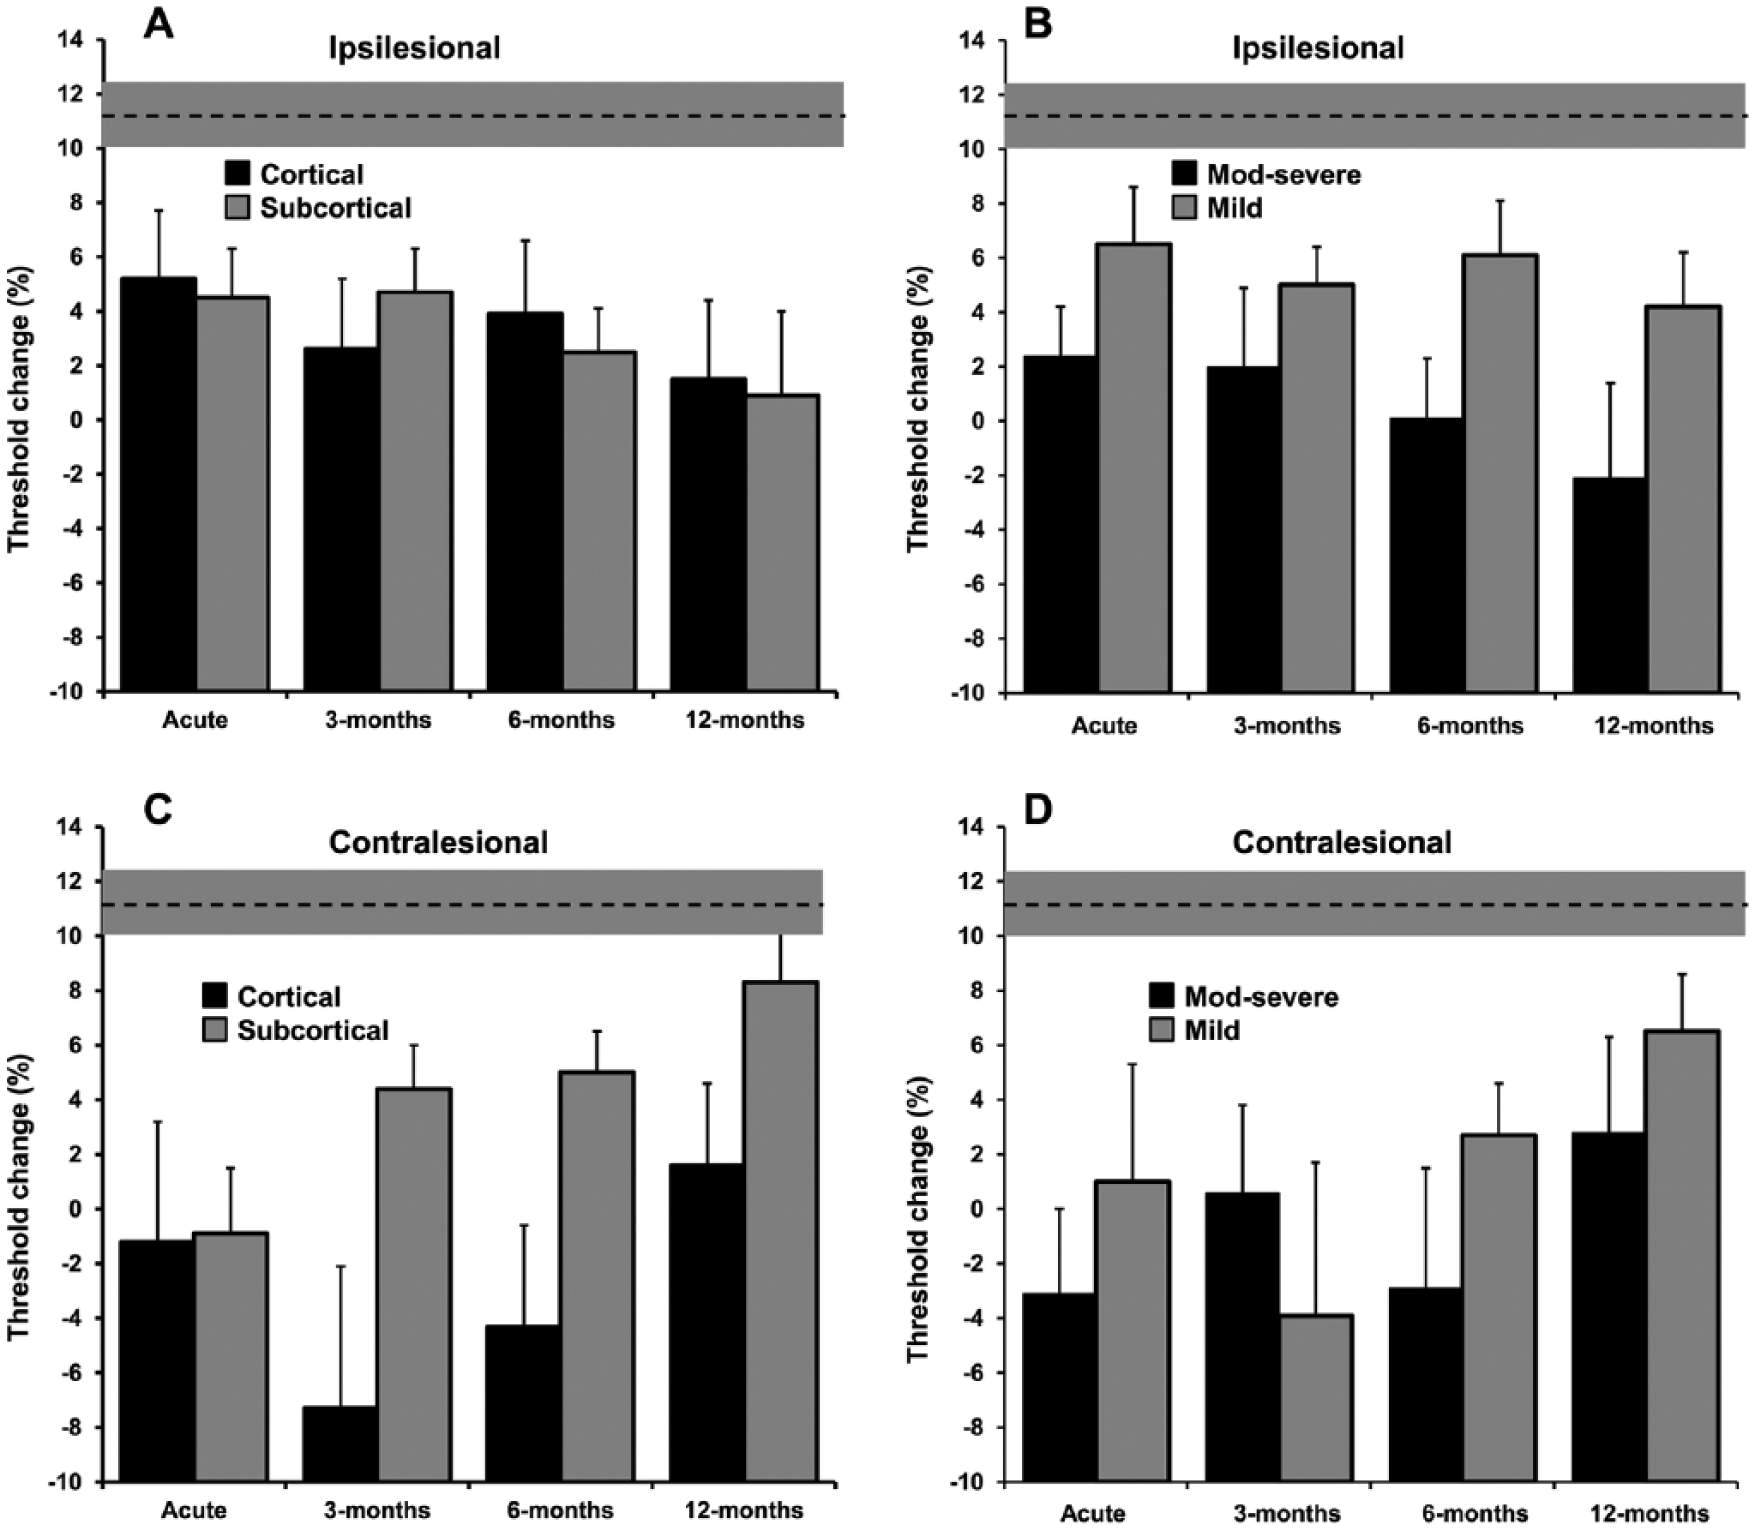
Longitudinal changes in averaged (± standard error of the mean [SEM]) short-interval intracortical inhibition (SICI) over 12 months (n = 17). (A, B) Ipsilesional subgroup changes in SICI: no significant change over time for both stroke location and baseline impairment; all groups remained significantly different compared with controls at 12 months. (C, D) Contralesional subgroup changes in SICI: significant changes over time for both stroke location and baseline impairment were noted for those in the groups with subcortical stroke and mild impairment at baseline, whereby SICI normalized over time in these groups, while the cortical and more impaired groups had persistently reduced SICI. Dotted line with shaded region denotes control values with their SEM; n = 9 for cortical group and n = 8 for subcortical group; n = 8 for moderate-severe impairment group and n = 9 for mild group. Changes over time in SICI in either hemisphere (and their subgroups) were examined using the general linear model with repeated-measures analysis of variance (ANOVA) with within-group factor being time. To compare the difference between each subgroup (severity and location) within each hemisphere at each time point with control values, one-way ANOVA using the Dunnett test was used.
When analyzed according to baseline level of impairment, there were no significant changes over the 12-month period in both the mild (ANOVA, F3,21 = 0.31, P = .82) and moderate to severe (ANOVA, F3,12 = 0.75, P = .54) groups in the ipsilesional motor cortex (Figure 5B). Over the contralesional motor cortex, there was a significant change over time in the mild group (ANOVA, F3, 21 = 3.3, P = .041), but not in the more severely impaired group (ANOVA, F3, 21 = 1.2, P = .33) (Figure 5D).
Furthermore, subgroup analyses over the contralesional hemisphere at each time point using ANOVA with Dunnett testing comparing with control values, demonstrated that intracortical inhibition remained reduced in patients with cortical stroke and those with most baseline functional impairment, while patients with initial mild baseline impairment and subcortical stroke demonstrated normalization of intracortical inhibition over the study period (Figure 5C and D).
Averaged ICF remained unchanged over the assessment period over both ipsilesional (ANOVA, F1.6, 11.3 = 0.36, P = .66) and contralesional (ANOVA, F3,36 = 1.16, P = .34) cortices, consistent with previous studies
36
and animal studies showing no long-term alterations in N-methyl-
Clinical Correlations
Although there were no significant correlations between ipsilesional RMT at baseline and clinical scores when including the cohort of patients assigned with RMT of 100% (BI, r = −0.22, P = .25; FM, r = −0.20, P = .31; mRS, r = .18, P = .33; NIHSS, r = .08, P = .66), when this particular group were removed from the analysis, there was a tendency for a correlation between ipsilesional RMT and functional scores although these did not reach statistical significance (BI, r = −0.29, P = .053; FM, r = −0.26, P = .075; mRS, r = .24, P = .09), but suggests that reduced corticomotoneuronal excitability may be present in those with most disruption to functional integrity of ipsilesional motor pathways and consequently more functional impairment.
Discussion
The present study has established evolution of intracortical excitability changes occurring over both motor cortices, in a longitudinal design involving a cohort of well-recovered stroke patients studied acutely and for the first time, systematically reassessed at multiple time points up to 12 months. The current study also provided further insight into how evolution of these potentially functionally relevant changes differed depending on baseline characteristics of the stroke.
Ipsilesional Intracortical Excitability
Results of the current study have revealed that over the ipsilesional motor cortex, reductions in SICI persisted over the follow-up period in association with clinical improvements. This may suggest that ipsilesional changes represent adaptive neuroplastic processes mediating stroke recovery, consistent with results of previous reports.13,14,38 Neuroimaging studies have also demonstrated regional overactivations in the ipsilesional hemisphere that persisted during the recovery process,6,36,39 which may in fact represent the imaging correlate of such electrophysiological changes observed using TMS. 40
Additionally, our results have also shown that ipsilesionally reduced SICI persisted regardless of lesion location or baseline functional impairment. Other authors have also found similar results with regards to lesion location.38,41
Contralesional Intracortical Excitability
Over the contralesional hemisphere, the results of the present study have demonstrated reductions in intracortical inhibition during the follow-up period, in association with functional improvements. During this period, there were significant effects of stroke location and baseline impairment, such that most reductions in SICI occurred in those with cortical stroke and those with moderate-severe baseline impairment. Furthermore, SICI in subcortical and mild baseline impairment groups normalized over the assessment period, suggesting that the evolution of contralesional excitability differs between groups of patients with differing lesion and clinical characteristics. Previous studies have only observed reduction in contralesional SICI in those patients with cortical 42 but not subcortical lesions,12,14,43 while others have also demonstrated changes in both location groups.10,11,13,38,44 Furthermore, some studies have failed to demonstrate changes in intracortical inhibition in the contralesional hemisphere with group comparisons, but showed correlations with clinical parameters suggesting hyperexcitability in those with greater impairment 15 as we have shown in our cohort with moderate-severe impairment.
Controversy continues concerning the role and evolution of contralesional changes observed in functional imaging and electrophysiological studies following stroke, particularly in regards to their functional relevance in recovery. In general, previous results using these techniques have revealed overactivations in multiple regions2-6 as well as reductions in intracortical inhibition11-14,38 over the contralesional hemisphere immediately after the event, consistent with the current study.
Following the acute event, changes over the intact hemisphere as a function of time vary between previously reported studies. Cross-sectional studies have shown increased cortical excitability in patients with good recovery, 38 while those without such changes have poorer outcome.11,12 Longitudinal studies, however, have suggested that patient’s with good motor recovery tend to normalize these parameters with time, while persistently reduced inhibition in the contralesional cortex were observed in those with poorer recovery. 13 However, there are also neuroimaging studies showing persistent over-activation in contralesional cortices in well-recovered patients.4,5
The present study suggested that in this cohort of well-recovered stroke patients, contralesional intracortical disinhibition was most prominent during the follow-up period in patients with cortical strokes and those with more severe baseline impairment compared with their counterpart subgroups, and that intracortical disinhibition persisted in these patients while those with subcortical strokes and milder baseline impairment normalized with time. Our results also suggested that the more baseline impaired patients likely had significant disruption to functional integrity of ipsilesional motor pathways, given the correlation between ipsilesional RMT and impairment. The balance of brain activation after stroke may in fact be governed by integrity of ipsilesional sensorimotor cortex and its corticospinal tract. 39 Hence, those in whom the cortex is spared and ipsilesional motor integrity sufficiently intact (milder impairment group), good recovery may be mediated by normalization of activity back to ipsilesional cortices. On the contrary, patients with lesions involving primary motor cortices and/or damaged ipsilesional corticospinal tracts, persistent excitability and overrecruitment of contralesional networks may be required to achieve functional recovery.1-4,39,45
To provide further support for changes over the contralesional hemisphere as being functionally relevant to the recovery process in stroke, recruitment of ipsilateral motor pathways have been demonstrated as playing an important part in this process.
Ipsilateral descending motor control is mediated by both direct and indirect pathways. 18 Approximately 10% of corticospinal pathways originating from the ipsilateral M1 are uncrossed at the medullary decussation and project directly onto spinal motoneurons,46,47 while the indirect pathways descend from the ipsilateral M1 to reticular neurons in the brainstem and then onto cervical spinal cord motoneurons, constituting the cortico-reticulo-propriospinal pathway (CRPP). 18 Although such ipsilateral M1 projections are thought to usually control axial and proximal muscles with little contribution to distal motor function in normal subjects, 48 these properties may change under certain circumstances such as stroke and provide a means for functional recovery.49,50
In a study on cats, unmasking of ipsilateral M1 pathways was evident after treatment with 4-aminopyridine (a potassium channel blocker). 51 Other animal studies have shown corticospinal tracts from each motor cortex initially projecting bilaterally onto spinal cord anterior horn cells that subsequently become pruned according to neuronal activity and maturity, resulting in final contralateral predominance. And with experimental hemispheric silencing, axons are retracted on the contralateral side of the spinal cord ventral horn and ipsilateral fibers from unaffected hemisphere predominate. 52 In human studies, structural imaging has documented hypertrophy of ipsilateral corticospinal tract from contralesional hemisphere in cerebral infarcts in infants. 53 This hypothesis is further supported by electrophysiological studies demonstrating the presence of ispilateral MEPs from the contralesional M1 to distal hand muscles in patients with good stroke recovery, that are not normally present in control subjects.54-56 Other studies have further demonstrated upregulations of the indirect CRPPs after stroke with compromise to the corticospinal tract, 57 and hypothesized that while contralesional CRPPs may interfere with residual descending inputs from the ipsilesional cortex in patients with minimal damage to the corticospinal tract and hence negatively impact recovery, contralesional CRPPs may provide the only descending cortical drive to the spinal cord in the presence of extensive damage to the corticospinal tract. 18 Activation of such ipsilateral pathways may have come about through the unmasking of existing connections via synaptic reorganization or the creation of new ones through sprouting and synaptogenesis. 54
Other Excitability Parameters
Our study did not reveal changes in ICF, also a measure of intracortical excitability that is likely mediated by glutamatergic processes, in stroke patients compared to controls at any stage during the recovery process in both ipsilesional and contralesional hemispheres, and is consistent with previous human studies11,14,15,36,42 and well as studies in rats that have demonstrated only transient alterations in NMDA neurotransmission following vascular lesions. 37
In addition, measures of corticomotoneuronal excitability including RMT, MEP amplitudes and CSP duration were not significantly altered following acute stroke in both the ipsilesional and contralesional hemispheres consistent with previous reports.10-12,42,44,58 Some studies have suggested reduced ipsilesional corticospinal excitability (namely elevated RMT and reduced MEP amplitudes) in the acute stroke period that tend to normalize over time.10,14,45,54 One possible explanation for this discrepancy is the widely variable RMT and MEP amplitudes even across control populations.59,60 Additionally, there was a small cohort of patients in the acute phase of our study that had inexcitable motor cortices over the ipsilesional hemisphere that were not included in the mean RMT for this baseline assessment, and may have contributed to this apparently “normal” RMT compared with controls as well as the apparently “stable” values over time. A potential option was to arbitrarily assign a value of 100% for RMT for these patients which when performed in such a way, effectively brought up the mean value for ipsilesional RMT in our cohort at baseline compared with the contralesional side.
Moreover, the presence of motor evoked potentials in the ipsilesional hemisphere were found by some authors to be associated with better recovery compared with those with absent responses.55,58,61-65 However, in other reports, there were patients with good outcomes that initially had no demonstrable MEPs,55,61,66 which was also observed in our current study. The absence of changes in CSP duration is consistent with animal and human studies in stroke that have shown no alteration in GABA-B neurotransmission.17,67
Cellular Mechanisms of Cortical Hyperexcitability and Neuroplasticity
The widespread cortical hyperexcitability resulting from reductions in SICI following stroke is mediated by a downregulation in processes involving GABA-A neurotransmission17,68 that result in functional reorganization of cerebral networks, ultimately leading to structural reorganization that is conducive to motor and functional recovery. GABA signaling in the brain occur through 2 main systems: tonic and phasic. Phasic GABA signaling is when an interneuron action potential depolarizes the presynaptic bouton, causing release of GABA and an effect on postsynaptic GABA receptors; whilst tonic GABA signaling respond to ambient GABA levels outside the synapse, and controls the overall membrane potential of the neuron and its propensity to fire.36,69 Stroke causes an increase in tonic GABA currents for more than 1 month after the stroke. There is a substantial 50% increase in the tonic GABA current in peri-infarct motor neurons because of diminished GABA uptake by astrocytes in the peri-infarct cortex. 36 Thus, on a physiological level, recovering peri-infarct motor cortex is hypoexcitable after stroke, and blocking tonic GABA currents may promote behavioral recovery after stroke. 70 This increase in tonic GABA inhibition immediately after stroke occurs because of diminished GABA uptake and is not due to altered GABA channel function or to alterations in the neuronal responsiveness to GABA, 36 and hence will not be observed in studies of phasic signaling. Previous studies in brain inhibition after stroke, including the current study, have examined phasic or synaptic inhibition which all suggest that paired-pulse cortical inhibition is reduced in the early stages of stroke.10,71 Overall, animal and human studies suggest a possible contrast in GABA systems after stroke: phasic signaling appears reduced early after stroke, while tonic GABA signaling is potentiated, but reducing resultant cortical inhibition has been shown to lead to improved functional recovery. 36
Greater plasticity has been shown to be associated with greater degrees of excitability, whilst enhanced inhibition is associated with impaired plasticity. 72 These changes occur in regions structurally connected to the lesion in both hemispheres. Animal and human studies in stroke have demonstrated reductions in both GABA-A receptors as well as GABA-A neurotransmitter levels following stroke in both hemispheres,16,17,67,73-77 which were a result of recovery rather than the infarct itself. 77 Studies that have supported the role GABA-ergic downregulation in stroke recovery, have shown that introducing a selective GABA receptor antagonist in the chronic stages of stroke in rats resulted in motor recovery, 70 while another study that involved administration of a GABA-ergic drug (midazolam) in chronic stroke patients led to reemergence of stroke deficits. 78
The resultant reduction in GABA-mediated inhibition facilitates the process of long-term potentiation,73,79 a mechanism fundamental to synaptic plasticity and hence cortical reorganization governing recovery after stroke. Associated with this, terminal axonal sprouting, dendritic branching and synaptic numbers are enhanced in both the ipsi- and contralesional hemispheres in animal models of stroke.80-84 Subsequently, these cellular changes allow for the unmasking of previously silent networks and by converting these to functional networks is per se a mechanism of functional reorganization and cortical map plasticity. 75 This process also permits surviving neurons remote but connected to the damaged area to acquire information previously processed by the damaged tissue. The entire process culminates in the final structural modification to stabilize the new connectivity patterns 75 in a way that is drives functional recovery after stroke.
While it would be difficult to entirely exclude the acute excitability changes over the contralesional hemisphere as representing disinhibitive diaschisis, the numerous animal and human experiments using histopathological, electrophysiological, and functional imaging studies (as discussed above) have suggested that these early changes are more in keeping with a neuroplastic change in order to support recovery after stroke rather than inhibit it. Although there are animal models of cerebral blood flow in the contralateral cortices during the hyperacute (<1 hour) phase that show minimal or no change during this period, glucose metabolism in other studies have shown to be somewhat reduced only within 1 to 24 hours after stroke with some showing normalization within an hour. 85 In addition, accompanying the widespread reduction in GABA-ergic transmission in the contralesional hemisphere,74-76 there is use-dependent dendritic growth followed by dendritic pruning, synapse formation, and changes in the specific structure of synaptic connections,81,82 and that greater sensorimotor impairments are found in the affected limb when dendritic growth in the contralesional hemisphere is blocked. 84
Results from the previous studies by our contributing authors have suggested that a complex series of overlapping inhibitory and facilitatory processes contribute to the changes in intracortical excitability produced by a conditioning stimulus, and that a change in any one of these could potentially produce changes in SICI. 86 Further to this, the intensity of the conditioning stimulus, set by reference to the threshold for the MEP (in this case 70% RMT), may affect the relative contributions of these different interneuronal processes. That is to say that if changes in MEP threshold are not accompanied by similar changes in threshold of inhibitory circuits underlying SICI, the effective conditioning stimulus could differ from that seen in normal subjects. This may be a potential limitation in our study and needs to be considered in studies of SICI in not only patients in our current study but also applied to all other disease process using this technique. Hence, the use of varying conditioning stimulus intensities may need to be considered in future studies of patients with neurological disorders.
Clinical Implications
Use of NIBS such as repetitive-TMS and transcranial direct current stimulation are becoming popular tools to neuromodulate the brain in order to promote stroke recovery. Based on the concept of interhemispheric inhibition, 45 a suggested model to improve function relates to upregulation of excitability in lesioned motor cortices (M1), possibly combined with downregulation of excitability over contralesional-M1. However, the prevailing view of needing to suppress contralesional excitability to redress this interhemispheric imbalance, has not considered effects on output pathways other than transcallosal projections. 18 Nor does it consider potential deleterious effects by suppressing alternate ipsilateral pathways from contralesional-M1 that may be important for functional recovery in those with more damaged ipsilesional tracts. Our study suggests that in patients with cortical stroke and more severe baseline impairment, a reliance on alternate circuits orchestrated by contralesional networks may be functionally relevant for the recovery process and that interfering with this activity may in fact be detrimental, highlighting the fact that “one-size-fits-all” protocols may not be appropriate. 24
The present study had several limitations. First, a certain proportion of the current corhort had inexcitable ipsilesional cortices at baseline, which limited the extent to which analyses could be undertaken in this group, at least over the one hemisphere. Second, because of the protracted longitudinal 12-month assessment period, there was inevitably a progressive reduction in the number of patients studied at each follow-up time point. Third, the nonrandomized delivery of interstimulus intervals during the paired-pulse pulse paradigm may have resulted in a systematic effect in the MEP response. In addition, it could also be argued that the size of the target MEP response (0.2 mV) may have influenced SICI. While such a notion could not be absolutely discounted, the findings from previous studies that SICI appeared to be largely influenced by interstimulus interval values and the level of conditioning stimulus intensity argues against a significant influence of the target MEP size.27,86 Last, the number of patients within each subgroup for stroke location and functional severity at the 12-month follow-up time point were relatively small. Further studies in future with larger subgroup cohorts are required to confirm the results of the present longitudinal study.
Footnotes
Declaration of Conflicting Interests
The author(s) declared no potential conflicts of interest with respect to the research, authorship, and/or publication of this article.
Funding
The author(s) disclosed receipt of the following financial support for the research, authorship, and/or publication of this article: Dr Huynh was supported by the National Health and Medical Research Council scholarship. Prof Kiernan was supported by funding to Forefront from the National Health and Medical Research Council of Australia Program Grant (#1037746).
References
Supplementary Material
Please find the following supplemental material available below.
For Open Access articles published under a Creative Commons License, all supplemental material carries the same license as the article it is associated with.
For non-Open Access articles published, all supplemental material carries a non-exclusive license, and permission requests for re-use of supplemental material or any part of supplemental material shall be sent directly to the copyright owner as specified in the copyright notice associated with the article.