
Abstract
Background. Surface electrical stimulation of the abdominal muscles, with electrodes placed in the posterolateral position, combined with a voluntary cough can assist clearance of airway secretions in individuals with high-level spinal cord injury (SCI). Objective. To determine whether an increase in stimulus intensity of the trains of electrical stimuli delivered to the expiratory muscles has an increasing effect on a stimulated voluntary cough and to determine at which stimulus intensity a plateau of cough peak expiratory flow occurs. Methods. In 7 healthy individuals with a SCI at and above C7, gastric pressure (Pga), esophageal pressure (Pes), peak expiratory cough flow (PEFcough), and expiratory volume were measured as participants coughed voluntarily with simultaneous trains of electrical stimuli delivered over the abdominal muscles (50 Hz, 1-s duration). The intensity of the stimulation was increased incrementally. Results: A plateau in PEFcough occurred in all 7 individuals at a mean of 211 ± 29 mA (range 120-360 mA). Peak values reached for Pga, Pes, and PEFcough were 83.0 ± 8.0 cm H2O, 66.1 ± 5.6 cm H2O, and 4.0 ± 0.4 l/s respectively. Conclusions. The plateau in expiratory cough flow that was associated with increasing expiratory pressures is indicative of dynamic airway compression. This suggests that the evoked cough will be effective in creating more turbulent airflow to further assist in dislodging mucus and secretions.
Introduction
For people with a cervical or high thoracic spinal cord injury (SCI), paralyzed or weakened abdominal muscles result in a reduced ability to cough effectively.1-3 Their ability to clear airway secretions is reduced, and the risk of atelectasis and pneumonia is increased. Respiratory complications, such as pneumonia, remain a major cause of death in people with SCIs.4-6 Stimulation of the abdominal muscles, timed with a voluntary cough, enhances cough in people with SCI. The abdominal muscles can be stimulated using various methods, including surface electrical,3,7-11 magnetic,12-16 or implanted spinal cord stimulation.17-19 Implanted spinal cord stimulation at combined thoracic and lumbar levels in people with SCI produces the largest expiratory pressures (as high as 200 cm H2O) and flows (up to 10 L/s) in cough from total lung capacity (TLC).17,19 However, large abdominal pressures (66 cm H2O) and expiratory flows (5 L/s) also can be produced in people with SCI by trains of magnetic stimulation over T10 to activate the ventral roots that innervate the abdominal muscles. 16
Recently, we have shown that surface electrical stimulation of the abdominal muscles, with electrodes positioned posterolaterally to activate a large number of the intercostal nerves, that innervate the abdominal muscles, can produce large cough pressures (50 - 60 cm H2O) and flows (4 L/s) in SCI.3,8,20 This method is much more effective than surface electrical stimulation with electrodes placed over the anterior abdominal wall.7,10,11,21-23 Surface electrical stimulation is a feasible, accessible, affordable, and portable method to evoke a functional cough.
To date, the stimulus intensities that we have used for the posterolateral electrical stimulation in people with SCI have been deliberately limited to those that produce a gastric pressure of 40 cm H2O at functional residual capacity (FRC).3,8,24 The mean intensity used to do this was ~125 mA. 3 This intensity is about a third of that which produces a maximal twitch pressure and is estimated to produce a twitch pressure of ~30% maximal twitch pressure. Therefore, there is potential to further enhance cough by increasing the stimulus intensity for the trains of stimuli applied during voluntary cough. Therefore, the current study aimed to examine the effect of increases in stimulus intensity on the expiratory pressures, flow, and expiratory volume during stimulated coughs in individuals with cervical SCI. We hypothesized that as stimulus intensity increased, expiratory pressures and flow would also increase and that peak expiratory flow would eventually plateau.
Methods
A total of 7 healthy male patients with a SCI and motor impairment at and above C7 were studied. Clinical assessment of their neurological impairment was assessed in accordance with the American Spinal Injury Association 25 ; see Table 1. Participants were screened to check that they could tolerate the stimulation. All patients had a reduced cough (assessed by their unstimulated voluntary cough) and impaired lung function (Table 1). All procedures were approved by the University of New South Wales and the South Eastern Sydney Illawarra Area Health Service Human Research Ethics Committees and conformed with the Declaration of Helsinki.
Participant Data and Lung Function. a
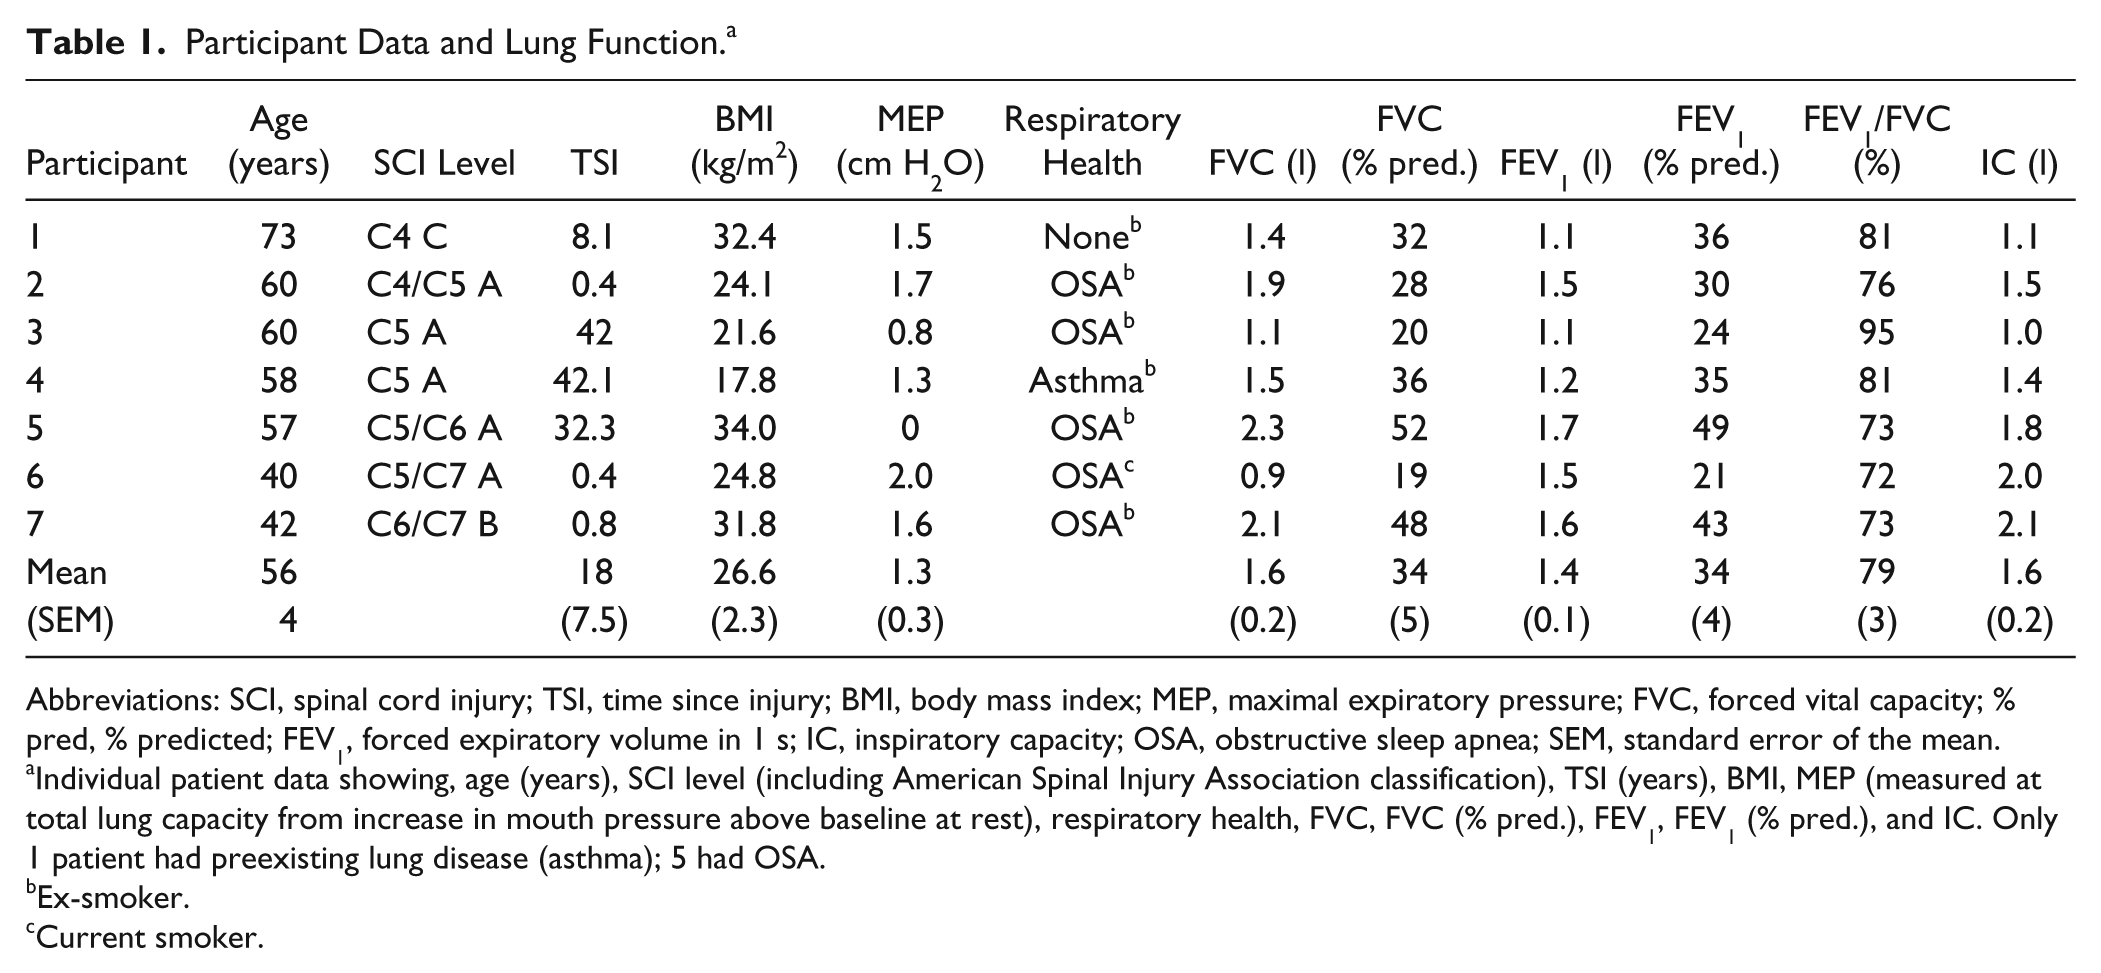
Abbreviations: SCI, spinal cord injury; TSI, time since injury; BMI, body mass index; MEP, maximal expiratory pressure; FVC, forced vital capacity; % pred, % predicted; FEV1, forced expiratory volume in 1 s; IC, inspiratory capacity; OSA, obstructive sleep apnea; SEM, standard error of the mean.
Individual patient data showing, age (years), SCI level (including American Spinal Injury Association classification), TSI (years), BMI, MEP (measured at total lung capacity from increase in mouth pressure above baseline at rest), respiratory health, FVC, FVC (% pred.), FEV1, FEV1 (% pred.), and IC. Only 1 patient had preexisting lung disease (asthma); 5 had OSA.
Ex-smoker.
Current smoker.
The experimental setup was similar to that published previously3,8 (see Figure 1). Patients were seated in their wheelchair, and measures of lung function were performed prior to cough testing (Table 1). Patients breathed through a mouthpiece, and air flow was measured using a pediatric pneumotachometer (model 3813, Hans Rudolph, Kansas City, MO). This signal was integrated online to give volume. A gastroesophageal catheter, mounted with 2 pressure transducers (CTG-2, Gaeltec Ltd, Dunvegan, UK), was inserted via the nose to measure gastric (or abdominal) pressure (Pga) and esophageal (or thoracic) pressure (Pes) through transducers located in the stomach and 20 cm rostral in the esophagus, respectively. Two or 3 sprays of local anesthetic (5% lignocaine hydrochloride) were delivered to the nose and back of the throat before insertion of the catheter. A thin smear of gel (2% lignocaine hydrochloride) was also applied to the tip of the catheter before insertion. In addition, beat-to-beat blood pressure was monitored continuously via a Portapres system (FMS, Finapres Medical Systems BV, Amsterdam, Netherlands) with the pressure cuff around the left middle finger. All signals were digitized (1401 Plus, CED Limited, Cambridge, UK) and stored on computer (sampling rate 2000 Hz).
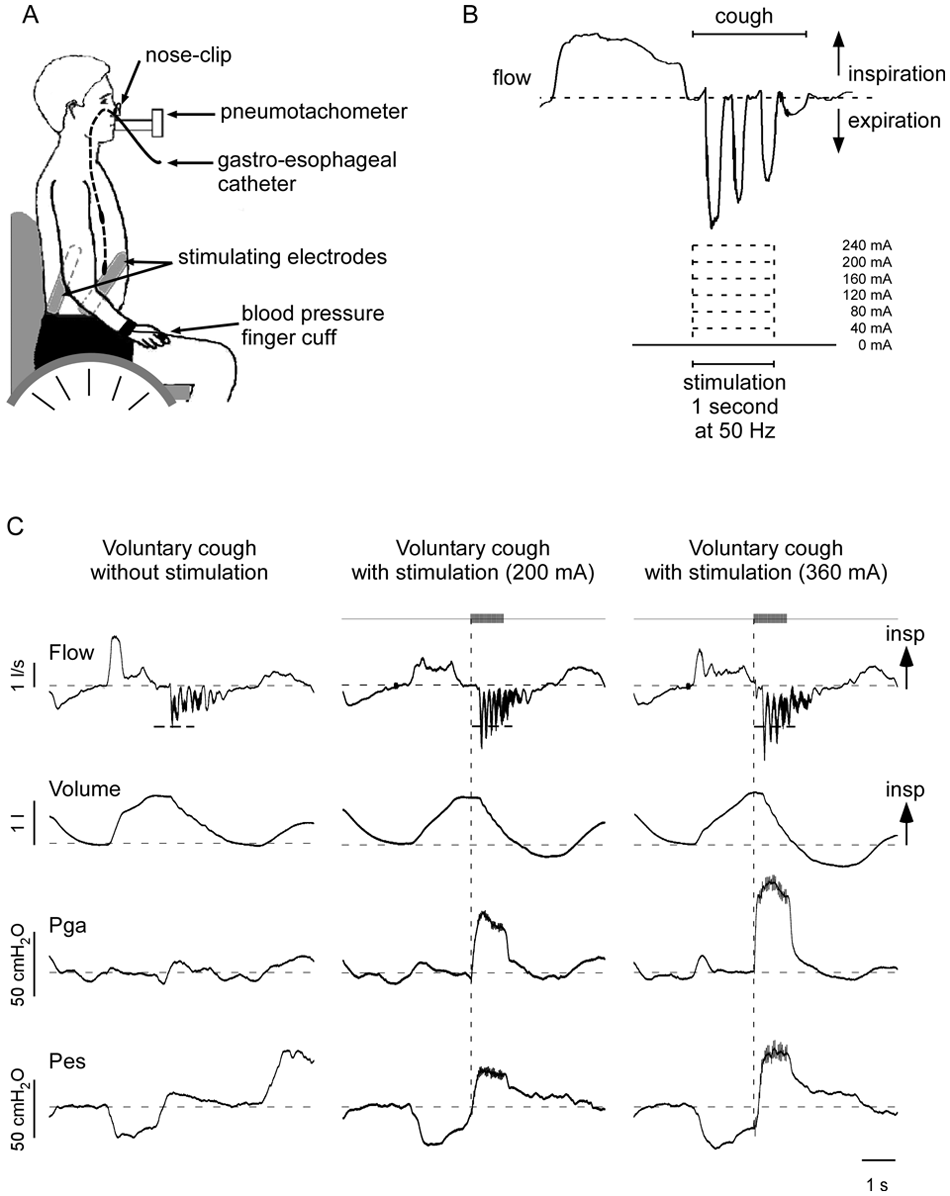
Experimental setup and protocol. A. Experimental setup showing patient seated in wheelchair, breathing through a mouthpiece attached to a pneumotachometer. A gastroesophageal catheter was positioned such that a pressure transducer located in the stomach measured Pga, and the proximal transducer located in the esophagus measured Pes. Blood pressure was monitored continuously. B. Upper panel shows typical flow trace during a cough (breath in to total lung capacity is also shown). Stimulation was applied at 50 Hz for 1 s during a voluntary cough. Increasing intensities of stimulation up to 240 mA were applied. Stimulation was delivered just prior to the onset of the expulsive phase of cough (timed with verbal cues). C. Raw data from a single patient (C5, American Spinal Injury Association C) depicting 3 voluntary coughs: 1 without (left panel) and 2 with superimposed trains of stimuli (middle and right panels, 50 Hz, 1 s duration, 200 and 360 mA). Expiratory flow, lung volume, abdominal pressure (Pga), and thoracic pressure (Pes) traces are shown. Gray bars and vertical dashed line indicate the onset and duration of the stimulus train. Short horizontal dashed lines on flow traces indicate PEFcough for the unstimulated cough effort. Long horizontal dashed lines indicate zero flow, end-tidal volume, and baseline pressures. With electrical stimulation superimposed on a voluntary cough, there are increases in PEFcough, expiratory volume below end-tidal volume, and expiratory pressures (indicated by positive deflections). In B and C, flow returns to zero during the cough when there is glottic closure.
Stimulation
Electrical stimulation was applied through 2 flexible, reusable multistick gel electrodes (10 × 18 cm2, multistick gel electrodes, Axelgaard Manufacturing Co, Ltd, Fallbrook, CA) that were halved (5 × 18 cm2); their corners were rounded, and they were then placed bilaterally over the thoracoabdominal wall, in the posterolateral position optimal for abdominal muscle stimulation3,8,24 (see Figure 1A).
Stimulus Trains
To assess the effect of stimulus on cough, trains of 50-Hz stimuli (1-s duration) were applied bilaterally to tetanically contract abdominal muscles while patients attempted a maximal voluntary cough from near TLC. The expulsive phase of the cough was timed by verbal cues to occur just after the onset of stimulation (~250 ms).3,8 The intensity of the stimulus train applied during voluntary coughs was increased in 40-mA increments. Two maximal coughs were performed at each stimulus intensity, starting from 40 mA, then 80 mA, then 120 mA and so on, up to 1 or 2 increments beyond the point at which peak expiratory flow had reached a plateau (excluding points that were at or below the peak expiratory flow achieved in a cough without stimulation, Figure 1B). The range of highest intensities used across patients was 160 to 480 mA. Stimulated coughs were compared with maximal voluntary coughs without stimulation.
Single Stimuli
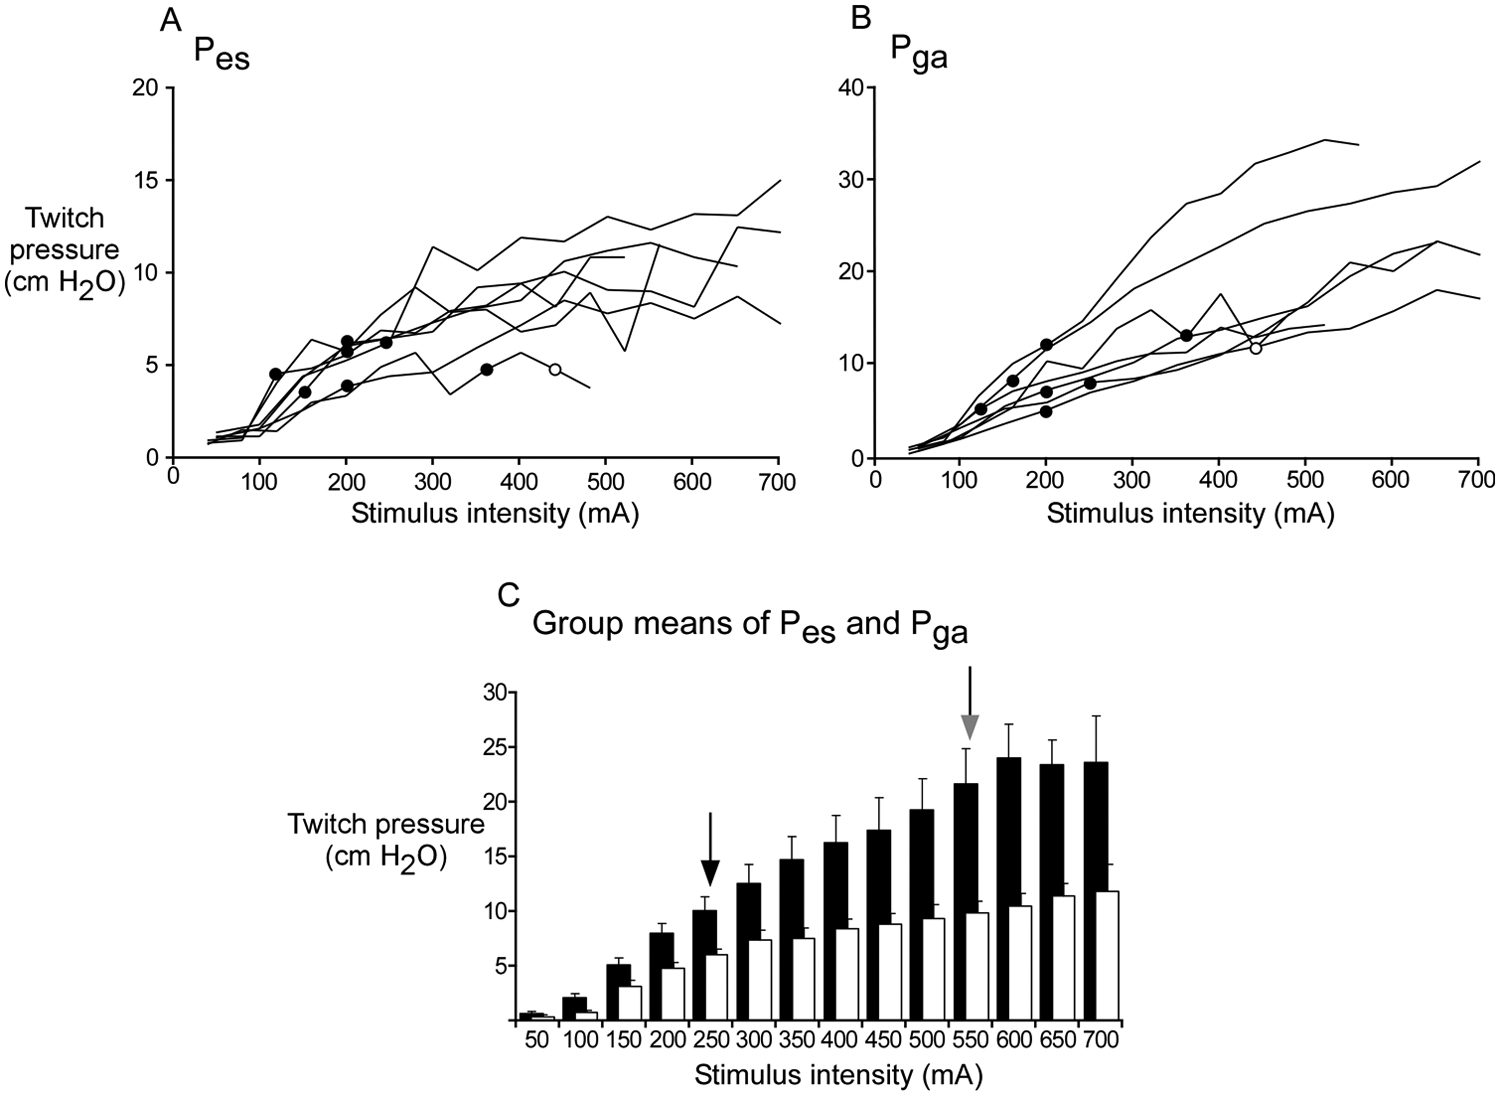
To assess the maximal force production of the abdominal muscles, twitch pressures were evoked with single stimuli delivered through the same posterolaterally placed electrodes at end expiratory volume (an estimate of FRC), so that the inspiratory and expiratory muscles were relaxed at the time of the single stimuli. The single pulses (rectangular, 0.2 ms duration) were delivered bilaterally in pairs (4 s apart) at increasing intensities (from 40 to 700 mA) in either 40- or 50-mA increments and increased until the gastric twitch pressure reached a plateau at its maximum (Figure 2). We defined the maximal Pga twitch as the highest twitch pressure produced (average of the response to 2 stimuli at each intensity) and when a further increase in stimulus intensity did not produce further increases in twitch pressure or produced a decrease in twitch pressure. In 1 patient, we did not increment the intensity beyond 700 mA, at which point, we had reached a plateau in Pes but not Pga.
Individual recruitment curves of twitch pressures (Pes and Pga) with single electrical stimuli. Recruitment curves of twitch pressures evoked by single stimuli during relaxation at FRC (40- to 50-mA increments) for both Pes (A) and Pga (B) for each of the 7 patients. The filled circles indicate the stimulus intensity at which peak expiratory flow reached a plateau for that patient when trains of stimuli were applied during a voluntary cough, and the open circle indicates the stimulus intensity at which Pes reached a plateau (in only 1 patient). C. Average twitch pressures across patients at each stimulus intensity (Pes, open bars; Pga, filled bars). The black arrow (at left) indicates the mean stimulus intensity at which a plateau of peak expiratory flow occurred across all 7 patients. The gray arrow (at right) indicates mean stimulus intensity to produce the maximal Pga twitch in each patient. Note that after 550 mA, patient numbers decrease to n = 5, 4, and then 3. For 3 patients, the Pga twitch pressure did not reach a plateau by our criteria, but the last increment in stimulus intensity produced only small changes in pressure in 2 patients (by 2.5% and 5.7% above the size of the pressure twitch with the previous stimulus intensity). For the patient who did not reach a plateau, the increase in pressure was 9.0%. However, for each of these 3 patients, the Pes twitch pressure reached a plateau.
Analysis
Measurements were made during each cough of the Pga, Pes, peak expiratory flow produced in the cough (PEFcough), and the total expiratory volume from near TLC. The expiratory volume below the usual end-expiratory volume was also calculated. For Pga and Pes, the active change in pressure produced by the expiratory muscles was measured from a baseline pressure taken midway between the inspiratory and expiratory pressure swings in the quiet breaths taken prior to the cough. All data were averaged for 2 similar trials at each stimulus-train intensity. Data were compared across stimulus intensities with a repeated-measures 1-way ANOVA with post hoc multiple comparisons versus control (Dunnett’s method), in which the control was taken as a cough with no stimulation. Only data from stimulation trains up to 240 mA were included in the statistical analysis, because only 3 patients were stimulated at higher intensities. The stimulus intensities used in the trains applied during cough (from TLC) were compared with the stimulus intensities required to produce a maximal Pga twitch at rest (at FRC) with a single pulse. Unless indicated, data are shown as mean ± standard error of the mean in the text and figures. A P value of <.05 was taken to be of statistical significance.
Results
Individual data and the group mean data for lung function measurements are shown in Table 1. On average, patients had a forced vital capacity (FVC) of 1.6 ± 0.2 l (34% ± 5% of predicted values), forced expiratory volume in 1 s (FEV1) of 1.4 ± 0.1 l (34% ± 4% of predicted values), FEV1/FVC ratio of 79% ± 3%, and an inspiratory capacity of 1.6 ± 0.2 l.
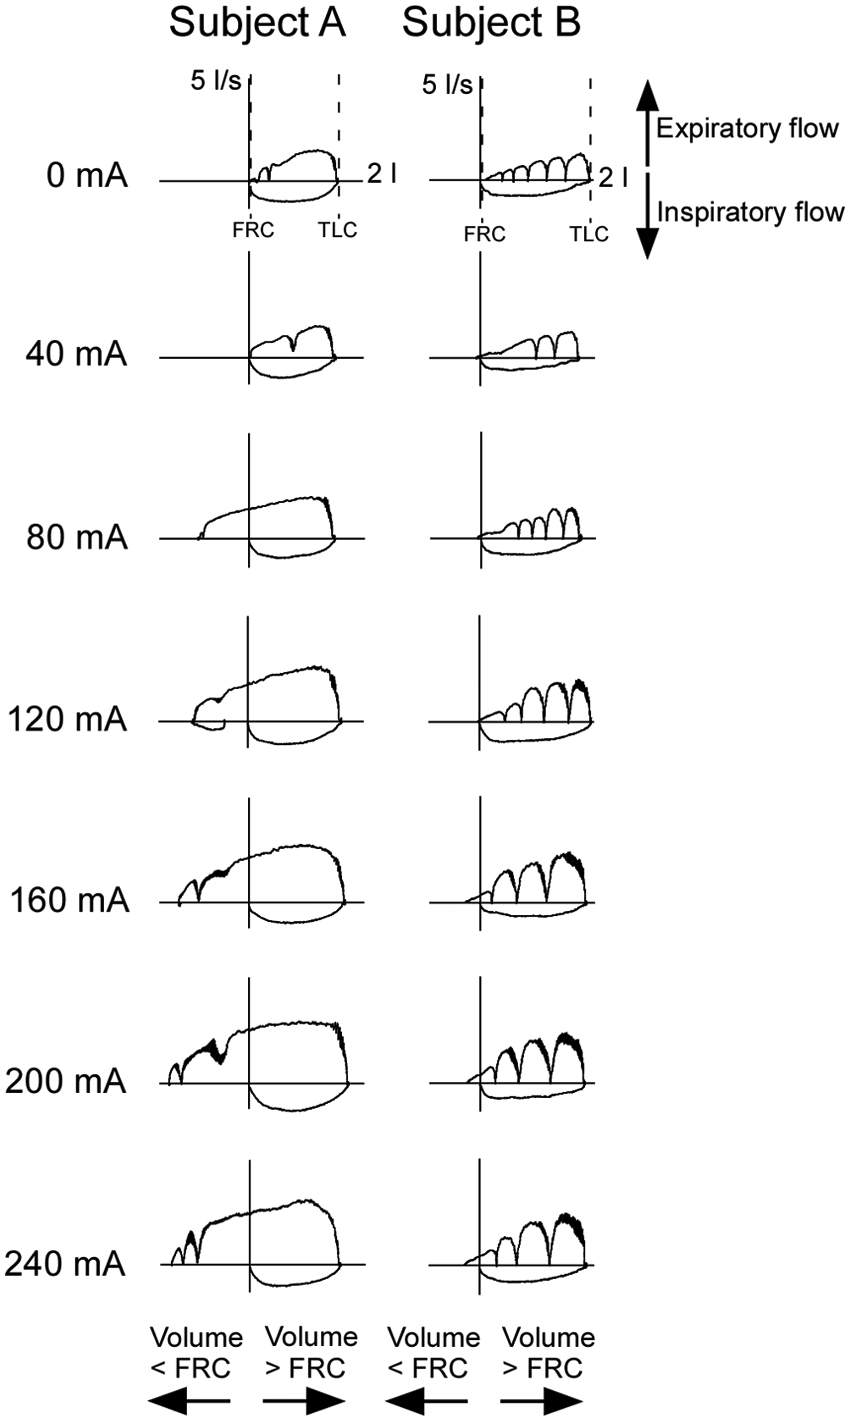
During voluntary coughs from near TLC, with superimposed stimulation (50-Hz trains) over the thoracoabdominal wall, there was an increase in Pga, Pes, PEFcough, and expiratory volumes (Figure 1C). Figure 3 shows examples of the cough flow-volume loops for 2 participants at each stimulus-train intensity up to 240 mA. With an increase in stimulus-train intensity, the expiratory flow increased. The flow-volume loops also demonstrate an increase in the expiratory volume below end-tidal volume as the stimulus intensity increases (particularly in patient A, Figure 3, see Figure 4E for group data).
Flow-volume curves for voluntary coughs with stimulation at increasing intensities (0-240 mA) from 2 individuals with spinal cord injury. Data from 2 patients, A and B. Patient A has an injury level of C5 American Spinal Injury Association (AIS) A (patient 3 in Table 1). Patient B has an injury level of C5/7 AIS A (patient 6 in Table 1). Both have a peak expiratory flow plateau in a cough with a superimposed stimulus train at 200 mA. Volume is shown on the x-axis with 0 at functional residual capacity (FRC). Horizontal axes to the right are 2 L. Flow is shown on the y-axis with expiratory flow upward. Vertical axes in the upward direction are 5 L/s. For each patient, the top panel shows a single cough in which the patient has breathed to total lung capacity before initiating the cough voluntarily without abdominal muscle stimulation (0 mA). Glottic closures during the cough are indicated by the flow returning to zero during expiration. Subsequent panels then show a single stimulated cough (1-s duration, 50 Hz) at each stimulus increment up to 240 mA. Both patients increased expiratory flow with increased stimulus intensity. Patient A also had a large expiratory lung volume below FRC with increased intensity of stimulation, whereas a small increase in expiratory volume was observed in patient B.
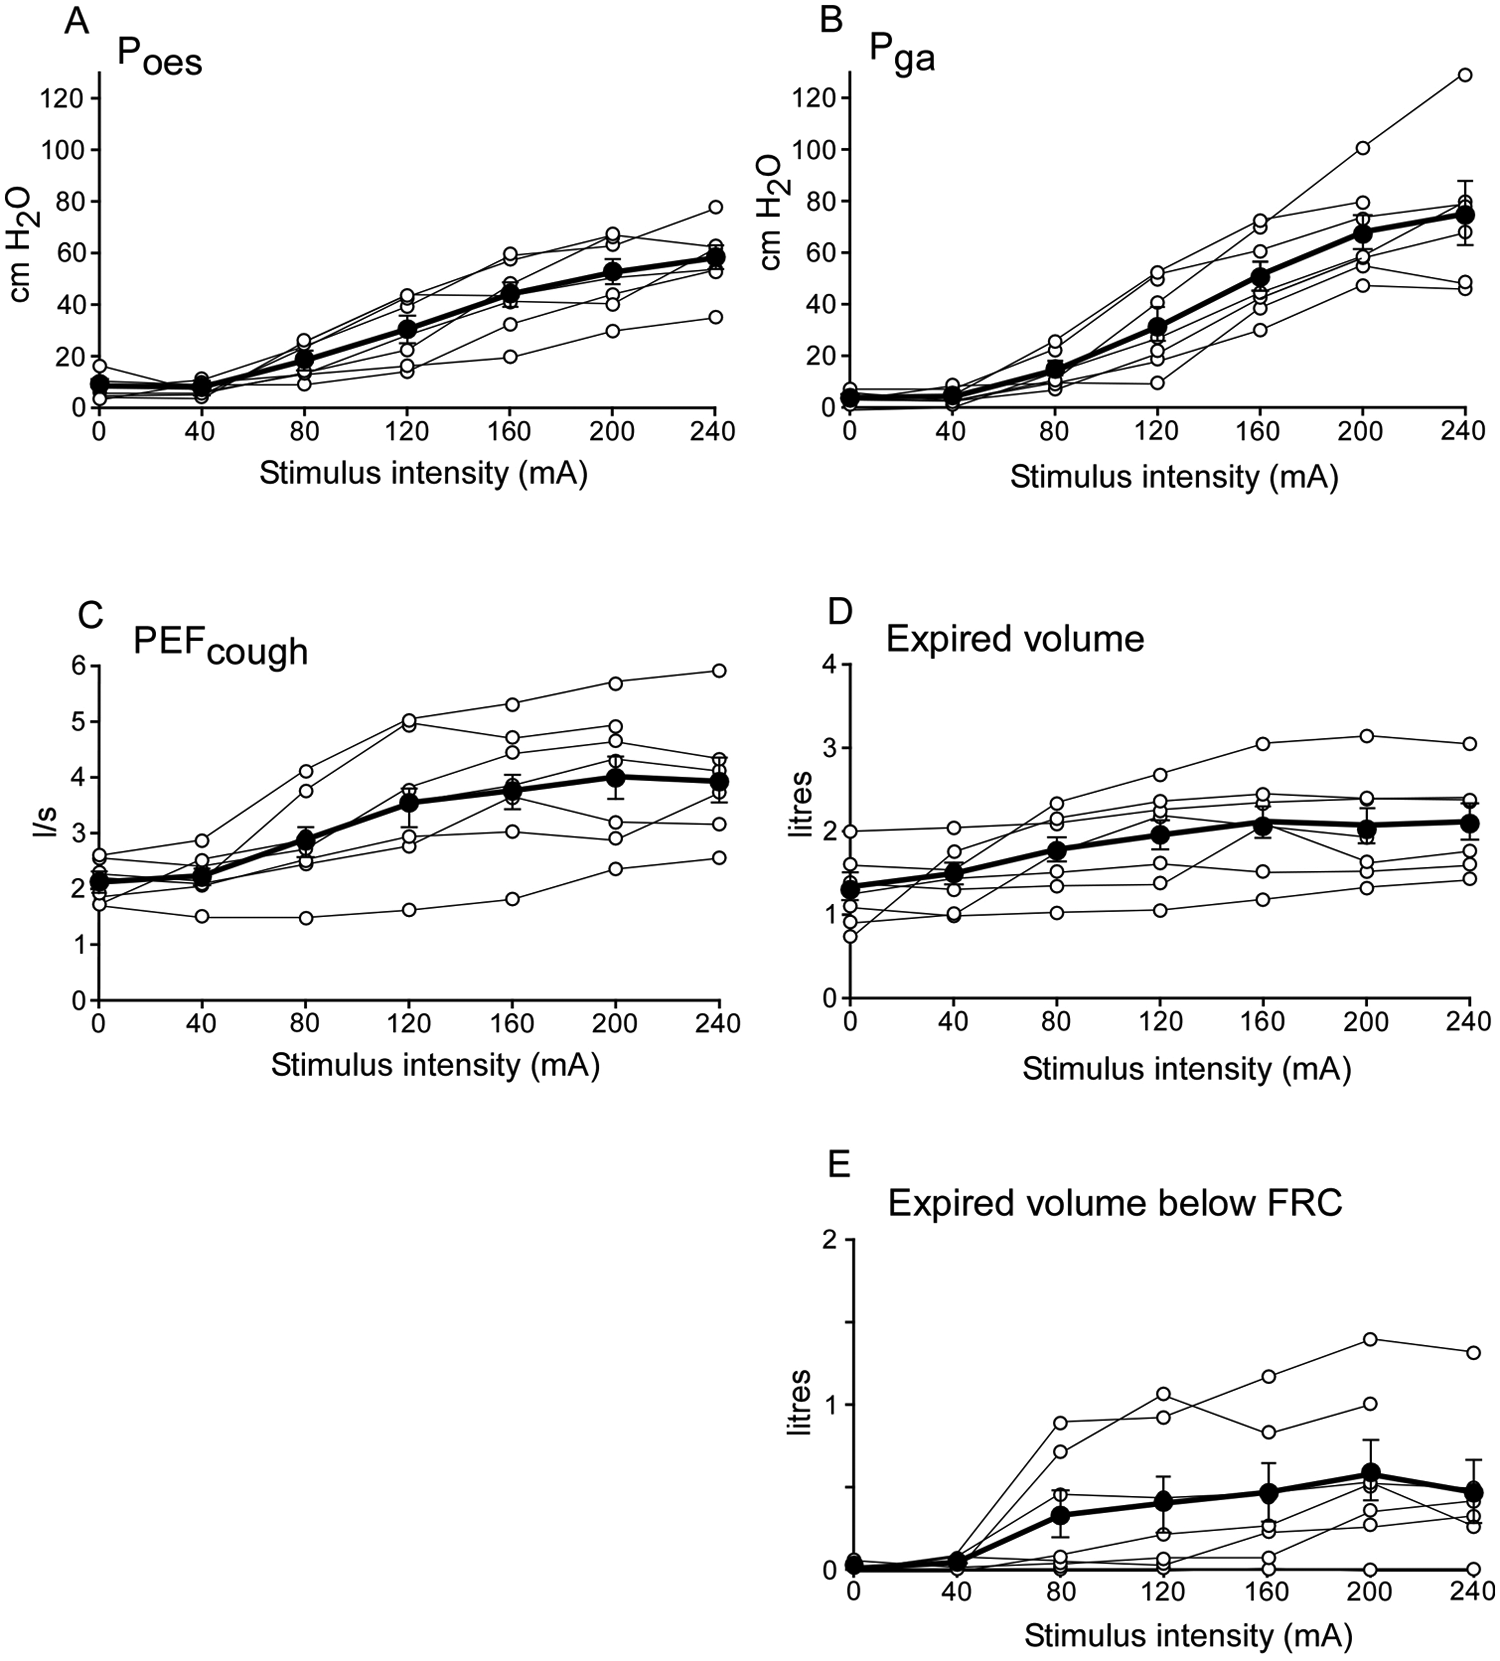
Effect of stimulus intensity on cough pressures, flow, and volumes during voluntary coughs with stimulation over the thoracoabdominal wall. A and B. Cough pressures (Pes, Pga). C. Peak expiratory flow (PEFcough). D. Total expiratory cough volume. E. Expiratory cough volume below functional residual capacity (FRC) during a voluntary cough with electrical stimulation over the thoracoabdominal wall (0-240 mA). The filled circles show the group mean ± standard error of the mean, and open circles show the individual data for the 7 patients for each stimulus intensity, connected by lines. Group data are only shown to a stimulation intensity of 240 mA, because only 3 patients were stimulated with higher intensities (280, 320, and 480 mA). Note that 1 patient reached a plateau in PEFcough relatively early and, therefore, did not receive a stimulus train at 240 mA; 3 patients required higher intensities to reach a plateau in PEFcough and, therefore, appear to have not yet reached their respective PEFcough plateaux.
Group data are shown in Figure 4, but only to a stimulation-train intensity of 240 mA because only 3 patients were stimulated with higher intensities (up to 280, 320, and 480 mA); 1 patient was stimulated only up to 200 mA. As stimulus-train intensity increased, the evoked increments in Pga, Pes, PEFcough, and expiratory volumes increased (P < .001). Pga and Pes increased progressively with stimulus intensity (Figures 4A and 4B) and did not reach a plateau (except Pes in 1 patient at 400 mA, 50-Hz train). Across all patients, up to 240 mA, the mean Pga in a cough with stimulation reached 74.6 ± 12.2 cm H2O. The Pga during the stimulated cough was significantly greater (from trains of stimuli at 120 up to 240 mA) than the Pga produced in a cough without stimulation (4.2 ± 1.0 cm H2O, P < .05 Dunnett’s post hoc comparison). The Pes across all patients reached 58.4 ± 3.8 cm H2O. The Pes produced during stimulated coughs was greater (from 120 up to 240 mA) than the Pes produced without stimulation (8.8 ± 1.5 cm H2O, P < .05).
PEFcough increased with stimulus-train intensity and reached a plateau in all patients at a mean of 211 ± 29 mA (range = 120-360 mA, Figure 4C). PEFcough with stimulation reached a plateau at 4.0 ± 0.4 L/s and was significantly greater (from 80 up to 240 mA) than PEFcough without stimulation (2.2 ± 0.1 L/s, P < .05). The total expiratory volume during the cough with stimulation was greater than that without stimulation (1.3 ± 0.2 L) from 80 up to 240 mA (P < .05) and reached 2.1 ± 0.2 L. Expiratory volume below FRC increased with stimulus-train intensity in 6 of 7 patients; this plateaued at 180 ± 20 mA in 4 patients but did not reach a plateau in 2 patients (Figure 4E). The mean expiratory volume below FRC during the coughs increased progressively from zero with no stimulation to a peak of 0.6 ± 0.2 L (Figure 4E). The expiratory volume below FRC was significantly greater during stimulated coughs (from 120 up to 240 mA) than during unstimulated coughs (P < .05).
Figure 2 combines data from single stimuli and trains of stimuli. It depicts the Pga and Pes twitch pressure in response to a single stimulus for each patient measured with the muscles relaxed at near FRC. The filled circles indicate the stimulus-train intensity at which PEFcough reached a plateau in a voluntary cough from near TLC. The mean stimulus-train intensity required for PEFcough to reach a plateau for the 7 patients was just 40% ± 7% of the single-stimulus intensity required to produce the maximal Pga twitch pressure at rest (550 ± 33 mA). Pes in a cough only reached a plateau in 1 patient at 400 mA (50 Hz train), which was the same intensity that produced a maximal Pga twitch at rest at FRC in this patient. However, Pga during the cough did not reach a plateau in any patient with the range of stimulus-train intensities used. The mean Pga and Pes when the PEFcough reached a plateau were 61.5 ± 3.6 cm H2O and 51.1 ± 3.5 cm H2O, respectively, but increased further to 83.0 ± 8.0 cm H2O for Pga and 66.1 ± 5.6 cm H2O for Pes with the higher intensities despite no further increase in PEFcough. This was produced with mean stimulation-train intensities of 280 ± 38.1 mA (range = 160-480 mA), although it should be noted that the maximal stimulation intensity used for the trains was dependent for most patients on the intensity that had produced a PEFcough plateau.
Discussion
Coughs evoked by posterolateral electrical surface stimulation over the thoracoabdominal wall in individuals with cervical SCI during a voluntary cough improved as stimulus-train intensity increased. The improvement in cough was reflected by increased expiratory pressures, flow, and volumes. The pressure produced by the contraction of the abdominal muscles (Pga) increased progressively with stimulus intensity up to ~83 cm H2O but never reached a plateau. This was because the intensities used in most patients were well below those required to produce a maximal Pga twitch. The intrathoracic pressure produced also increased with stimulus intensity up to ~66 cm H2O and only reached a plateau in one patient in whom stimulus intensities evoked a maximal Pga twitch and the stimulus was likely to be evoking a near-maximal Pga during the cough.
Although both gastric and esophageal expiratory pressures continued to rise with stimulus intensity, the PEFcough reached a plateau of around 4 L/s, at a relatively low stimulus intensity compared to that required to produce maximal force in the abdominal muscles. This plateau in expiratory flow in the absence of a plateau in expiratory pressure may be explained by dynamic airway compression, in which the diameter of the airways is reduced because of the high intrathoracic positive pressure developed during the cough that limits the peak expiratory flow.26-28 When the pressure surrounding the airways is greater than the pressure within the airways, the cross-sectional area of the airway is reduced, and the airways narrow. The benefit of dynamic airway compression in cough is that it produces higher airflow velocities though the narrowed airways for a given flow at the mouth. 27 As linear velocity increases, the kinetic energy of the airflow increases in proportion to the square of the velocity. 27 In addition, turbulence of expiratory flow increases in compressed airways, and this also helps dislodge and clear airway mucus.29,30 The mean intrathoracic pressure required to reach a plateau in PEFcough in the current study was ~51 cm H2O (with 211 mA stimulation). At this pressure, the cross-sectional area of the trachea would be estimated to be reduced by ~50% (calculated from reference Estenne et al 26 ). Therefore, individuals with cervical SCI may have the ability to produce an effective cough beyond the point of dynamic airway compression with the use of timed surface electrical stimulation of the abdominal muscles combined with a voluntary cough effort. Overall, PEFcough and total expiratory volume reached a plateau at similar stimulus intensities. Most of the change in expiratory volume in the stimulated coughs is a result of the volume expiratory flow below FRC because of contraction of the abdominal muscles. An alternative explanation for the plateau in flow might be that the stimulation failed to recruit the abdominal muscles maximally. This may explain why the peak flows in the current study reached only ~4 L/s compared with ~9 L/s in other studies.17,18 However, we did not see a plateau in expiratory pressures, which makes this alternative unlikely.
In this study, we have used stimulus intensities that produce a plateau in PEFcough. This intensity is equivalent to only ~40% of the stimulus intensity required to produce maximal abdominal force output (211 mA, 50-Hz train for PEFcough plateau vs 550 mA single pulse for maximal Pga twitch pressure). The intensities used to evoke cough here may seem high; in fact, the current density is relatively low. Over the large electrode area (50 × 180 mm2 = 9000 mm2), the highest intensity we used for the trains was 480 mA. This results in a current density of 0.053 mA/mm2, comparable to an ~17-mA stimulus through a standard 20-mm diameter circular electrode. We did not use even higher intensities in the trains of stimuli to avoid any side effects of the stimulation, including elevated blood pressure (caused by autonomic dysreflexia) as well as the possibility of local cutaneous effects caused by the stimulus current. Despite this, the mean maximal expiratory abdominal pressures produced were relatively large (Pga = 83 cm H2O and Pes = 66 cm H2O), larger than those in any other study using surface electrical stimulation.7,10,23 However, they are only about half of those that can be achieved in able-bodied individuals performing a maximal voluntary cough (up to Pga = 180 cm H2O and Pes = 140 cm H2O), using the same experimental setup in our laboratory, and those reported using implanted lower-thoracic spinal cord stimulation (airway pressure up to 150 cm H2O). 17 Nevertheless, the expiratory pressures produced in the current study resulted in increased PEFcough (4 L/s) and, as we propose, a substantial estimated airway compression. It is notable that at the intensities used here, many of the patients were able to cough up mucus and secretions during the stimulated coughs and had normal-sounding coughs.
Because we have compared the stimulus intensities used during the trains applied in the coughs from TLC with the single pulses delivered at rest at FRC, there may be some error resulting from the movement of the stimulating electrodes with the different lung volumes. However, because of the large size of electrodes overlying the various nerves that innervate the abdominal muscles, this error is likely to be small. The differences in intensity required across patients depend on individual patient differences, including distance from the skin surface to the target nerves and differences in abdominal muscle strength.
Overall, we have shown that surface electrical stimulation using the posterolateral electrode placement over the thoracoabdominal wall can substantially improve expiratory pressures, flows, and volumes during voluntary coughs in individuals with cervical SCI. Our data suggest that the stimulus-train intensity could be tailored on an individual basis to that at which PEFcough reaches a plateau. This would mean that coughs that are likely to be effective in removing secretions could be evoked without the need of measuring intra-abdominal and intrathoracic pressures invasively.
Footnotes
Declaration of Conflicting Interests
The authors declared no potential conflicts of interest with respect to the research, authorship, and/or publication of this article.
Funding
The authors disclosed receipt of the following financial support for the research, authorship, and/or publication of this article: Supported by the Laurie Cowled Scholarship, the NSW Office of Science and Medical Research Spinal Cord Injury Grant Program, and the National Health and Medical Research Council (of Australia). National Health and Medical Research Council of Australia provided fellowships for JEB and SCG. Office of Science and Medical Research NSW Australia supported the project Laurie Cowled scholarship that supported RAMcB.