
Abstract
Background. Respiratory complications in people with high-level spinal cord injury (SCI) are a major cause of morbidity and mortality, particularly because of a reduced ability to cough as a result of abdominal muscle paralysis. Objective. We investigated the effect of cough training combined with functional electrical stimulation (FES) over the abdominal muscles for 6 weeks to observe whether training could improve cough strength. Methods. Fifteen SCI subjects (C4-T5) trained for 6 weeks, 5 days per week (5 sets of 10 coughs per day) in a randomized crossover design study. Subjects coughed voluntarily at the same time as a train of electrical stimulation was delivered over the abdominal muscles via posterolaterally positioned electrodes (50 Hz, 3 seconds). Measurements were made of esophageal (Pes) and gastric (Pga) expiratory pressures and the peak expiratory flow (PEFcough) produced at the 3 time points of before, during, and after the training. Results. During voluntary coughs, FES cough stimulation improved Pga, Pes, and PEFcough acutely, 20-fold, 4-fold, and 50%, respectively. Six weeks of cough training significantly increased Pga (37.1 ± 2.0 to 46.5 ± 2.9 cm H2O), Pes (35.4 ± 2.7 to 48.1 ± 2.9 cm H2O), and PEFcough (3.1 ± 0.1 to 3.6 ± 0.1 L/s). Cough training also improved pressures and flow during voluntary unstimulated coughs. Conclusions. FES of abdominal muscles acutely increases mechanical output in coughing in high-level SCI subjects. Six weeks of cough training further increases gastric and esophageal cough pressures and expiratory cough flow during stimulated cough maneuvers.
Keywords
Introduction
After high-level spinal cord injury (SCI), paralysis of the abdominal muscles reduces the ability to cough, particularly with injuries higher than T7. This reduced ability to develop the sufficient expiratory muscle force for a productive cough can lead to a buildup of pulmonary secretions resulting in respiratory compromise, and an increased risk of atelectasis, pneumonia, and ventilatory failure. As a result, respiratory complications are the major cause of morbidity and mortality in acute SCI. 1 Current techniques to generate cough artificially include an assisted cough administered by a physiotherapist or trained carer,2-5 or the use of a mechanical insufflation/exsufflation device that produces passive lung inflation followed by a sudden negative airway pressure to remove air, and thus remove excess secretions, from the lungs. 6 However, delivery of both techniques require another, often skilled, individual to assist, and both can be expensive.
Functional electrical stimulation (FES) has been applied after spinal cord injury to evoke hand grip, assist walking and standing, and improve bladder function. 7 Several studies have examined the use of stimulation of the abdominal muscles to help restore an effective cough, with the aim to improve respiratory health in SCI. These include surface electrical stimulation over the abdominal wall,3,8-13 magnetic stimulation over thoracic nerve roots,14-19 and more recently, implanted spinal cord stimulation at T9 to L1. 20
Furthermore, FES applied repeatedly to paralyzed muscles can improve muscle strength and endurance. These improvements in strength can be assessed by a shift in the force–frequency curve 21 increased muscle blood supply22-24 and shifts toward more fatigue-resistant muscle fiber properties.23,25-27
Recently, we introduced posterolateral surface stimulation of the intercostal nerves to increase abdominal pressure and cough in people with high-level SCI. 13 The evoked cough pressures using this electrode placement were higher than those evoked by other forms of surface electrical stimulation and comparable to these evoked by magnetic stimulation over T10. This form of stimulation, which can be operated independently, offers the possibility to train the abdominal muscles of people with SCI. Therefore, we undertook a six-week training study with the hypothesis that cough training combined with FES would increase voluntary cough pressures both with and without stimulation in people with SCI.
Methods
Potential participants were subjected to pre-evaluation screening to assess they could tolerate the stimulation. Data were collected from 15 healthy male subjects with spinal cord injury; all with compromised cough (Table 1). Subjects were selected if their injury resulted in motor impairment at the level of T6 or higher based on clinical assessment of their neurological impairment. Subjects were assessed in accordance with the American Spinal Injury Association Impairment Scale (AIS). 28 All procedures were approved by the University of New South Wales and the Prince of Wales Hospital Human Research Ethics Committees and conformed with the Declaration of Helsinki.
Subject Data and Baseline Respiratory Measurements. a
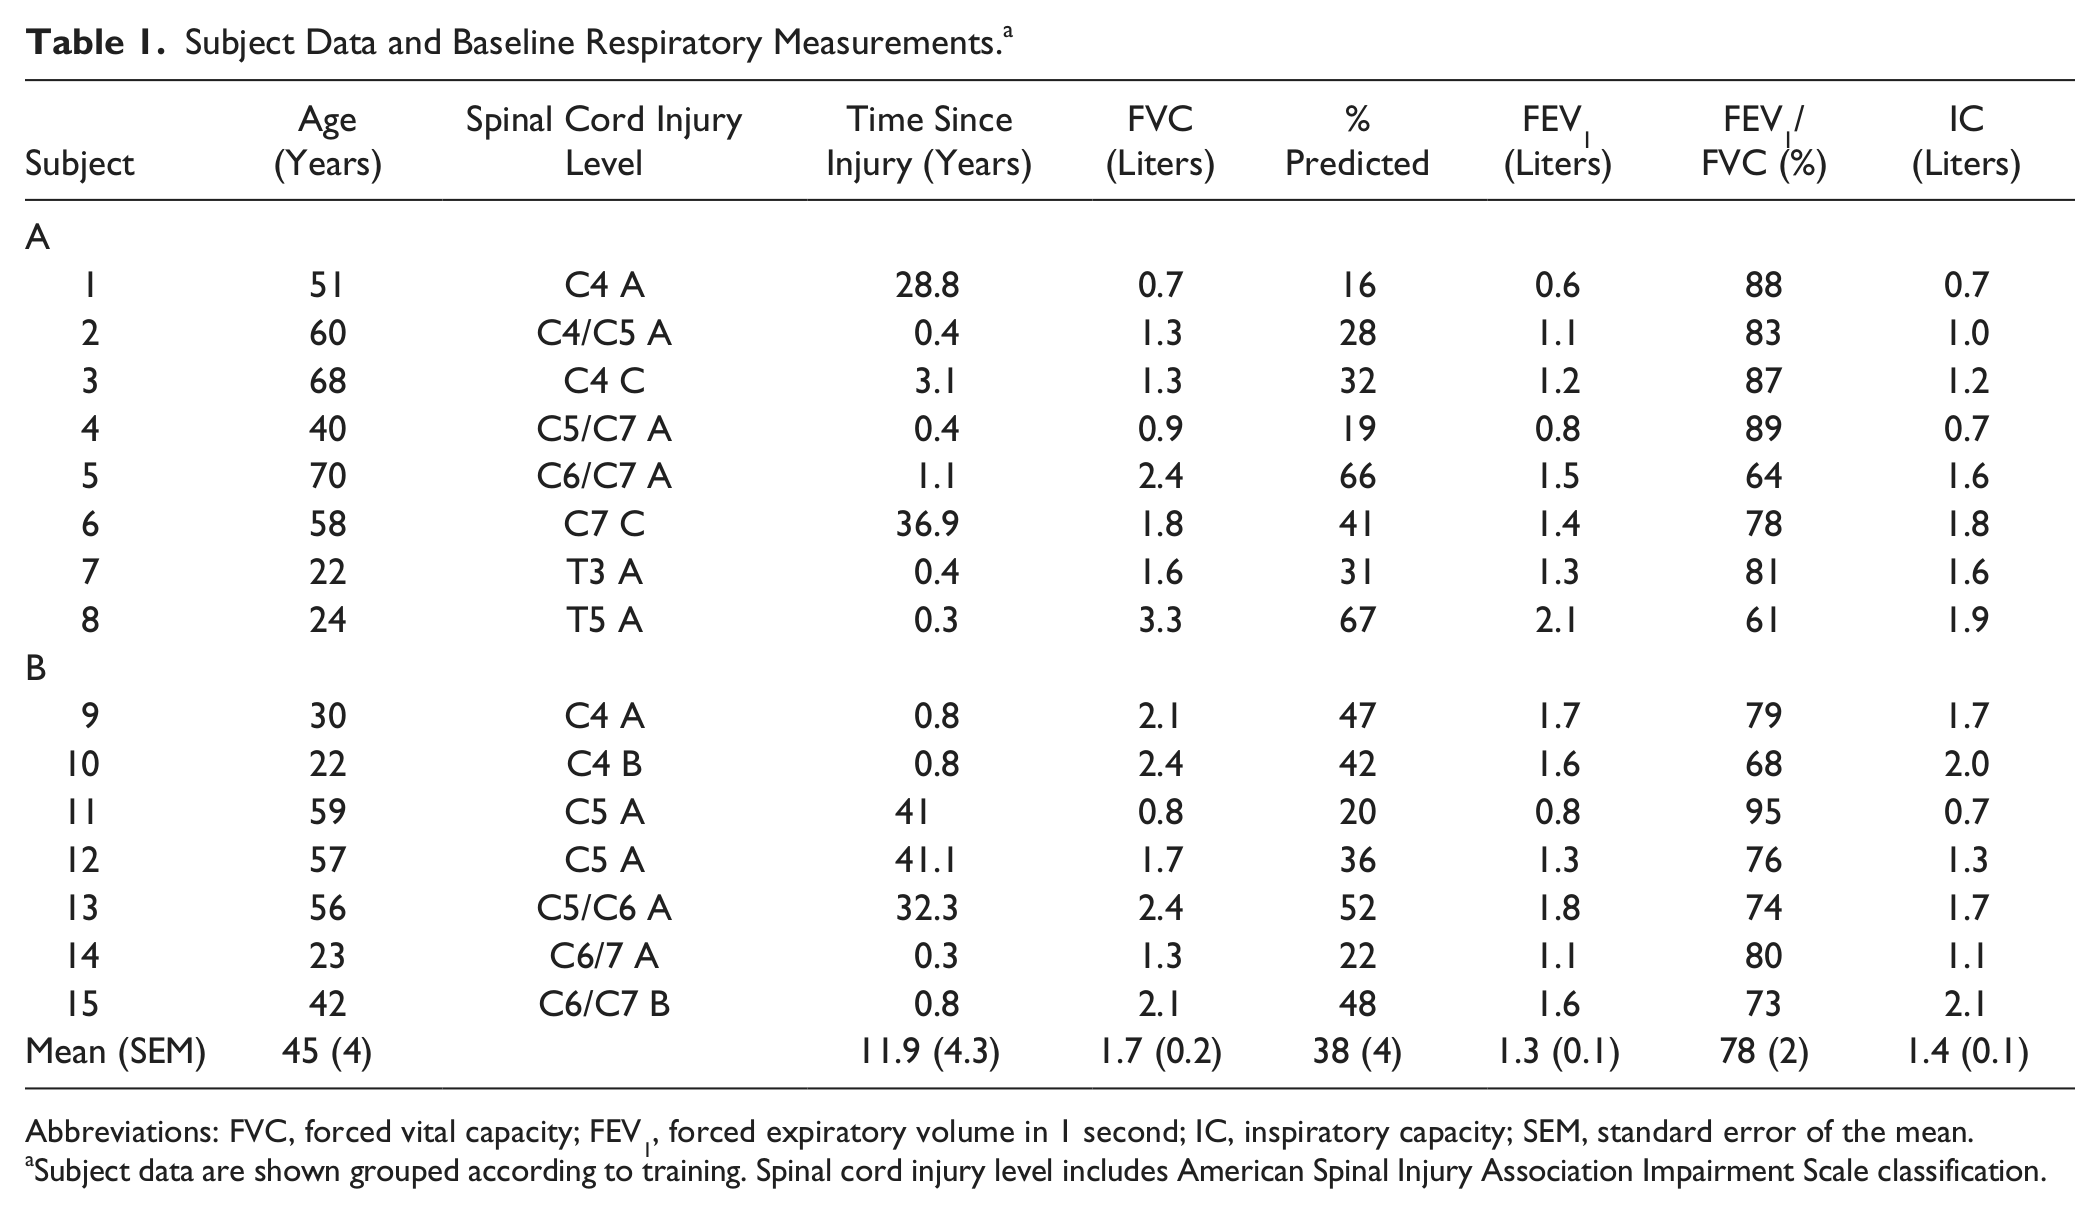
Abbreviations: FVC, forced vital capacity; FEV1, forced expiratory volume in 1 second; IC, inspiratory capacity; SEM, standard error of the mean.
Subject data are shown grouped according to training. Spinal cord injury level includes American Spinal Injury Association Impairment Scale classification.
General Protocol
In brief, the study was designed as a 12-week randomized crossover study in which subjects were randomly assigned to 1 of 2 groups for 6 weeks of cough training. Group A underwent training in the first period of 6 weeks and group B underwent training in the second period of 6 weeks (Figure 1B). All subjects visited the laboratory on 3 occasions at week 0 (baseline), week 6, and week 12.
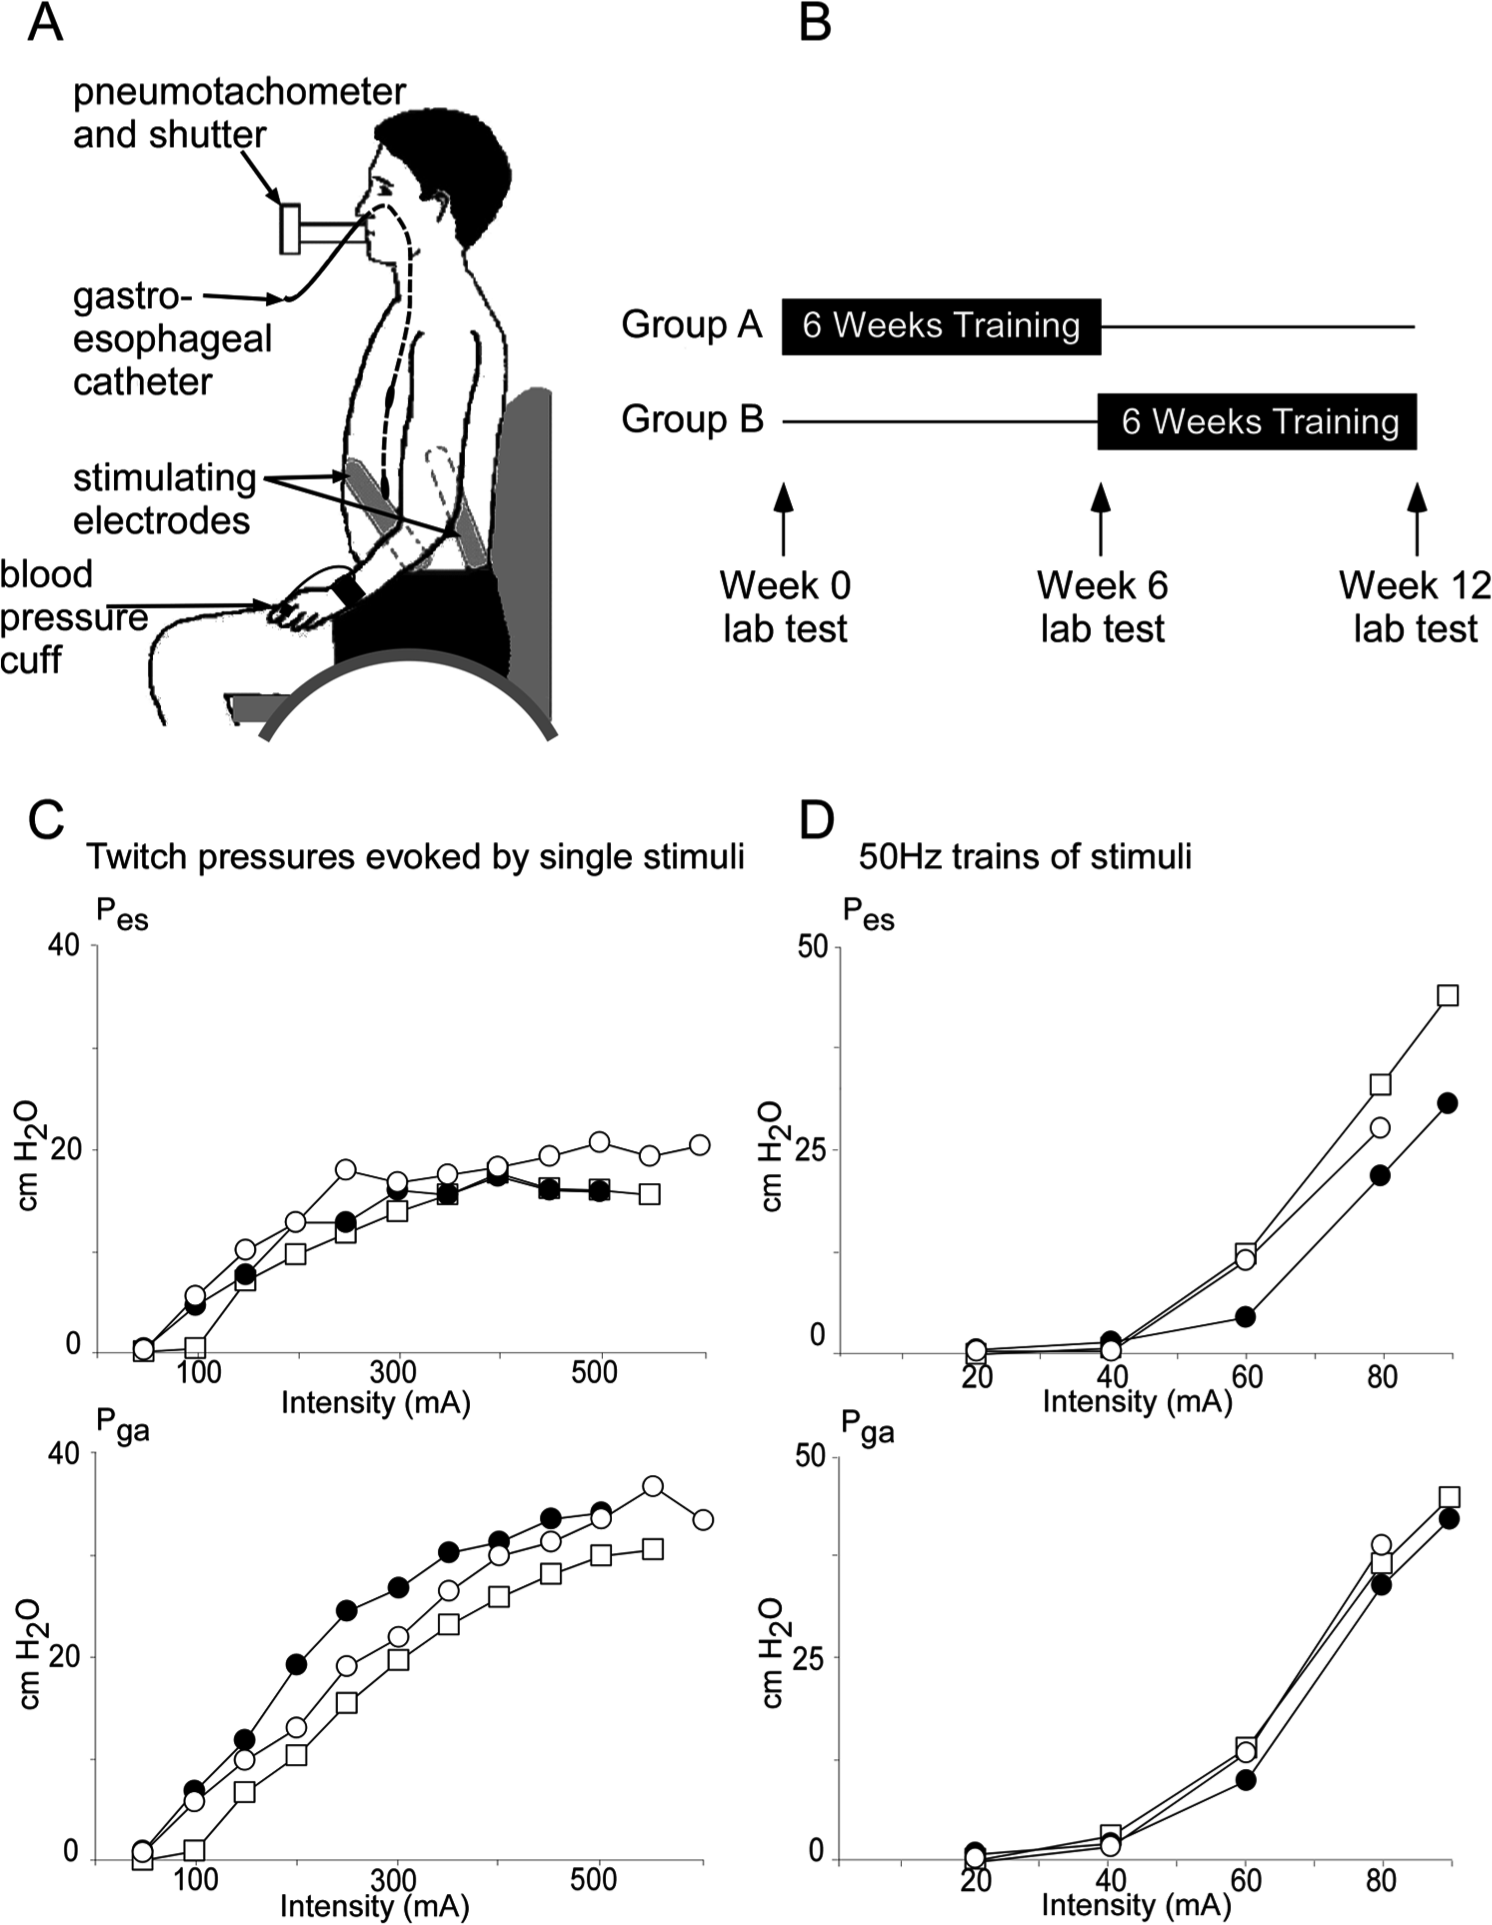
Set up, training protocol, and recruitment curve. Panel A shows the subject seated in their wheelchair, breathing through a mouthpiece. Pes and Pga (esophageal and gastic expiratory pressures, respectively) were measured by a gastroesophageal catheter. Stimulating plate electrodes were placed symmetrically on both sides of the abdomen. Panel B shows the crossover design of the study and the timing of the laboratory measurements collected at week 0 (baseline), week 6, and week 12. For panels C and D, the closed circles represent the pressures at baseline, open circles posttraining, and open squares after no training. Panel C shows the recruitment curve of twitch pressures for both Pes and Pga from a single subject in response to single stimuli during relaxation at functional residual capacity (FRC). Panel D is the recruitment curve for both Pes and Pga from a single subject in response to 50 Hz (1-second duration) trains of stimuli delivered during relaxation at FRC up to 40 cm H2O Pga.
Laboratory Protocol
Studies were performed while subjects were seated in their wheelchair and breathing through a mouthpiece. At each visit we measured basic lung function (see Table 1), including inspiratory capacity (IC), vital capacity (VC), forced vital capacity (FVC), forced expiratory volume in 1 second (FEV1), and peak expiratory flow (PEF). FVC and slow VC maneuvers were repeated 3 times each. IC measures were taken from the slow VC maneuvers. Air flow was measured through a pneumotachometer, and the signal was integrated online to give volume. A gastroesophageal catheter mounted with pressure transducers was inserted via the nose (CTG-2, Gaeltec Ltd, Dunvegan, UK). One transducer was located in the stomach to record gastric (abdominal) pressure (Pga), the other transducer was located 20 cm rostrally, and recorded esophageal (thoracic) pressure (Pes). In addition, blood pressure was monitored continuously via a Portapres system (FMS, Finapres Medical Systems BV, Amsterdam, Netherlands) with the pressure cuff around the left middle finger. All signals were digitized (1401 Plus, CED Limited, Cambridge, UK) and stored on a computer (sampling rate 2000 Hz).
Stimulation
Two flexible, reusable multistick gel electrodes (10 × 18 cm, multistick gel electrodes, Axelgaard Manufacturing Co, Ltd, Fallbrook, CA) were halved (5 × 18 cm), then placed bilaterally on the thoracoabdominal wall, in the posterolateral position optimal for abdominal muscle stimulation as described in our previous studies12,13 (Figure 1A). Initially, the recruitment of the abdominal muscles was assessed by single stimuli, while the muscles were relaxed at end expiration, that is, at about functional residual capacity (FRC). Two pulses (rectangular stimuli, 0.2-ms duration) were delivered bilaterally 4 seconds apart in 50-mA increments, starting at 50 mA, and increased until the gastric twitch pressure reached a plateau at its maximum. Then, trains of 50-Hz stimuli were applied bilaterally for one second to tetanically contract abdominal muscles while they were relaxed at FRC. Stimulus intensity was increased in 20-mA increments, starting from 20 mA until Pga reached 40 cm H2O during the train. This intensity increases expiratory pressures and flow in the patients during a cough but is relatively low compared with the intensity required to produce a maximal pressure twitch. 13 This stimulus intensity was then used for the remainder of the protocol as well as for the cough training (see below).
Trains of stimuli were delivered bilaterally at 50 Hz for a duration of 1 second (at an intensity that produced ~40 cm H2O at rest at FRC as described above) and were timed with verbal cues to cough so that stimulation began ~250 ms before the start of the expulsive phase of the cough. 13 Subjects then performed a series of maximal coughs from at or near total lung capacity. Subjects first performed maximal voluntary coughs (without stimulation), then voluntary coughs combined with abdominal muscle stimulation. Each cough type was repeated three times. Figure 2 shows examples of the recordings made in a single subject during coughs with and without stimulation.
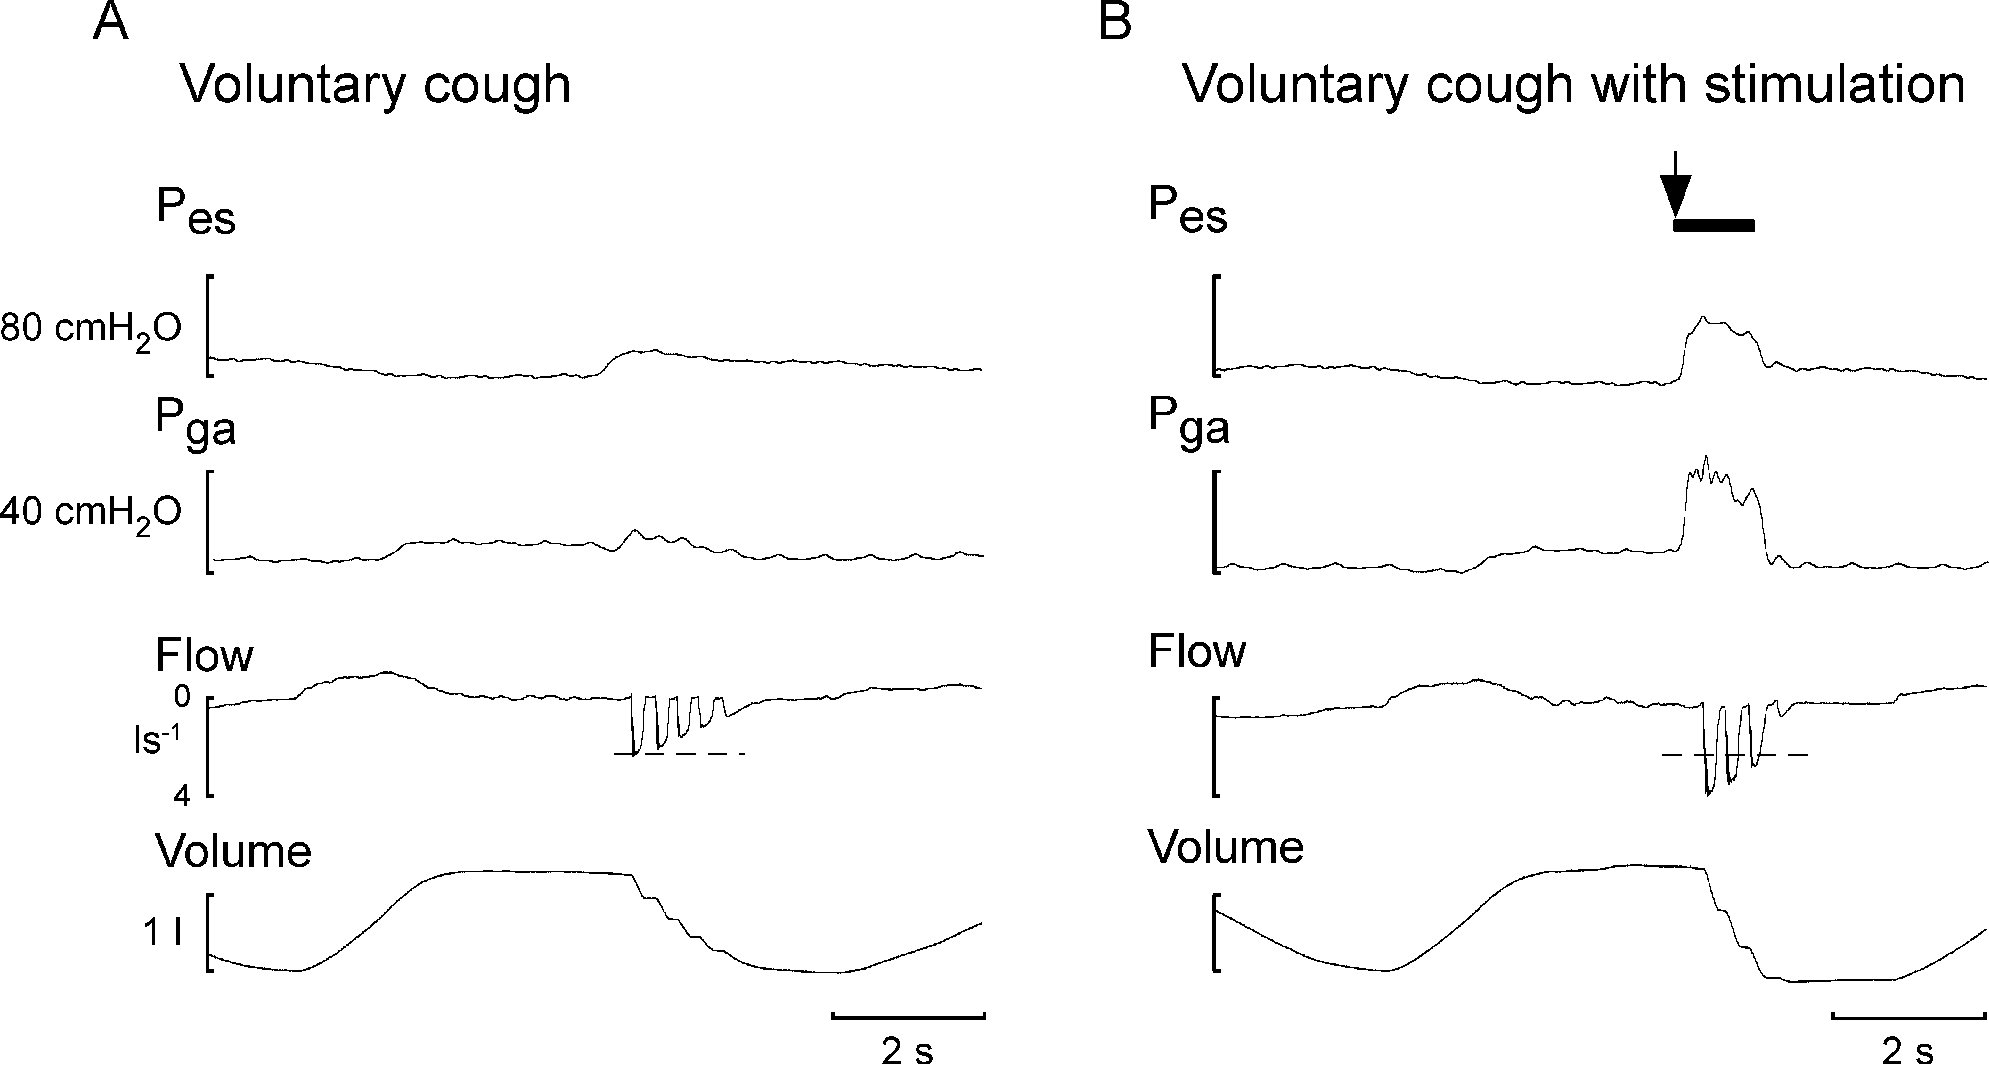
Unstimulated and stimulated cough traces from single subjects. Panel A shows a typical unstimulated voluntary cough from a single subject (spinal cord injury level T3 American Spinal Injury Association Impairment Scale A). Panel B shows a voluntary cough with electrical stimulation from the same subject. The horizontal dotted line indicates the peak expiratory flow in the voluntary cough without stimulation. The black bar indicates the period of 50 Hz electrical stimulation of abdominal muscles. Pes and Pga are the esophageal and gastic expiratory pressures, respectively.
The same protocol was repeated in the laboratory at week 6 and week 12. Each time we determined the maximal twitch pressures and the stimulus intensity for the 1-second train to produce ~40 cm H2O at rest at FRC. This intensity was then used for the cough testing even if it differed from that used in previous sessions to control for any potential differences in electrode placement or conductance.
The electrical stimulation did not cause side effects such as local redness and although blood pressure often increased during multiple cough efforts, (see below), there were no symptoms of autonomic dysreflexia in any of the subjects, during the laboratory measurements or the training sessions.
Training Sessions
Subjects were trained at their place of residence or in hospital 5 days a week for 6 weeks. Group A had training in the first period of 6 weeks, and group B had training in the second period of 6 weeks (Figure 1B). Training comprised 5 sets of 10 maximal voluntary coughs with stimulation (a total of 50 stimulated coughs). Stimulated coughs were timed with ~7 seconds between each cough. Stimulus parameters for the training were set with the same intensity that was used in the lab visit preceding the cough training (see above), except that the duration of the 50-Hz stimulus train was 3 seconds. Subjects completed each set of 10 stimulated coughs without a break with a 3- to 5-minute break between each set. Blood pressure was monitored continually throughout the training protocol the Portapres system (see above) for the duration of the training sessions. Resting blood pressure was noted at the completion of each set of ten stimulated coughs. Blood pressure often increased with cough efforts but returned to baseline levels between sets. If systolic blood pressure measured at the finger rose (>200 mm Hg), subjects were given a longer break between sets to allow it to return to baseline levels.
Analysis and Statistics
Measurements were made from raw data recorded during laboratory testing at weeks 0 (baseline), 6, and 12. For the twitches produced by single stimuli, the twitch pressure for Pes and Pga was measured for each intensity and the maximal value for each week was compared with a one-way repeated-measures analysis of variance. For trains of stimuli, the intensity of stimulation used to produce ~40 cm H2O Pga at FRC and the peak actual Pes and Pga were also compared with a one-way repeated-measures analysis of variance. In the text, these values are given as before and after training with data for group A and B combined. For the cough, we measured the increase in Pes and Pga produced, and the peak expiratory cough flow (PEFcough). For each subject, the values for the 3 repetitions of each measure were averaged. These measures (one value for each variable for each subject) were compared with a general linear model (SPSS) analysis of variance on raw data with stimulation (with or without), time (week 0, 6, or 12), and group (A or B) as factors. Post hoc comparisons were performed using Tukey’s test method. Paired Student’s t tests were used to assess the effect of training on lung function with before and after training values for each group combined. Spearman’s rank correlation was used to examine the association between injury level and lung function and cough parameters before and after training. A P value of <.05 was taken to be of statistical significance. Data are expressed in text and figures as mean ± standard error of the mean. Figure 3 also shows individual data points.
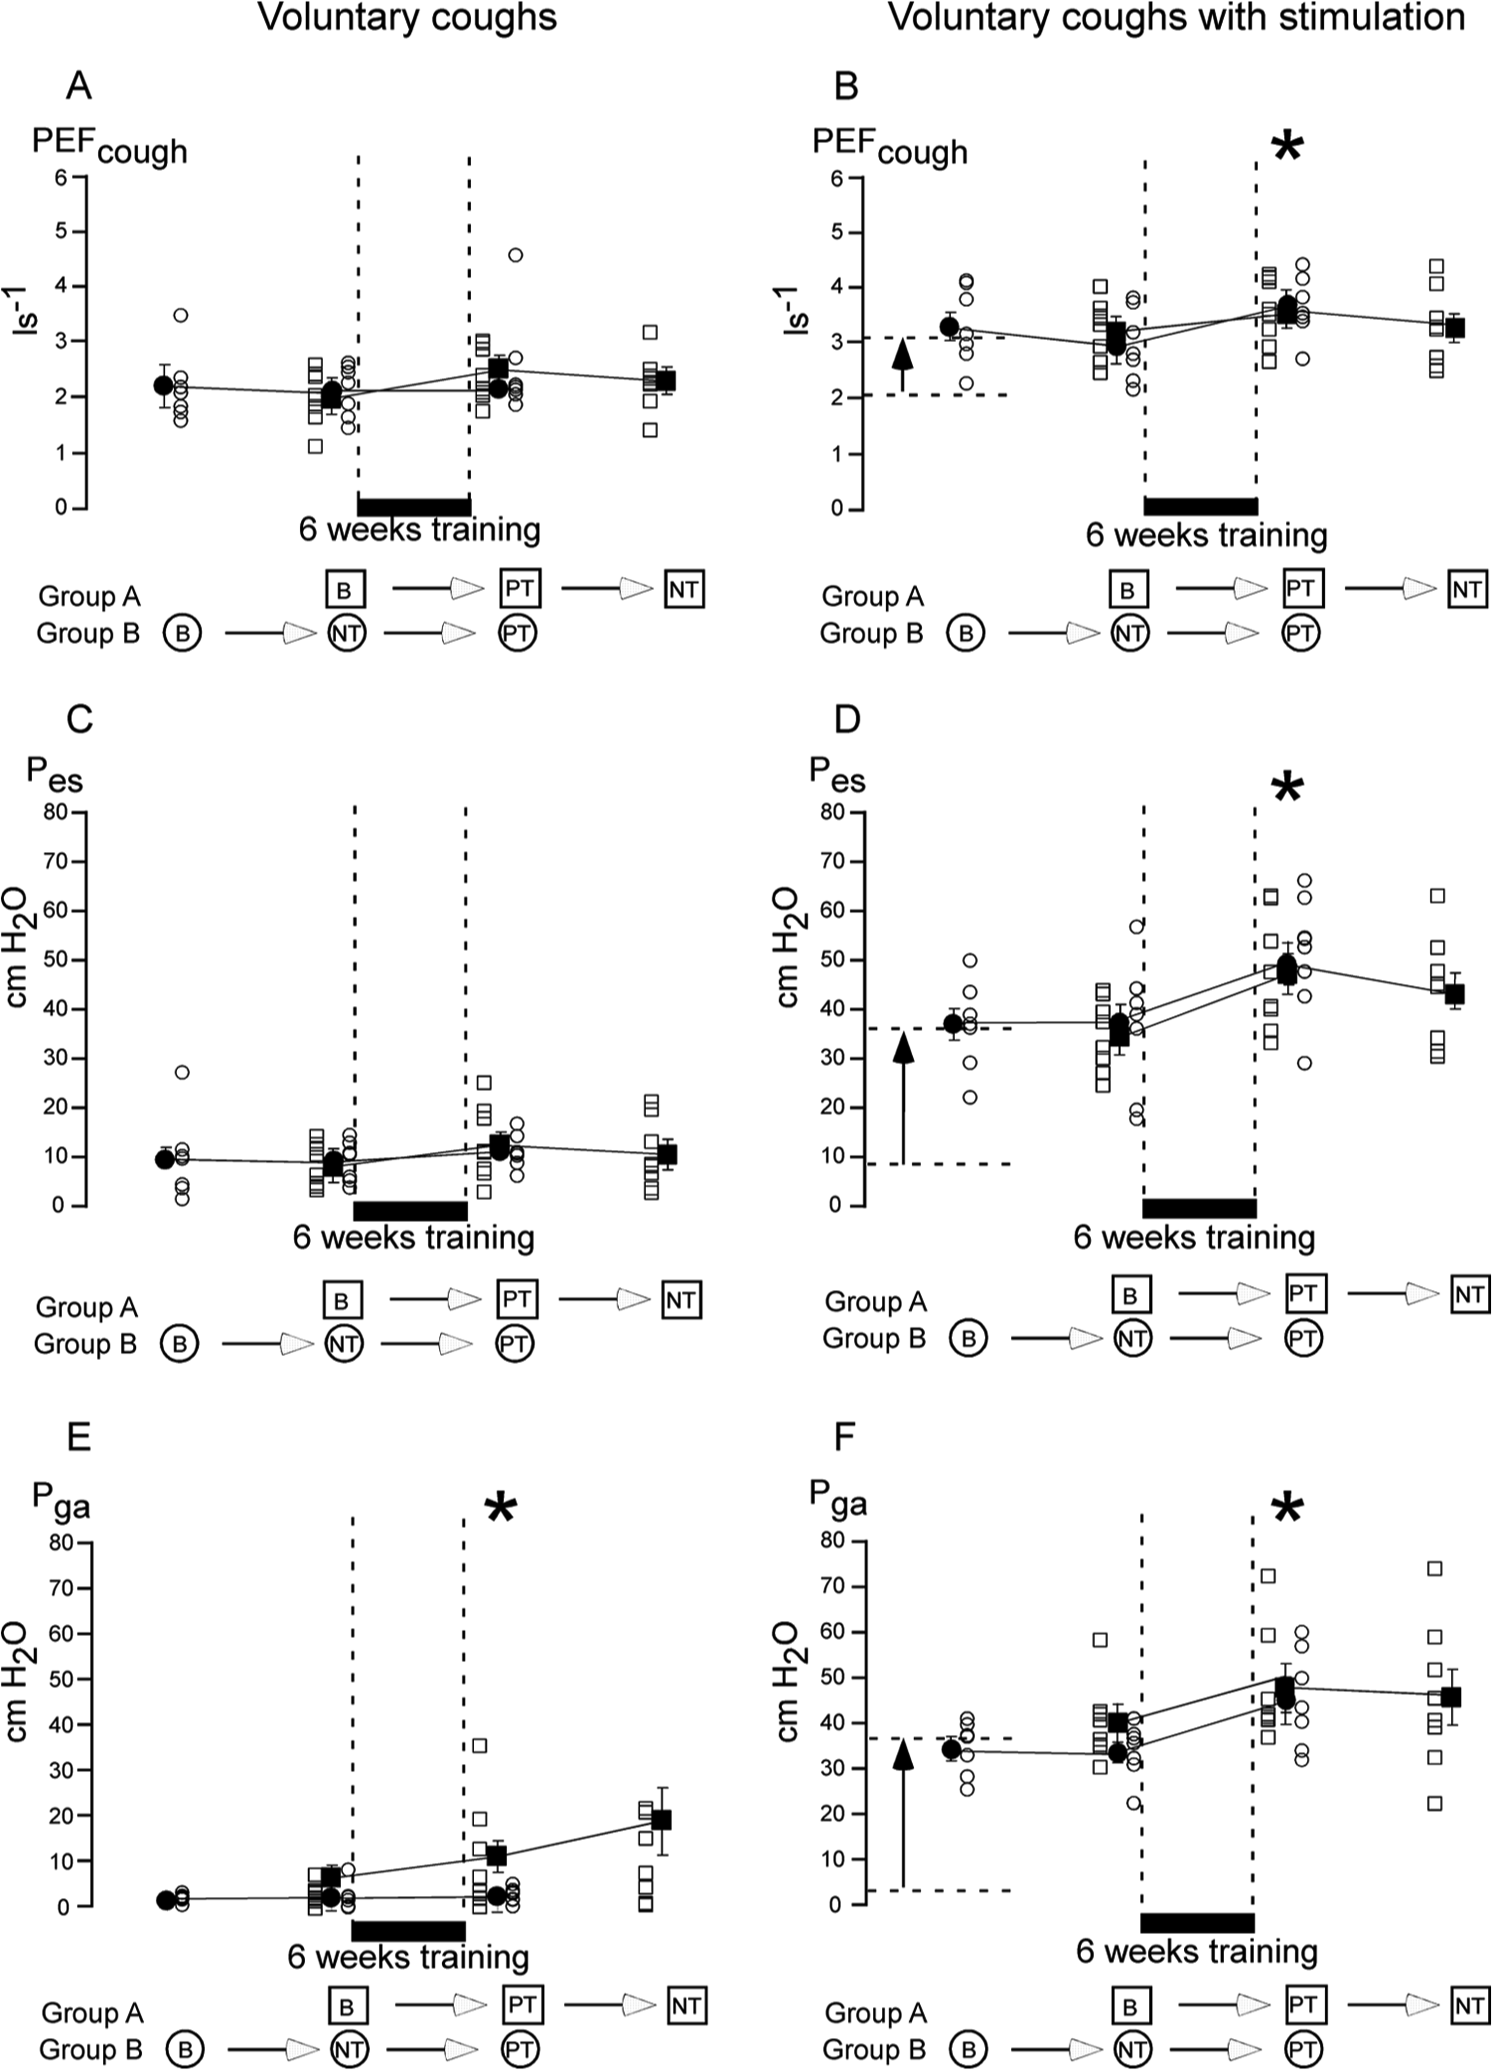
Cough measurements. Mean ± standard error of the mean for group A (closed squares) and group B (closed circles) recorded during voluntary coughs without stimulation (left panels A, C, and E) and with stimulation (right panels B, D, and F). Individual data are also shown for all subjects (group A, open squares; group B, open circles). The black bar indicates the 6-week cough training period between laboratory measurements. The order of laboratory and training for each group is shown under each panel (B = baseline, PT= posttraining, NT = no training).
Results
Subject Parameters
Twenty-one subjects were recruited and 15 were included in the final analysis. Of the 21 original subjects, 2 with significant residual sensation and 1 with known autonomic dysreflexia did not participate following a screening assessment. A further 2 subjects dropped out in the first week of training, 1 because of the increased sensation over the abdomen and 1 because of posttest discomfort. A further subject completed the first half of the study, including the training, but was not included in the final results because of technical difficulties with the gastroesophageal catheter. There were no major differences in time since injury and baseline lung function and cough variables between subjects in groups A and B (see Table 1).
The Effect of Training on Maximal Twitch Pressures
The resting twitch pressures, esophageal (Pes) and gastric (Pga), at laboratory visits increased with stimulus intensity. Figure 1C shows for a single subject the evoked twitch pressures up to maximum on each of the 3 laboratory days. Cough training did not alter the maximal twitch pressures (mean ± standard error of the mean before training for Pes 12.7 ± 1.5 cm H2O, Pga 21.0 ± 1.4 cm H2O, after training Pes 11.4 ± 1.0 cm H2O, Pga 22.8 ± 2.3 cm H2O, P = .36 and P = .35, respectively) with a Pes/Pga ratio of 0.60 before training and 0.50 after training (P = .38). Trains of 50-Hz stimuli were delivered to activate abdominal muscles such that 40 cm H2O of Pga was produced at rest at FRC. For all subjects, the electrical stimulation that produced a gastric pressure of 40 cm H2O was well tolerated. The intensities used to generate 40 cm H2O at each laboratory visit also did not differ significantly after training (mean before training 142.7 ± 10.9 mA, after training 142.7 ± 10.0 mA, P = 1).
Stimulation and Cough at Baseline
Voluntary coughs with abdominal muscle stimulation showed large acute increases in Pga, Pes, and PEFcough compared with voluntary coughs without stimulation. Pga improved a mean of 16-fold across subjects from 2 ± 0.6 to 37 ± 2 cm H2O (P < .01). Pes improved by a mean of 5-fold across subjects from 9 ± 1.1 to 35 ± 2.7 cm H2O (P < .01). The peak flow generated by the cough (PEFcough) increased by ~50% from 2.1 ± 0.1 to 3.1 ± 0.1 L/s (P < .01). These increases are depicted for a single subject in Figure 2 and for subjects in both groups A and B in Figure 3. Here, the arrows between the dashed lines at the left in panels B, D, and F indicate the acute effect of stimulation at baseline in the laboratory testing (compared with panels A, C, and E).
Cough Training
All training was supervised by an experimenter at each session. Thirteen of 15 subjects completed all 30 of the sessions. Two subjects completed 25 of the 30 sessions. Training sessions were well tolerated and no abnormal cutaneous responses to the electrodes or stimulation were observed.
After 6 weeks of cough training, voluntary coughs with no abdominal stimulation showed small but significant increases in abdominal pressure magnitudes but other changes were not significant. Pga doubled from 1.9 ± 0.6 to 3.9 ± 1.4 cm H2O, F(2, 42) = 4.20, P = .03; Pes increased by 37% from 8.9 ± 1.1 to 12.3 ± 1.5 cm H2O, F(2, 42) = 1.98, P = .16; and PEFcough increased by 15% from 2.1 ± 0.1 to 2.4 ± 0.1 L/s, F(2, 42) = 1.93, P = .17. In Figure 3A, C, and E, compare the middle sets of data points for each variable for each group. Table 2 shows the mean ± standard error of the mean values for all subjects before and after training.
Voluntary Coughs With and Without Stimulation. a
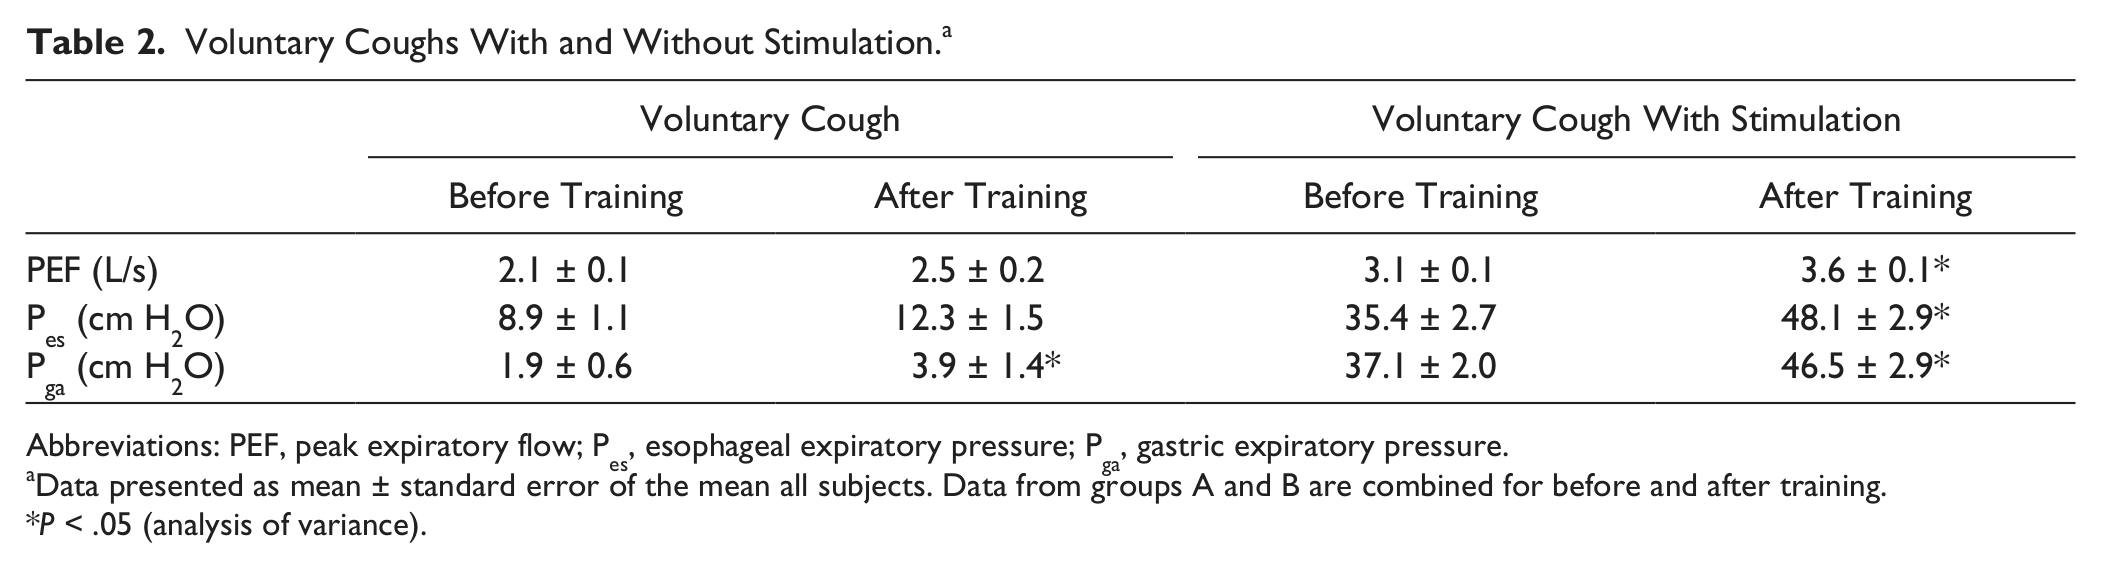
Abbreviations: PEF, peak expiratory flow; Pes, esophageal expiratory pressure; Pga, gastric expiratory pressure.
Data presented as mean ± standard error of the mean all subjects. Data from groups A and B are combined for before and after training.
P < .05 (analysis of variance).
In voluntary coughs combined with abdominal stimulation, Pga improved significantly with a mean increase of ~25% from 37.1 ± 2.0 to 46.5 ± 2.9 cm H2O, F(2, 42) = 7.26, P = .003 (Figure 3F, Table 2) despite the adjustment of the stimulus intensity at rest to produce ~40 cm H2O at FRC. Pes also increased by 36% from 35.4 ± 2.7 to 48.1 ± 2.9 cm H2O, F(2, 42) = 6.49, P = .005 (Figure 3D, Table 2); this was associated with a 16% increase in PEFcough from 3.1 ± 0.1 to 3.6 ± 0.1 L/s, F(2, 42) = 4.65, P = .02 (Figure 3B, Table 2).
Baseline lung function measures for FVC, FEV1, and IC are shown in Table 1 for each subject and were on average 38% ± 4% predicted values for FVC, 35% ± 3% for FEV1, 24% ± 1% for PEF, and 30% ± 3% for VC. 29 Lung function measures improved after training. FEV1 increased from 1.3 ± 0.1 to 1.4 ± 0.1 L (P = .002), FVC increased from 1.7 ± 0.2 to 1.9 ± 0.2 L (P = .03), PEF increased from 2.1 ± 0.1 to 2.4 ± 0.2 L/s (P = .03), VC increased from 1.5 ± 0.1 to 1.8 ± 0.1 L (P = .009), and IC increased from 1.4 ± 0.1 to 1.6 ± 0.1 L (P = .04). FEV1/FVC was unchanged (Table 3).
Lung Functions Before and After Training. a
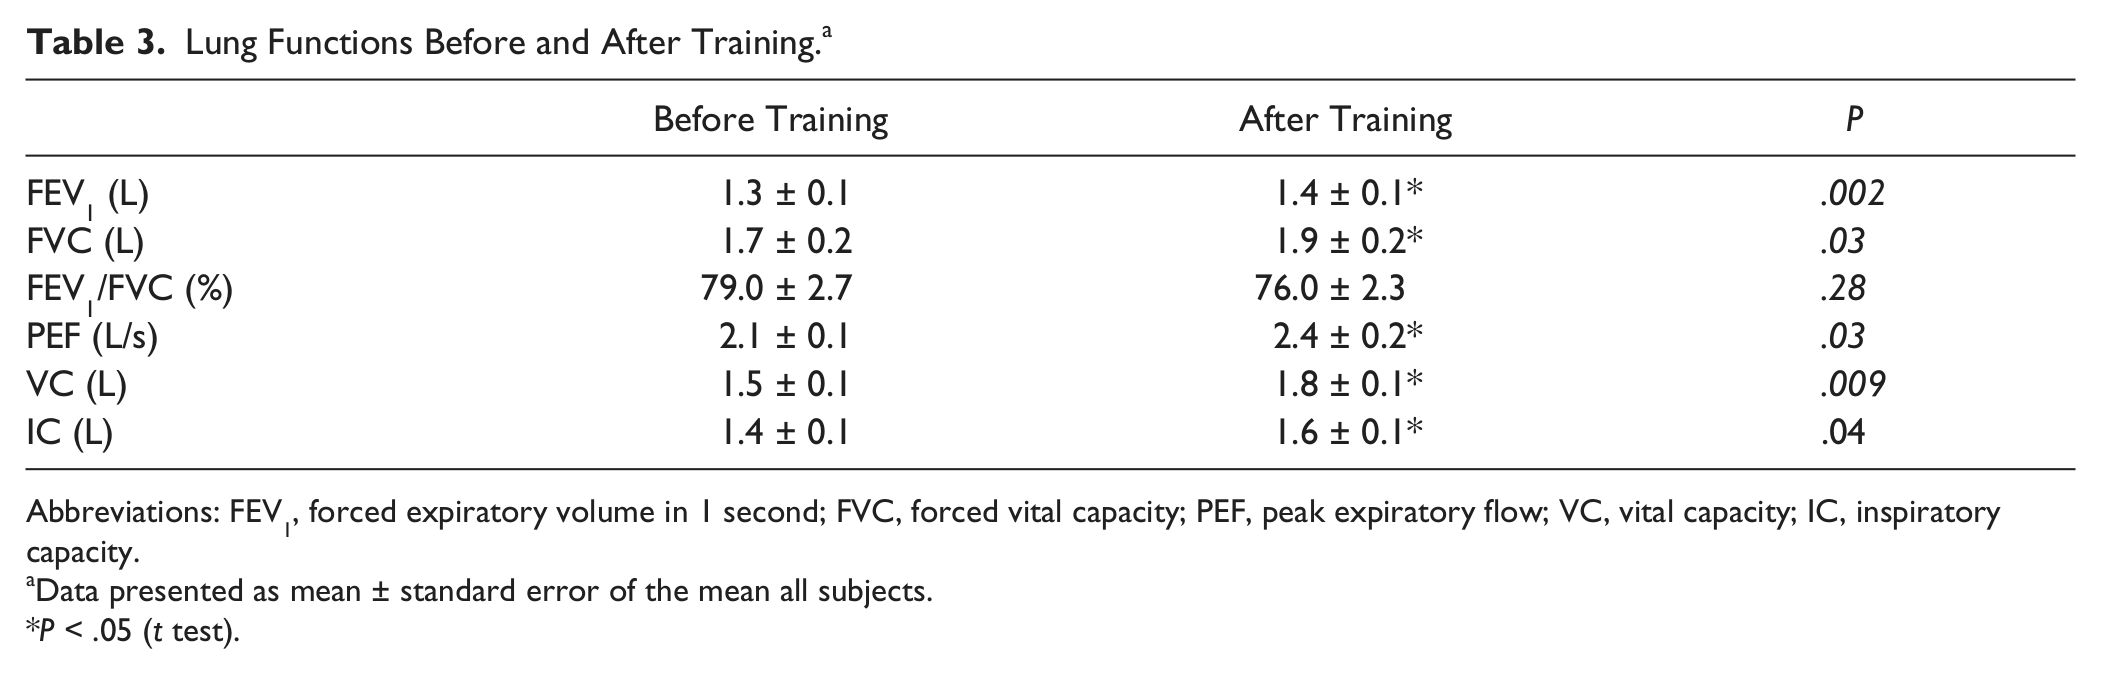
Abbreviations: FEV1, forced expiratory volume in 1 second; FVC, forced vital capacity; PEF, peak expiratory flow; VC, vital capacity; IC, inspiratory capacity.
Data presented as mean ± standard error of the mean all subjects.
P < .05 (t test).
Other Observations
For Pga, Pes, and PEFcough there was no correlation between the level of spinal injury and improvement due to acute effects of abdominal muscle stimulation. There was also no correlation between injury level and improvement due to 6 weeks abdominal muscle training for Pga and PEFcough. Whereas there was a correlation between the improvement in nonstimulated Pes after training and injury level (P = .02), this did not occur with stimulation. There were no correlations between improvements in lung function and injury level, or changes in Pga, Pes, or PEFcough.
Another secondary observation was that changes in blood pressure during a training session altered over time. On average, mean arterial blood pressure (MAP) rose from 74 ± 4 mm Hg at rest to a maximal value of 112 ± 7 mm Hg on the first day of training. After 6 weeks of training, MAP rose from 76 ± 4 mm Hg at rest to a maximum of 102 ± 7 mm Hg. The increase in MAP during a session declined from the beginning (38 ± 5 mm Hg) to the end of the 6 weeks training (25 ± 4 mm Hg; P = .03). The maximal evoked systolic blood pressure due to training diminished from 173 ± 12 to 156 ± 7 mm Hg (P = .02) over the 6 weeks of training.
Discussion
First, this study confirms our previous findings that functional electrical stimulation of the abdominal muscles with electrodes placed in the posterolateral position over the thoracoabdominal wall12,13 improves cough acutely in patients with high-level SCI. 13 There were 16-fold and 5-fold increases in Pga and Pes, respectively, and a 50% increase in PEFcough. In addition, following 6 weeks of cough training with this type of stimulation, there were further improvements in evoked abdominal and thoracic positive pressures during stimulated coughs of about 10 to 13 cm H2O (increase of 25% and 36%, respectively). Evoked peak expiratory flow also increased (16%). In coughs performed voluntarily without the aid of stimulation, there was a small but significant increase in Pga that led to small nonsignificant increases in voluntary generation of thoracic pressure and flow.
The effectiveness of a cough depends on intrapleural pressure generated indirectly by the contraction of the expiratory muscles timed with opening of the glottis.30,31 A critical level of intrapleural positive pressure is required to cause a high enough velocity of expiratory airflow combined with dynamic compression of the central airways that dislodges and clears airway secretions. Therefore, abdominal muscle strength is crucial for an effective cough. 32 The effects of muscle training are well known to improve muscle strength and endurance.33-36 After SCI, the same is true, potentially to a greater extent, because of extended periods of disuse or underuse.21,23,25-27,37-42 Abdominal muscle training through a combination of electrical stimulation and voluntary effort has the potential to improve abdominal muscle strength and therefore cough after SCI.
The improvement in cough parameters after training suggests an improvement in muscle strength. However, we do not show any direct evidence for this. Maximal abdominal muscle twitch pressure did not improve with training, which suggests that there was no increase in the force producing capacity of the muscles, unlike in the limb muscles in SCI where twitch pressure is shown to improve with FES training. 43 In the current study, the mean maximal abdominal twitch pressure was ~20 cm H2O, similar to our previous study and ~70% of that in able-bodied control subjects. 13 A possible reason for the lack of increase in maximal twitch pressure here is that the stimulus intensity that we used for training deliberately required a much lower current than the intensity used to produce a maximal twitch. Therefore, although this intensity produced significant acute increases in abdominal pressure, we predict that we may only be activating and training the muscle at 30% of its maximal capacity. However, there was also no change in the stimulus intensity required to produce a Pga of 40 cm H2O at FRC, which further suggests no major change in peripheral muscle strength with training.
Despite the lack of evidence here for increased muscle strength with training, and despite our intentional adjustment of stimulus intensity to produce 40 cm H2O at FRC, at each laboratory testing session, we still see improvements in both abdominal and thoracic pressures during cough after cough training. For abdominal pressure in both stimulated and nonstimulated coughs, there may be an improvement in abdominal muscle force production at high lung volumes as all coughs (in the laboratory and during training) were attempted from total lung capacity, where the muscles are likely to be at a more advantageous position on their length–tension curve, 12 whereas the maximal twitch pressures were measured at FRC. The apparent further increases in thoracic pressures may also be due in part to improved coordination of chest wall muscles during the cough that allow for better transmission of abdominal cough pressure to the thorax. This could occur in some subjects by reducing chest wall compliance, through greater voluntary activation of upper chest wall muscles unaffected by the spinal cord injury during the cough. However, at rest, the Pes/Pga ratio at FRC did not alter after training. The improvements in cough or lung function did not correlate with SCI level and the increase in IC did not correlate with the improvements in cough. It is possible that learning may contribute to the increased pressures generated in the voluntary coughs with stimulation after training via improved coordination of the cough with the stimulation. However, voluntary coughs without stimulation showed no improvements after training.
Another interesting observation was that over the 6 weeks of training with electrical stimulation of the abdominal muscles there was a significant reduction in the blood pressure response to stimulation. Because of the loss of baroreflex compensation and sensitization of vascular smooth muscle, 44 patients with SCI injuries above T6 can have episodes of autonomic dysreflexia in which endogenous or external stimuli cause abnormal rises arterial pressure. Even weak trains of stimuli on the abdominal wall can evoke vasoconstrictor reflexes in people with SCI. 45 The increase in MAP seen during the cough training sessions may be associated with a mild autonomic dysreflexic response. The reduction of this over the training period suggests adaptation of the sensitized vasoconstrictor reflex.
Despite the successful outcomes with epidural spinal cord stimulation (over T9, T11, and L1) to produce cough, where SCI patients have achieved expiratory flows of 7.8 to 8.8 L/s, and cough expiratory pressures of up to 150 cm H2O,20,46 much higher than those evoked here with our limited stimulus intensity, there will still be a need for a noninvasive nonsurgical option for electrically stimulated coughs. A current limitation with surface stimulation is the ability to produce high enough pressures with commercially available stimulators that are approved for patient use. Thus, training induced increases in cough pressures may be an important component of a successful stimulated cough.
In summary, stimulation with electrodes placed posterolaterally to excite the abdominal muscles can directly and significantly improve acute cough in high-level SCI. Further significant improvements can be observed in both electrically stimulated cough, and voluntary coughs without stimulation, after 6 weeks of training with combined stimulation and voluntary coughs. An additional benefit is an increase in lung function.
Footnotes
Acknowledgements
The authors thank Dr Rachael Brown for her assistance with the cough training.
Declaration of Conflicting Interests
The author(s) declared no potential conflicts of interest with respect to the research, authorship, and/or publication of this article.
Funding
The author(s) disclosed receipt of the following financial support for the research, authorship, and/or publication of this article:
This study was supported by the Laurie Cowled Scholarship; the New South Wales Office of Science and Medical Research Spinal Cord Injury Grant Program; and the National Health and Medical Research Council of Australia.