
Abstract
Background. Gait characteristics extracted from trunk accelerations during daily life locomotion are complementary to questionnaire- or laboratory-based gait and balance assessments and may help to improve fall risk prediction. Objective. The aim of this study was to identify gait characteristics that are associated with self-reported fall history and that can be reliably assessed based on ambulatory data collected during a single week. Methods. We analyzed 2 weeks of trunk acceleration data (DynaPort MoveMonitor, McRoberts) collected among 113 older adults (age range, 65-97 years). During episodes of locomotion, various gait characteristics were determined, including local dynamic stability, interstride variability, and several spectral features. For each characteristic, we performed a negative binomial regression analysis with the participants’ self-reported number of falls in the preceding year as outcome. Reliability of gait characteristics was assessed in terms of intraclass correlations between both measurement weeks. Results. The percentages of spectral power below 0.7 Hz along the vertical and anteroposterior axes and below 10 Hz along the mediolateral axis, as well as local dynamic stability, local dynamic stability per stride, gait smoothness, and the amplitude and slope of the dominant frequency along the vertical axis, were associated with the number of falls in the preceding year and could be reliably assessed (all P < .05, intraclass correlation > 0.75). Conclusions. Daily life gait characteristics are associated with fall history in older adults and can be reliably estimated from a week of ambulatory trunk acceleration measurements.
Introduction
Falling represents a serious risk for older adults. Thirty percent of community-dwelling older adults fall at least once per year, with a substantial number of these falls causing severe injuries and fear of falling. 1 For effective fall interventions,2-4 reliable and valid identification of persons at risk is required. Monitoring daily activities, especially locomotion, may support this identification. On a group level, various gait characteristics have been found to be related to fall risk, including gait speed, 5 different variability measures (see overview 6 ), and dynamic measures, such as local dynamic stability7,8 and harmonic ratio. 9 These relations, however, have been established with laboratory-based gait measurements. The applicability and predictive value of these measurements for daily life circumstances are, as of yet, unclear. Ambulatory recordings over multiple days enable the capturing of day-to-day variations in gait 10 and so undercut the white-coat effect. In addition, they may be more time efficient than laboratory-based measurements.
Several authors have recently investigated the potential benefit of daily life measurements for the assessment of fall risk. Weiss et al 11 revealed significant differences in spectral characteristics of trunk accelerations measured in daily life between older fallers and nonfallers, whereas Rantz et al 12 demonstrated the concurrent validity between clinical fall risk assessment and in-home-estimated gait velocity and stride time.
Our aim was to investigate the potential of daily life trunk acceleration recordings to reliably estimate gait characteristics and to predict fall risk in older adults. We focused in particular on the aforementioned characteristics because these have been shown to correlate with falling, mostly in controlled studies. We also considered stride time and stride frequency, 13 the accelerations’ standard deviation and range as measures of movement intensity, 13 and the index of harmonicity as a measure of smoothness of movement, 14 since these measures have been used to characterize quality of gait. Furthermore, we introduced a novel characteristic—namely, the percentage of signal power up to a threshold frequency, here referred to as the percentage of low-frequency power. The idea behind this novel characteristic is that power below the stride frequency might inform us about slowly occurring variations between strides, whereas power in high frequencies (ie, the remaining percentage of power) may indicate sudden movements or tremors, both of which may index fall risk.
Methods
Participants
The data used in this study were based on the available sample from a larger continuing study at the time of the start of the analysis. A total of 114 older adults were recruited among the community and various institutions. Participants were included in this study if their Mini Mental State Examination scores exceeded 18 (maximum, 30; mean, 27.6 ± 2.1; range, 20-30) and they were able to walk at least 20 m, if necessary with a walking aid. The protocol (2010/290) received approval from the medical ethical committee of the VU University medical center, Amsterdam, Netherlands. In a preliminary analysis, we found 50 episodes to be a minimum for obtaining reliable estimates. Data of 4 participants were excluded because fewer than 50 episodes of 10 seconds or longer per week had been recorded; thus, data of 110 participants were included in the analysis (33 men; mean age, 78.4 ± 7.8 years; range, 65-97). Table 1 lists the demographics of our study population.
Demographics of the Study Population a .
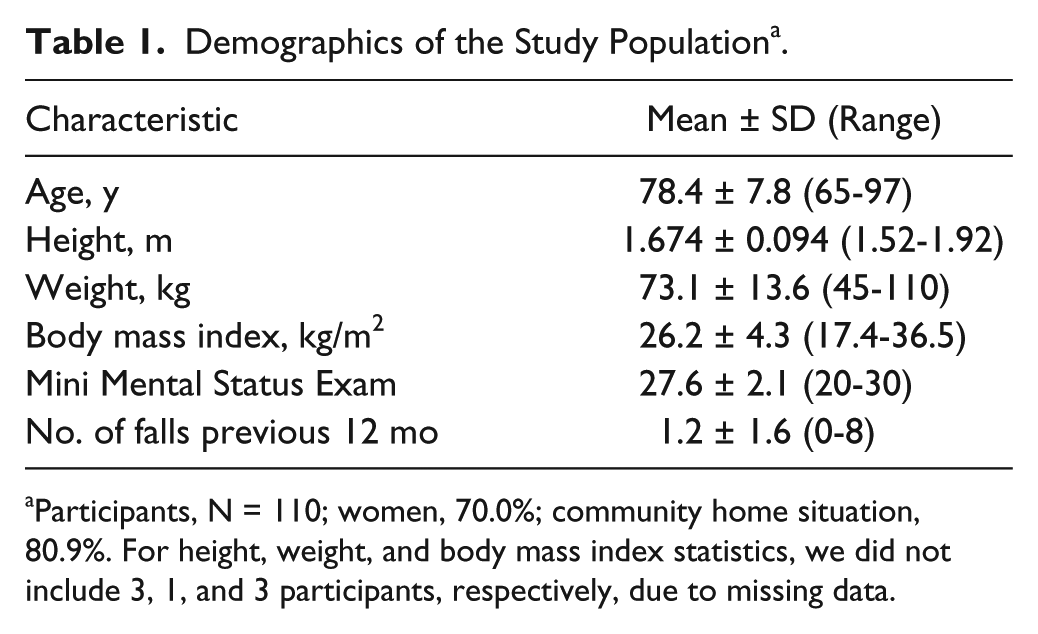
Participants, N = 110; women, 70.0%; community home situation, 80.9%. For height, weight, and body mass index statistics, we did not include 3, 1, and 3 participants, respectively, due to missing data.
Data Acquisition
We invited participants to wear a portable triaxial accelerometer (DynaPort MoveMonitor, McRoberts, The Hague, The Netherlands), sampling at 100 Hz with a range of −6 g to 6 g. It was attached with an elastic belt around the waist and set along the lumbar spine. Participants wore it for 2 separate weeks to investigate reliability. The participants were instructed to wear the accelerometer at all times, except during water activities (eg, showering) to avoid damage to the instrument. The accelerometer recorded accelerations in 3 directions, which roughly coincided with the anatomic axial (vertical; V), mediolateral (ML), and anteroposterior (AP) directions.
The participants’ self-reported number of falls in the 12 months preceding the measurements was used as indication of their fall histories. A fall was defined as an event that resulted in unintentionally coming to rest on the ground or other lower level. 15
Data Selection
We discarded the first and last 6 hours of each measurement week, to exclude data containing sensor transfers from research team to participant and vice versa. Locomotion episodes were identified with an activity classification algorithm (McRoberts, The Hague, Netherlands). 16 Locomotion episodes lasting 10 seconds or longer were selected, and to avoid possible sample size-related bias, 17 each episode was split into contiguous epochs of 10 seconds, with the remaining unused time equally divided over the beginning and end of the episode. 18 We used MATLAB (version 2011a, Mathworks, Natwick, MA) to further analyze these 10-second locomotion epochs.
Alignment Preprocessing
The raw data from each 10-second locomotion epoch were first aligned to correct for potential sensor misalignments. As proposed by Moe-Nilssen, 19 the V axis was selected as the direction of the mean acceleration signal, since the expected mean acceleration in the other directions is negligible compared to the gravitational acceleration. The AP and ML directions were selected by optimization of gait symmetry. 20 In symmetric gait, left and right steps yield equal AP signals but opposite ML signals. Using this notion, we selected these axes as the 2 orthogonal axes in the plane perpendicular to the V axis that optimize the product of their harmonic ratios, considering that the harmonic ratio is a measure for gait symmetry. 21
Gait Characteristics
A total of 17 gait characteristics were estimated for every 10-second locomotion epoch. Many characteristics capitalized on the power spectrum that we always estimated after applying a 10-second Hamming window.
Movement intensity was defined per direction as the standard deviation of the acceleration signals. Gait speed was estimated with the method introduced by Zijlstra and Hof. 22 This method assumes a compass gait type with a circular trajectory of the sensor during each support phase and determines step lengths by trigonometry from the peak-to-peak height differences obtained by double integration of high-pass filtered V accelerations. Leg length was estimated as 48% of the participant’s body height. 23 For 3 participants, body height was unknown, which rendered the estimation of gait speed impossible.
Speed variability was given as the standard deviation of the stride speeds with exclusion of the highest and lowest 10%. The time for individual strides was chosen as the time between one peak and the second-next peak, with the same sign in the height curve determined for the estimation of gait speed. We defined stride time variability as the standard deviation of stride times. The same times for individual strides as mentioned above for stride speed were used, except for the highest and lowest 10%. Stride time was determined as the lag time s between 0.4 and 4 seconds that maximizes the sum of autocovariances of the 3 directions. 24 We further defined stride regularity as the summed autocovariance for time-lag s normalized to the summed autocovariance with zero lag 24 combining spatial and temporal gait variability.
Stride frequency was initially estimated as the median of the modal frequency for the ML and half the modal frequencies for the V and AP directions as determined from the power spectrum. Then, if this median frequency did not fall within the expected range of 0.6 to 1.2 Hz, the stride frequency estimate was replaced with the modal frequency for a direction that did, if available. Finally, if all modal frequencies differed less than 10% from a harmonic of the current stride frequency estimate, the estimate was replaced by the mean of the modal frequencies divided by their harmonic number.
We determined stride frequency variability per direction via the relative fluctuations in phase progression that we averaged over the harmonics weighted by their power. Phases were calculated by Hilbert transform of a bandpass-filtered signal, with a passband of two-thirds the stride frequency wide around the harmonic.
Gait symmetry was given by the harmonic ratio,25,26 and gait smoothness was estimated as the index of harmonicity. 14 Amplitude, width, and slope of the dominant frequency within the frequency range from 0.5 to 3 Hz served as measures for consistency and variability of gait. 11 Acceleration range 11 was given as the difference between the minimum and maximum acceleration over an epoch.
The low-frequency percentage was defined as the summed power up to a threshold frequency divided by the total power. The threshold frequency was taken to be the one with the most significant association with fall history from the test frequencies of 0.3, 0.5, 0.7, 1, 1.5, 2, 3, 5, 7, and 10 Hz. Note that the remaining percentage represents the related high-frequency percentage for these thresholds. In addition, note that the here-introduced low-frequency percentage was treated different from the other characteristics, as we implemented it in an explorative fashion, meaning that we optimized the threshold frequency to find the most significant association with fall history. In contrast to the other characteristics, which were derived with established parameter settings, no best practice exists for this measure, and the threshold frequency strongly determines the meaning of the characteristic, such as the aforementioned interstride variations or sudden movements and tremors.
Local dynamic stability was separately estimated for each direction, based on a 10-samples time-delay embedding 27 in 7 dimensions. Given its good assessment in recent gait studies with respect to sensitivity 28 and to accuracy in simulated systems, 29 we used the method introduced by Wolf et al 30 to estimate the local dynamic stability (ie, largest Lyapunov exponent). Finally, we computed local dynamic stability per stride as the local dynamic stability divided by stride frequency. This characteristic was added to account for debates about normalization to stride frequency.31,32
Aggregate Values for All Locomotion Epochs in a Week
To obtain a single aggregate value per characteristic per week of data for each participant, we determined the median of each characteristic over the 10-second epochs. The median was employed because of its robustness against potential outliers. On average, more than a thousand epochs were available per participant per week (see Results section for details).
Statistical Analyses
For each aggregated value, we quantified reliability through the intraclass correlation (ICC) absolute agreement 33 between the first and second measurement week. As 36 participants wore the accelerometer for only 1 week, their data were excluded in the reliability analysis. We further assessed validity—namely, the potential of each characteristic with respect to fall risk prediction—by relating the characteristic (averaged over 1 or, if available, 2 weeks) to the self-reported number of falls during the 12 months prior to recordings. This was done by means of a negative binomial regression because this technique accounts for overdispersed count data when the between-participant variance in the number of falls is larger than expected for a Poisson distribution (where the expected values for mean and variance are equal). In our study, the variance was more than twice as high as the mean of the number of falls. To facilitate direct comparison with other studies, we also applied a logistic regression; see the appendix for details. Gait characteristics were considered a potential fall risk indicator if they were associated with fall history with a P value below .05 and if their ICCs exceeded 0.7. 34 Note that our P values were not corrected for multiple comparisons; thus, an α level of .05 would require a P value of .0013.
Results
We analyzed a total of 236 557 10-second locomotion epochs during 184 measurement weeks: on average, 1286 locomotion epochs per participant per week (range, 62-5305; 36 participants completed only 1 measurement week). The average self-reported number of falls in the 12 months preceding the measurements was 1.2 ± 1.6 and ranged from 0 to 8, as shown in Figure 1. Table 2 shows the association of all aggregated gait characteristics with these self-reported numbers of falls, as well as their between-week reliability. All characteristics showed sufficient reliability, with ICCs exceeding 0.7, except for stride frequency variability (ICC = 0.66, 0.65, and 0.62 in V, ML, and AP directions, respectively) and width of the dominant frequency in the V direction (ICC = 0.62). When only part of the week was used, ICCs were typically ranging between 0.3 and 0.7 (1 day), or half of the ICCs were below 0.7 (3 days).
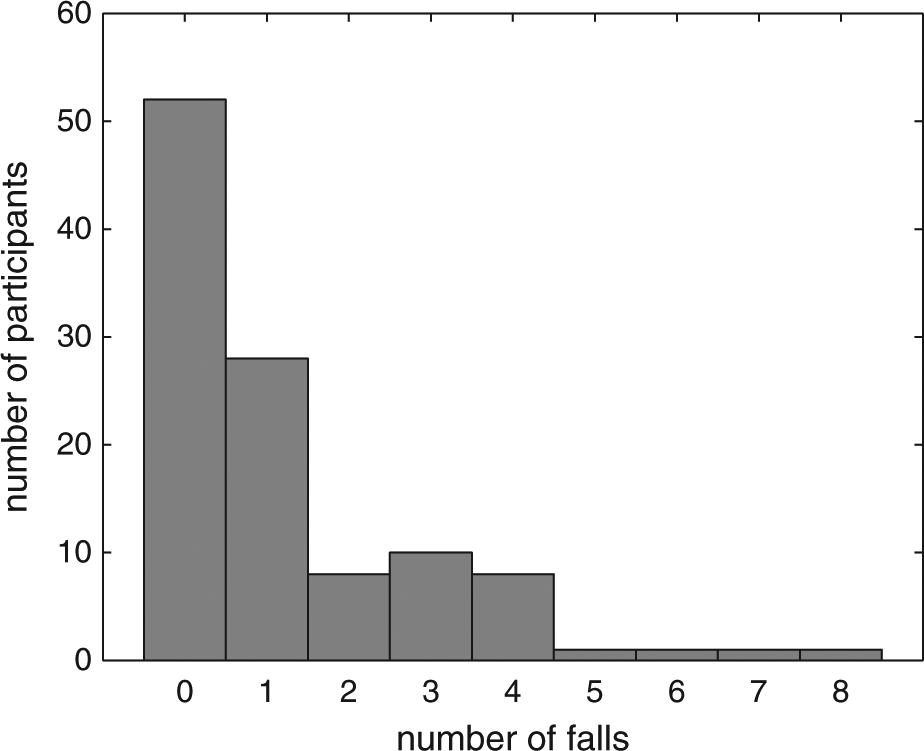
Number of falls in the preceding year as reported by participants.
Gait Characteristics’ Association With Fall History From Negative Binomial Regression and Reliability a .
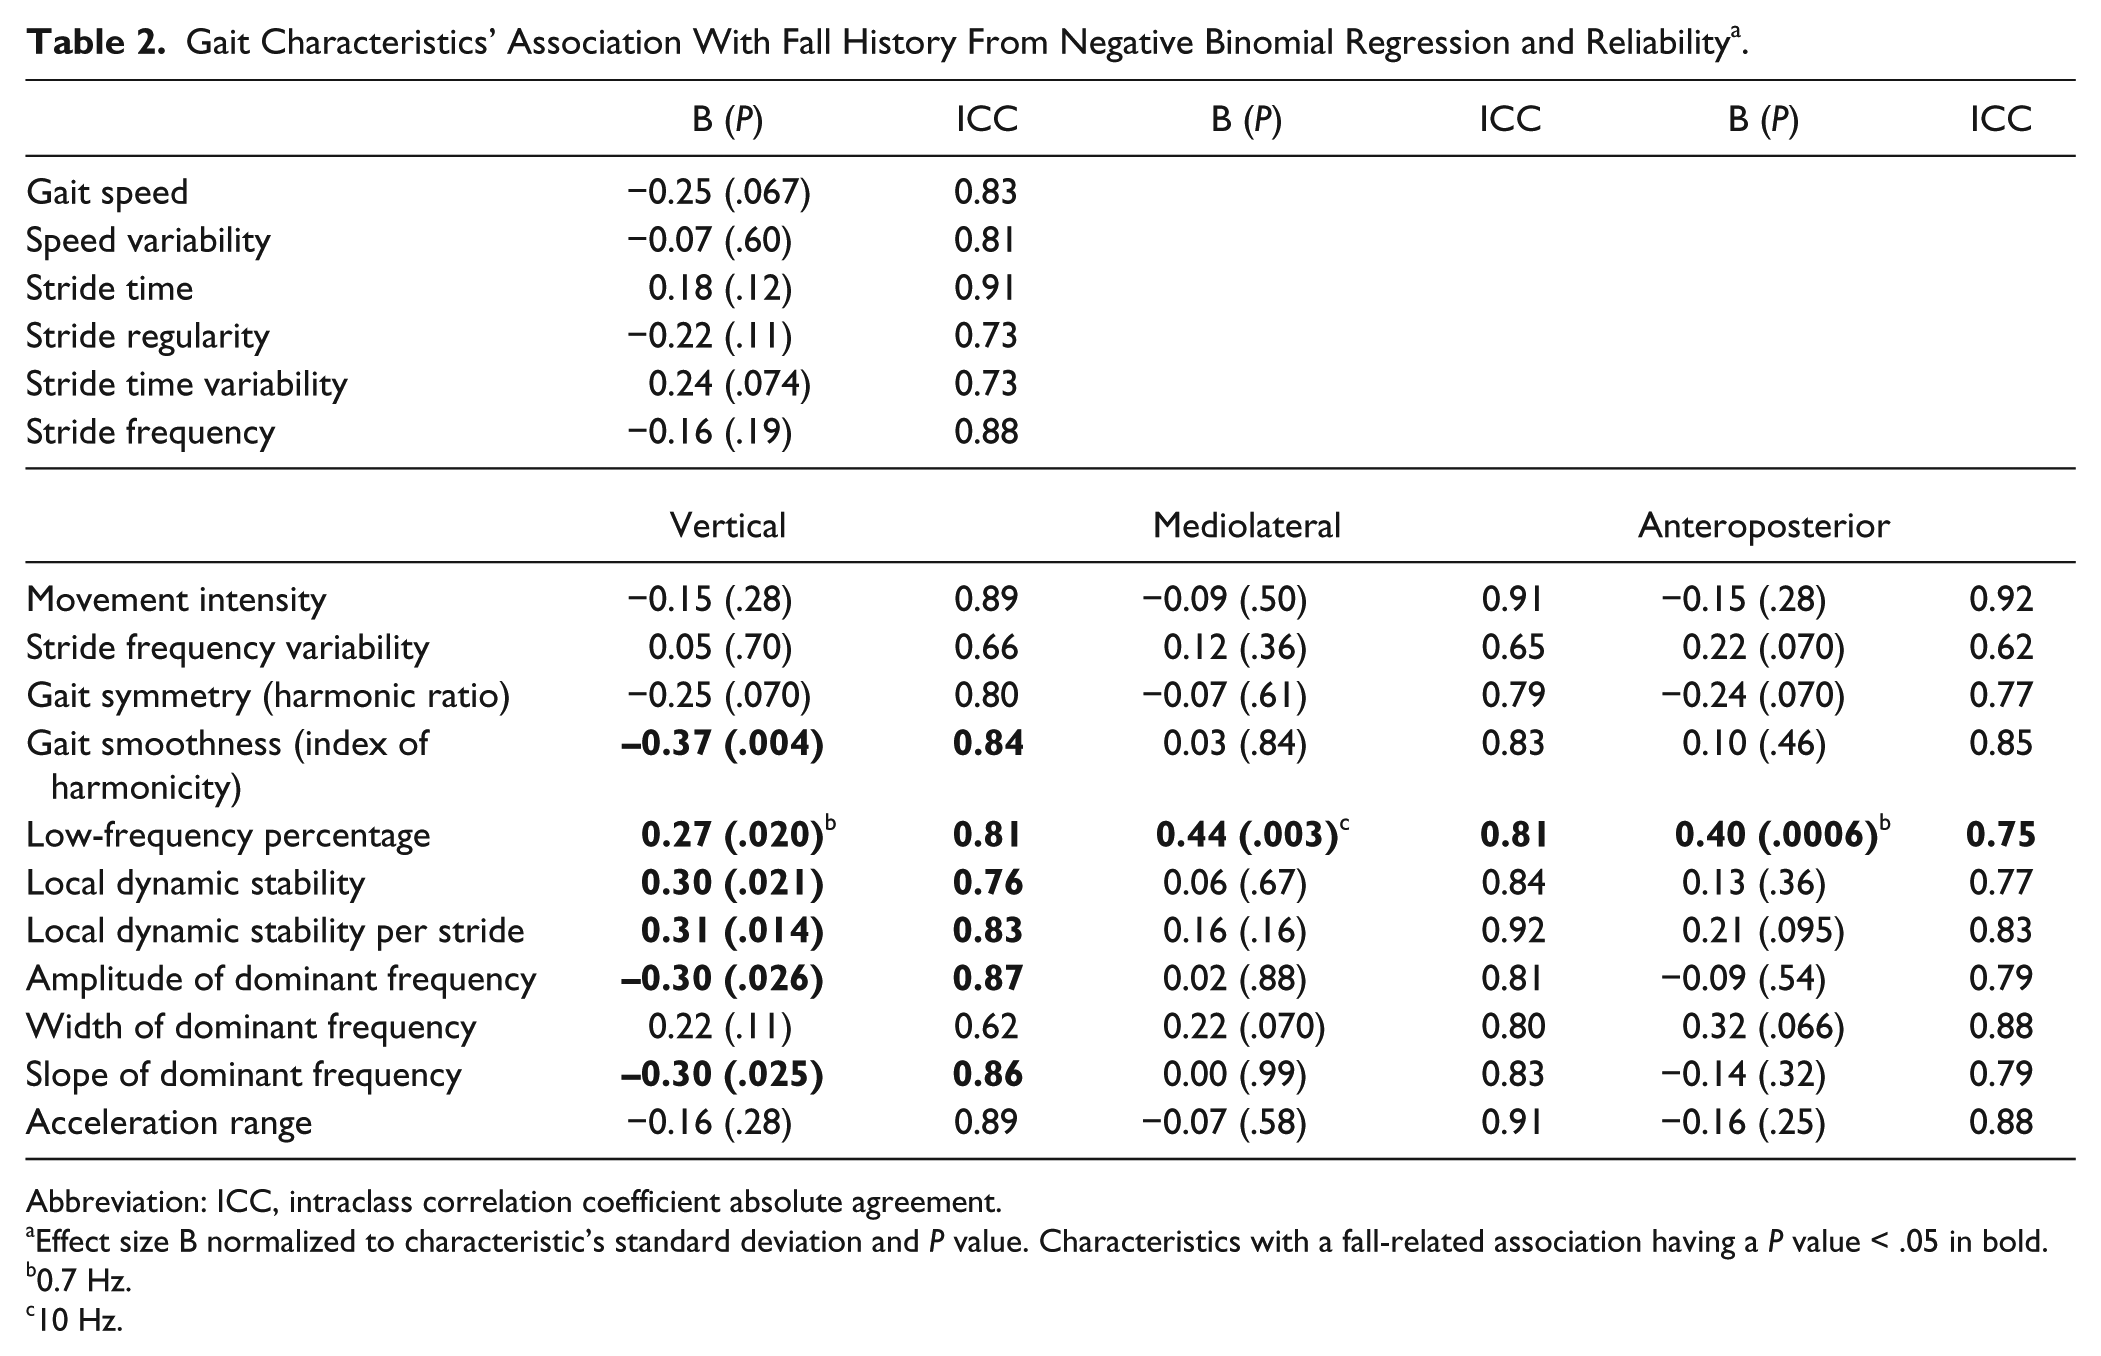
Abbreviation: ICC, intraclass correlation coefficient absolute agreement.
Effect size B normalized to characteristic’s standard deviation and P value. Characteristics with a fall-related association having a P value < .05 in bold.
0.7 Hz.
10 Hz.
The low-frequency percentage showed a potential fall risk indicator, which had a positive association with fall history with a threshold of 0.7 Hz for the V and AP directions and a threshold of 10 Hz for the ML direction, all with good reliability. In addition, we identified the following characteristics along the V axis as potential fall risk indicators: local dynamic stability, local dynamic stability per stride, gait smoothness, and amplitude and slope of the dominant frequency. For the low-frequency percentage in the AP direction, the association with fall history was significant at the α level of 0.05 after correction for multiple comparisons.
The results of the logistic regression can be found in the appendix.
Discussion
The aim of this study was to explore the potential of trunk acceleration measurements collected during daily life for the purpose of fall risk assessment. We tested a range of gait characteristics derived from trunk acceleration data with regard to 2 important criteria that must be fulfilled for a characteristic to qualify as a fall risk indicator: reliability and validity.
Reliable Gait Characteristics
The criterion of reliability is not easily met in daily life measurements, which are unsupervised. Circumstances during the measurements are likely to change, such as walking surfaces, turns and obstacles, variations in gait speed, the performance of a dual task, and interactions with other people. Such variations in circumstances may add random fluctuations to gait characteristics, which may undermine the reliability of their estimates. However, averaging characteristics determined over an extended period (eg, 1 week) can cancel out these fluctuations, which may result in even more reliable estimates than what would be obtained in a single session under controlled conditions. The ICCs of the gait characteristics estimated from 1 week of recordings were generally above 0.7, which indicates good reliability 34 and, thus, good potential for the assessment of fall risk based on trunk accelerations measured continuously in daily life. This is an encouraging finding given the potential effect of unknown variations that can be present in the uncontrolled measurements.
Association With Fall History
The issue of validity may pose an even taller order than that of reliability. Several studies have addressed the validity of methods for estimating parameters in daily life,35-38 but in the current study, validity pertains to a required association between the characteristic under study and actual fall risk. It is not guaranteed that characteristics indicating fall risk when measured in laboratory settings indicate the same when measured in daily life. Based on controlled laboratory measurements, local dynamic stability, interstride variability, gait speed, and gait symmetry have revealed significant associations with fall incidence,5-9 while the amplitude and slope of the dominant frequency and acceleration range have discriminated fallers from nonfallers based on daily life acceleration data. 11 Most of these findings were confirmed by our daily life data, at least in the sense that local dynamic stability and local dynamic stability per stride showed a positive association with fall history and the amplitude and slope of the dominant frequency (all in the V direction) showed a negative association with fall history. Previous studies found a relation between falling and local dynamic stability in the AP 7 and ML 8 directions with data obtained during treadmill walking, but we could not replicate these findings using ambulatory collected data.
The absence of associations with the variability measures and gait symmetry might be explained by methodological differences between the controlled studies and our study, which may well have affected variability and symmetry. For instance, when one walks on a treadmill or on a straight path on a level surface, there is no obvious incentive for a large variability, and it might therefore be mainly related to limited gait control. In daily life, however, variability and asymmetric gait may result from active control for the purpose of, for example, navigation through complex environments. For mean gait speed, a similar explanation may hold. In daily life, gait speed could be more dependent on the circumstances and episode distances than on the participant’s capabilities, whereas in supervised studies, the circumstances and episode distances are typically similar and standardized by instruction, and differences are thus likely to depend more on the participant’s capabilities.
Comparing the present study and that of Weiss et al, 11 we note that we obtained different results for characteristics that both studies had in common. The associations reported by Weiss et al were not all confirmed in our study or, if present, displayed less significance. It could be that these differences resulted from a difference in the population studied, as we recruited community-living as well as institutionalized older adults, whereas Weiss et al 11 studied community-living older adults only and excluded participants with clinically diagnosed gait or balance disorders. Hence, the heterogeneity of our study population may have led to different relations between gait characteristics and fall risk.
The low-frequency percentage had a positive association with fall history for all directions. This novel characteristic has not previously been associated with falls. The effect size and significance of these associations should therefore be interpreted with caution, in particular since the threshold frequency was optimized for significance based on 10 test frequencies. Nevertheless, this characteristic constitutes a potential fall risk indicator. For the V and AP directions, the optimal threshold was 0.7 Hz, implying an increased fall risk with the presence of more slow V and AP variations below the step frequency. These changes may result from postural changes affecting sensor orientation because such changes in orientation will change the projection of the gravitational acceleration on the measurement directions. This can occur if the trunk orientation changes between forward leaning and backward leaning over the course of a few steps. Such a varying AP trunk orientation might be caused by a loss of accurate postural control during gait. The stronger association for the AP direction than for the V direction can be explained by these slow variations in the orientation of the sensor. The gravity signal is vertical, but by variations of the orientation, it is measured partly by the sensor’s AP component, as the sine of the forward/backward sway angle. The change in the sensor’s V component scales with the cosine of this angle, which, for small angles, changes much slower than the sine. The power caused by these slow orientation changes is therefore much smaller in the V component than in the AP component, and its estimate is therefore more sensitive to disturbance by acceleration signals from other effects. For the ML direction, by contrast, the optimal threshold for the low-frequency percentage was 10 Hz, implying an increased fall risk with the absence of a high-frequency signal. We did not expect this latter association to be positive. However, the presence of a high-frequency signal above 10 Hz indicates fast kinematic changes and may reflect quick responses through a rapid rate of force generation rather than tremors and sudden erratic movements. This rate of force generation, also known as power, is considered important in the context of falling. 39 A threshold of 10 Hz might seem very high considering the assumption of England and Granata 40 that a signal above 10 Hz is unlikely related to musculoskeletal motion. They based this belief on position measurements, whereas we used acceleration, the spectral power of which, following the Fourier transform differentiation theorem, is adjusted by a factor directly proportional to the frequency to the fourth power as compared to position. In other words, high-frequency power of musculoskeletal motion could be negligible in position signals but not in acceleration signals.
Gait smoothness, quantified by the index of harmonicity, was negatively associated with fall history for the V direction. Although this measure has been used to characterize quality of gait previously, 14 as far as we are aware, this is the first time that an association with fall history was found.
Limitations
Movements other than gait (eg, cycling or stair negotiation) may have been categorized as locomotion and may have been included in our analysis in some cases. However, we expected that episodes of other movements in the locomotion category would be relatively rare, especially in our population, and therefore have only a marginal influence on the characteristics’ aggregate estimates. Still, improvement of estimates might be achievable by narrowing the selection of locomotion episodes with additional criteria.
A difference between our study and many other studies in the field of interest is the use of negative binomial regression instead of a method that specifically contrasts fallers and nonfallers, such as a logistic regression or a Student t test. We chose the negative binomial regression because summarizing the number of falls that a participant experiences into a logistic variable would have ignored important details on recurrences of falls within our population. However, to facilitate direct comparison with other studies, we also conducted a logistic regression, the details of which are reported in the appendix.
The aggregation of our characteristics by the median over all epochs of locomotion during 1 week caused a loss of the information on extreme values, which might represent near falls. Assuming that near falls are an indicator of increased fall risk, this suggests that a different aggregation method focusing on the extremes rather than the median value could provide additional information on fall risk.
Future Work and Implications
The current study revealed significant associations between fall history and several gait characteristics in daily life gait. However, the aim of the present line of work is to eventually make a contribution to prospective fall risk prediction. If the current findings are confirmed by other and prospective data, daily life gait characteristics obtained through ambulatory accelerometry may help to enhance the assessment of fall risk of individuals in clinical practice.
Conclusion
This study revealed that characteristics of trunk accelerations could be reliably determined when obtained from gait episodes over 1 week of ambulatory measurements during daily life. Local dynamic stability, local dynamic stability per stride, gait smoothness, and the amplitude and slope of the dominant frequency (all in the V direction) were identified as potential fall risk indicators, as were the percentage of low-frequency power below 0.7 Hz in the V and AP directions and the percentage of low-frequency power below 10 Hz in the ML direction,. The observed associations between these characteristics and fall history provide a promising starting point for evaluating them in their capacity as prospective predictors of fall risk.
Footnotes
Appendix
Logistic regression was applied to our data, with gait characteristic as the predictor and with participants classified as fallers when they had experienced 2 or more falls in the preceding 12 months as the dependent variable. The results of this analysis are collected in Table A1. The estimates for significance were quite similar to those estimated by negative binomial regression. Although P values passed the selection threshold of .05 for some characteristics (stride time variability and amplitude and slope of the dominant frequency in the V direction), the main message of our study remains the same for either regression model.
Declaration of Conflicting Interests
The author(s) declared no potential conflicts of interest with respect to the research, authorship, and/or publication of this article.
Funding
The author(s) disclosed receipt of the following financial support for the research, authorship, and/or publication of this article: This work was supported by the Netherlands Organisation for Scientific Research (NWO TOP NIG grant 91209021 and NWO grant 400-08-127) and by AGIS/Achmea (Innovatiefonds grant 499256).