
Abstract
Background. Many approaches are used to evaluate fall risk. While their properties and performance vary, most reflect performance at a specific moment or are based on subjective self-report. Objective. To quantify fall risk in the home setting using an accelerometer. Methods. Seventy-one community-living older adults were studied. In the laboratory, fall risk was assessed using performance-based tests of mobility (eg, Timed Up and Go) and usual walking abilities were quantified. Subsequently, subjects wore a triaxial accelerometer on their lower back for 3 consecutive days. Acceleration-derived measures were extracted from segments that reflected ambulation. These included total activity duration, number of steps taken, and the amplitude and width at the dominant frequency in the power spectral density, that is, parameters reflecting step-to-step variability. Afterwards, self-report of falls was collected for 6 months to explore the predictive value. Results. Based on a history of 2 or more falls, subjects were classified as fallers or nonfallers. The number of steps during the 3 days was similar (P = .42) in the fallers (7842.1 ± 6135.6) and nonfallers (9055.3 ± 6444.7). Compared with the nonfallers, step-to-step consistency was lower in the fallers in the vertical axis (amplitude fallers, 0.58 ± 0.22 psd; nonfallers, 0.71 ± 0.18 psd; P = .008); in the mediolateral axis, step-to-step consistency was higher in the fallers (P = .014). The 3-day measures improved the identification of past and future falls status (P < .005), compared to performance-based tests. Conclusions. Accelerometer-derived measures based on 3-day recordings are useful for evaluating fall risk as older adults perform daily living activities in their everyday home environment.
Introduction
Falls among older adults are a major health problem that leads to decreased quality of life, increased comorbidity and mortality, and high public health care costs. Considerable efforts have been made to identify older adults at risk and to design fall prevention and intervention programs.1-6 Many approaches are used to evaluate fall risk.1,3 While their properties and ability to successfully quantify fall risk vary widely, most share common features: (a) they reflect the performance at a specific moment in time and/or (b) they are based on subjective self-report. Unfortunately, because of problems of recall, transient changes, or white coat syndrome, such measures may not adequately represent actual fall risk.7-9 Furthermore, since many falls occur inside or near the home, where hazards are commonplace, it is important to assess fall risk in these complex environments or in situations that reflect these everyday conditions. 10 Testing that occurs where people carry out their actual daily living routine, during community ambulation, should provide a good reflection of fall risk. We recently proposed a method for quantifying gait in complex, daily-living settings using a single body-fixed sensor. 11 Here, we extend that method and demonstrate its potential for assessing fall risk in real-life, everyday settings.
We speculated that an approach that is able to quantify both the quality and quantity of mobility during everyday activity will be useful for assessing fall risk. Although there are conflicting reports in the literature, previous work has suggested that fall risk may be related to the amount of activity.12-15 For example, some studies reported that outdoor falls are associated with a more active and healthy lifestyle, while indoor falls are more closely related to poor health. 16 , 17 Many falls occur during ambulation,5,9,18 and it is not surprising that measures such as gait speed and balance have been associated with fall risk.5,19 Furthermore, forward walking has been associated with the occurrence of falls. 20
Another view stresses the value of stride-to-stride variability in quantifying fall risk.21-23 Increased variability likely reflects a less automatic gait pattern and instability and susceptibility to falls.21,22 Therefore, we sought to assess both metrics that reflect the quantity and the quality of the walking pattern. Since 1-day monitoring might not be sufficient to capture a range that reflects everyday activity,24-26 we propose a method that evaluates mobility and fall risk based on 3 days of continuous activity monitoring. This approach follows the recommendation that tools that enable clinicians and researchers to monitor the type, quantity, and quality of everyday activities may improve care and help in the design of more meaningful interventions to establish cost-effective, evidence-based practices. 27 The aim of the present work was, therefore, to evaluate the possibility of using a body-fixed sensor worn continuously for 3 days to quantify fall risk as older adults carry out their routine activities of daily living.
Methods
Subjects
Seventy-one community-living older adults (mean age = 78.36 ± 4.71 years; range = 65-87 years) were studied. Subjects were included if they were not previously clinically diagnosed with any gait or balance disorders, and if they were cognitively intact, with a Mini-Mental State Examination score above 24 points. Subjects were classified as fallers and nonfallers based on their self-report of previous falls. If subjects had at least 2 falls in the past year, they were considered as fallers; otherwise they were considered nonfallers.17,28
Protocol
The protocol included 4 parts:
Clinical and traditional fall risk assessment: In the laboratory, functional performance-based assessments included the Dynamic Gait Index (DGI), 29 the Berg Balance Scale 30 (BBS), the Timed Up and Go test (TUG), 31 and the Four Square Step Test (FSST). 32 The Mini Mental State Examination (MMSE) 33 and the Activities-specific Balance Confidence scale (ABC) 34 were also completed.
Gait assessment in the lab: Participants walked for 1 minute at a comfortable, self-selected speed while wearing a gait belt. A 3D accelerometer was worn on the lower back to quantify gait using previously validated methods,11,35,36 as detailed further below.
Three-day activities of daily living assessment: After performing tests in the laboratory, participants were asked to wear a 3D accelerometer on their lower back for 3 consecutive days (except during activities like showering or swimming). Subjects received a diary for tracking when and why they took off and put on the device.
Prospective assessment of falls: After completing the 3-day recordings, prospective data on falls were collected for 6 months to explore the predictive value of the accelerometer-derived measures. Subjects returned the completed fall calendars once a month using prepaid and preaddressed envelopes, following current recommendations for the monitoring of falls. 37 Subjects were instructed to keep the calendar in a convenient place and to record falls, defined as unintentionally coming to rest on a lower surface.4,37,38
Ambulatory Assessment
Participants wore a small, light-weight sensor (DynaPort Hybrid, McRoberts, The Hague, Netherlands; 87 × 45 × 14 mm, 74 g) on a belt on their lower back (see Figure 1). The device includes a triaxial accelerometer (sensor range and resolution: ±6 g and ± mg, respectively) and a triaxial gyroscope (sensor range and resolution: ±100°/second and ±0.0069°/second, respectively). The signals acquired were 3 acceleration axes, vertical acceleration (V), mediolateral acceleration (ML), anterior posterior acceleration (AP), and 3 angular velocity axes, yaw, pitch, and roll. The angular velocity signals were not analyzed in the present study. The signals were recorded on a Secure Digital (SD) card at a sample frequency of 100 Hz, and later transferred to a personal computer for further analysis (using MATLAB, MathWorks, Natick, MA).
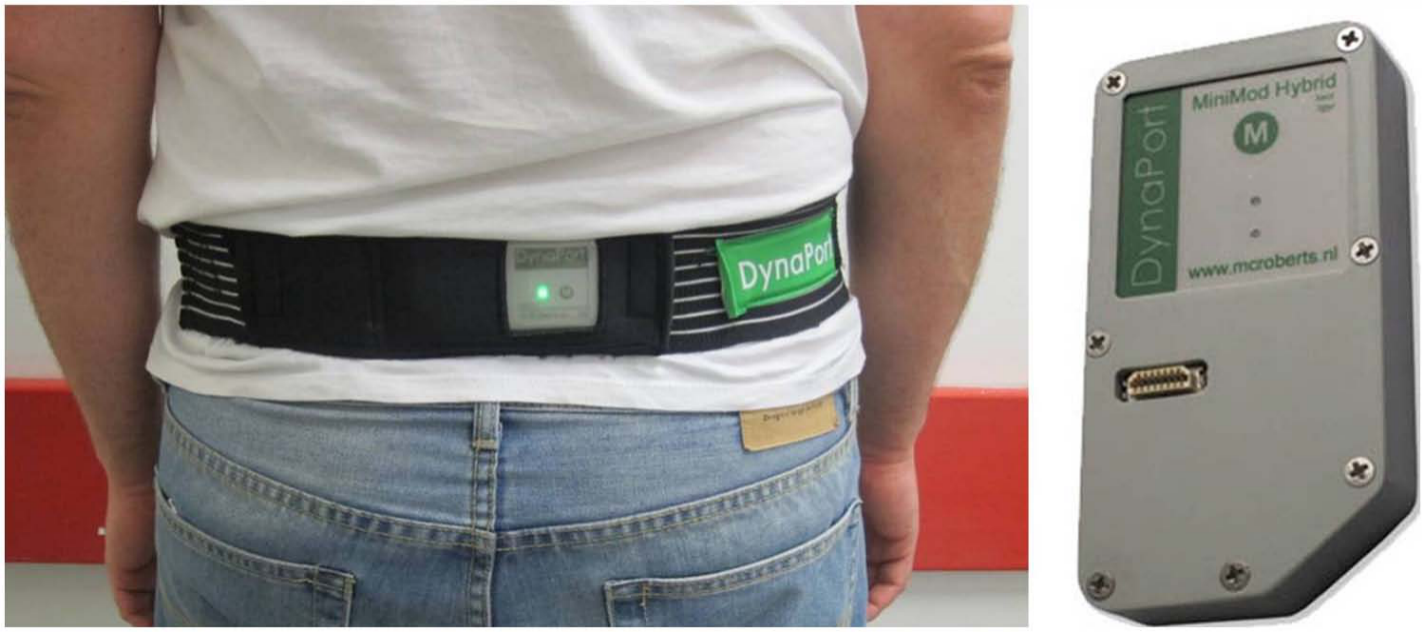
The acceleration sensor worn by the subjects for 3 days. It was held in place at the lower back by a belt with a customized pocket.
Data Analysis: Acceleration-Derived Measures
Gait analysis in the laboratory
This walking trial was analyzed for the purpose of comparison and correlation analysis with the 3-day measures. Acceleration measures were extracted from all 3 acceleration axes. Frequency-derived acceleration measures were based on the characteristics of the dominant peak of the main frequency in the power spectral density (psd) of the 0.5 to 3 Hz band and reflect the variability and consistency of the gait pattern. 11 The derived measures included the amplitude of the psd peak (which reflects the strength of the signal’s dominant frequency and is referred to as “amplitude”), the width of the psd peak (which reflects the frequency dispersion and is referred to as “width”), and the slope of the psd peak (a combination reflecting the ratio of the amplitude to the width, referred to as “slope”). Larger amplitude and slope values reflect a more consistent, less variable gait pattern. A larger width reflects a more variable gait pattern. Other measures included the average step and stride duration, as well as regularity measures 35 that reflect gait rhythmicity and variability. The harmonic ratio, 36 which is an index of gait smoothness, and the acceleration ranges were also extracted. Table 1 lists all of the derived measures.
Summary of all Acceleration-Derived Measures.
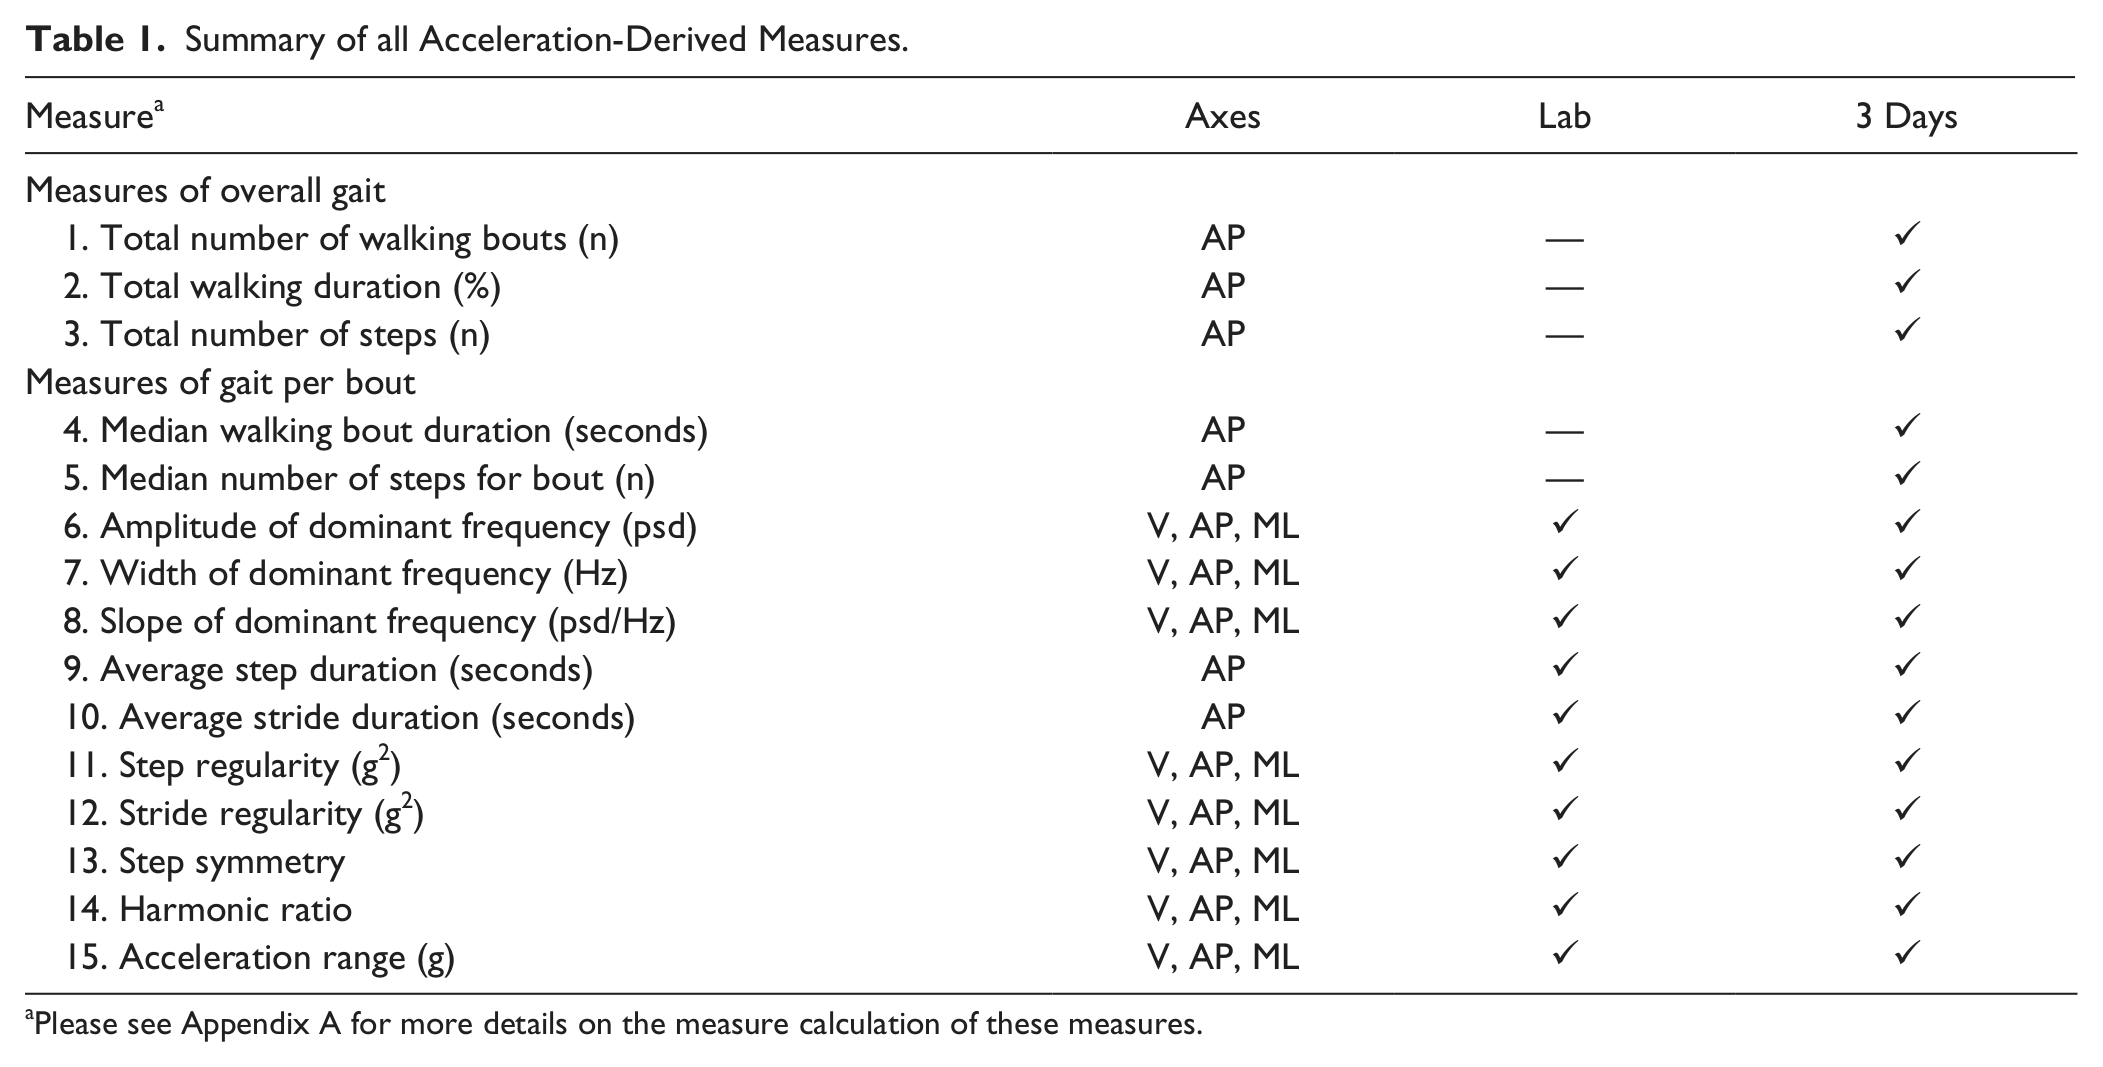
Please see Appendix A for more details on the measure calculation of these measures.
Data analysis of the 3-day walking
The data analysis of the 3-day activities of daily living included 2 stages: (a) detection of segments when the subjects were walking and (b) acceleration-derived measures applied to these segments. In the first stage, a filter was applied to extract the walking and locomotion segments of the 3-day recordings (adapted from previous work 11 ). The second stage involved extracting acceleration-derived measures from walking bouts that were 60 seconds or longer. (We used 60 seconds to ensure that the period was continuous walking.) Quantity measures of overall gait included the total number of walking bouts, the total walking duration, and the total number of steps in 3 days. Quantity measures of gait per bout included the median walking bout duration, which is the median duration of all activity bouts, and median number of steps per activity bout. Quality-related measures included frequency measures, average step and stride duration, regularity measures, harmonic ratio, and the acceleration range. See Table 1 for all measures and their abbreviations. Further elaboration on these 2 stages can be found in the appendix.
Assessment of the largest bout of walking
The acceleration measures derived from the longest walking bout of each subject were evaluated as well. We speculated that the analysis of this walking bout might provide additional information of the subject’s walking abilities and fall risk.
Statistical Analysis
Student’s t tests were performed to compare between the fallers and nonfallers, as classified based on fall history, for the measures obtained in the laboratory and during the 3-day recordings. Normality was assessed using the Kolmogorov–Smirnov test. For the few measures that were not distributed normally, the Mann–Whitney test was used instead of the Student’s t test. Pearson’s correlations were performed to assess the associations between measures, for example, the laboratory and 3-day measures. Binary logistic regression (stepwise: backward conditional) was performed to assess the degree to which the different measures were able to identify fall status, using the retrospective and then prospective reporting of falls as the dependent variables. The log rank test (equivalent to the likelihood-ratio χ2 test) was used to compare models with and without the measures based on the 3-day recordings to assess their added value. Group values are reported as mean ± standard deviation. We performed corrections for multiple comparisons using the Hochberg–Benjamini method. 39 Statistical analyses were carried out using SPSS version 19.
Results
Subject Characteristics
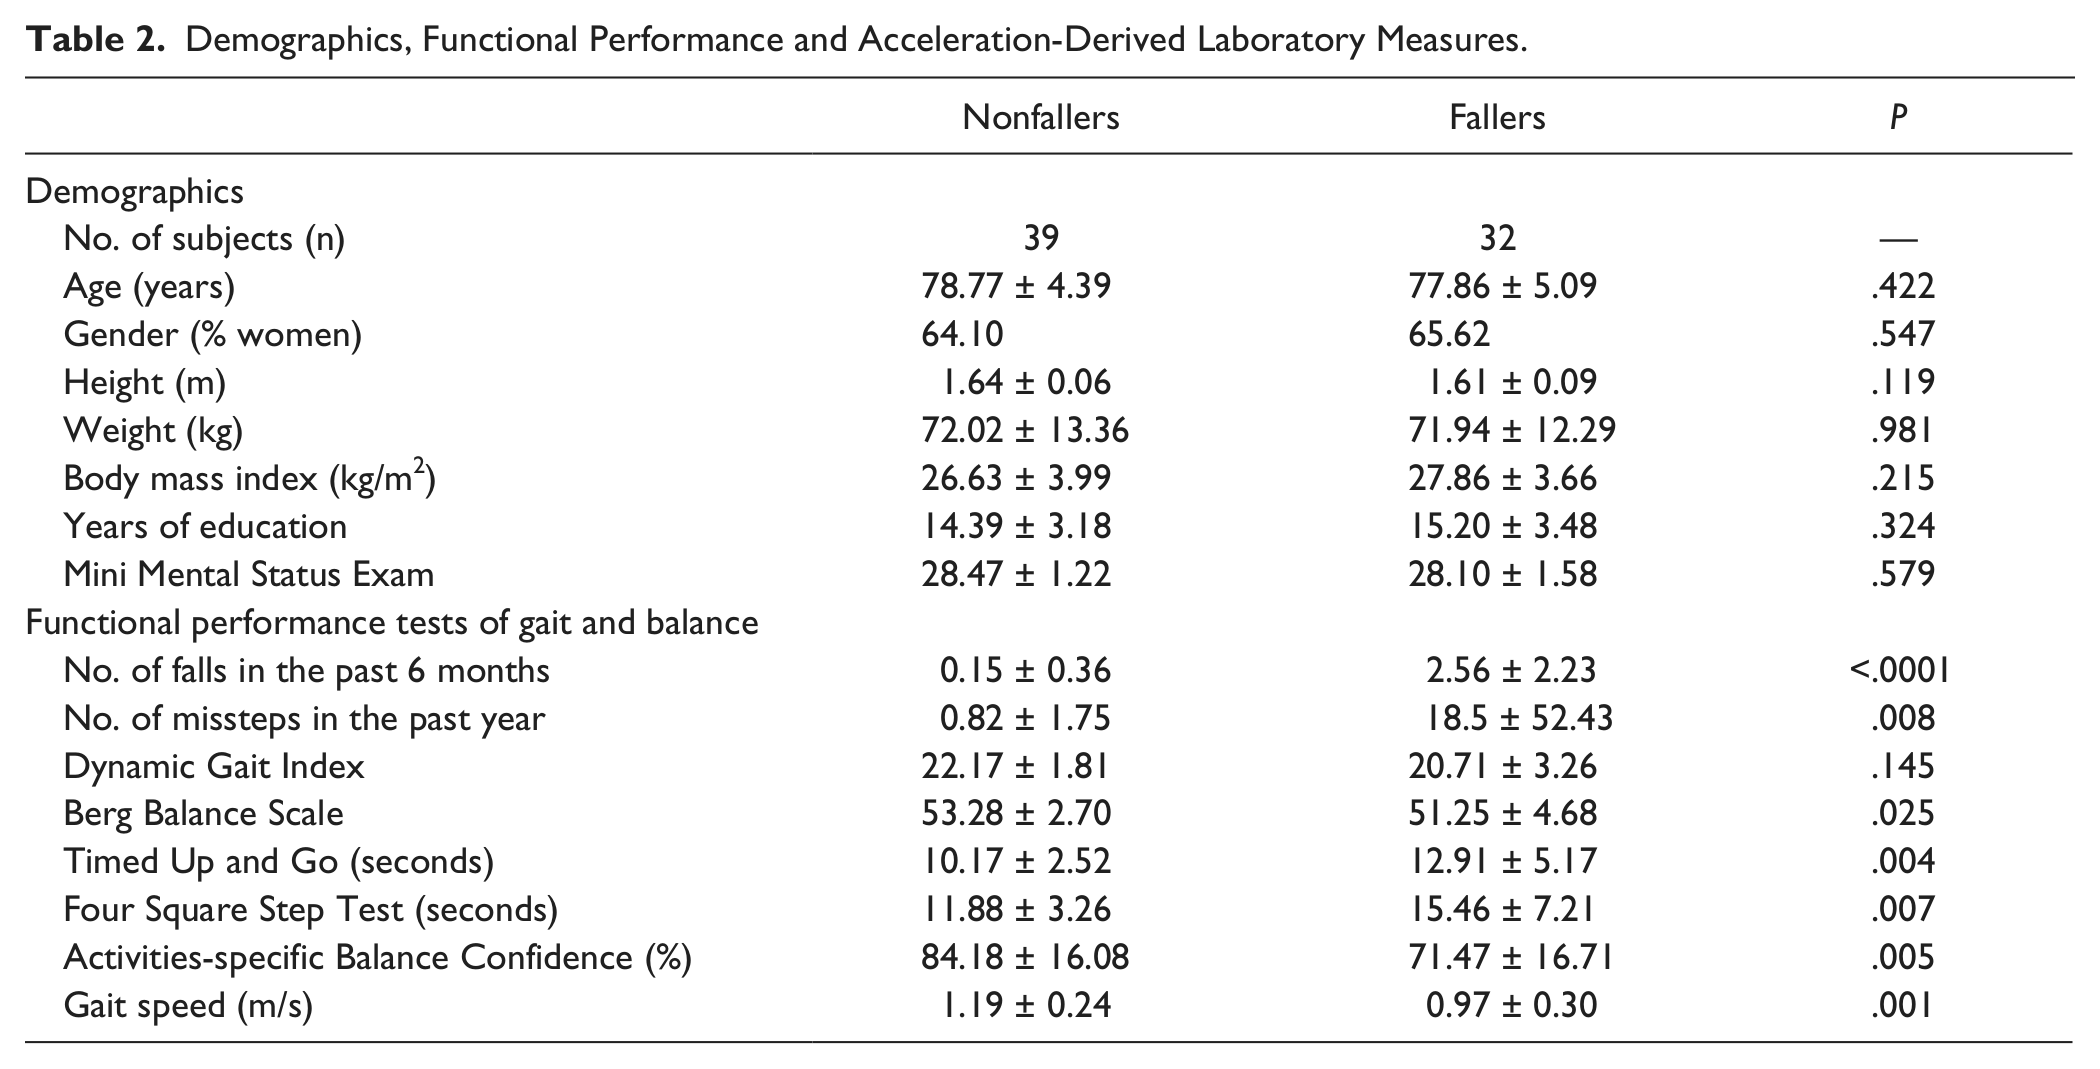
Based on fall history, subjects were classified as fallers (n = 32) or nonfallers (n=39). As shown in Table 2, the fallers and nonfallers were similar with respect to age, gender, years of education, height, weight, and body mass index. As expected, the fallers scored significantly worse on the functional balance and mobility tests. They performed significantly worse on the DGI test, the BBS test, the TUG test, and the FSST (P < .02). The 2 groups did not differ on the MMSE scores; however, the fallers had greater levels of fear of falling as reflected by the lower scores on the ABC test (P = .005).
Demographics, Functional Performance and Acceleration-Derived Laboratory Measures.
Laboratory Gait Measures
During the test of usual walking in the laboratory, gait speed was 1.19 m/s in the nonfallers and 0.97 m/s in the fallers (P < .001; see Table 2). On average, these values are similar to that reported in a cohort study of 3048 healthy elders aged 73.6 ± 5.5 years, 40 where the average gait speed was 1.12 ± 0.23 m/s. Step duration was significantly longer in the fallers (nonfallers, 0.52 ± 0.04 seconds; fallers, 0.55 ± 0.04 seconds; P = .005). However, the groups did not differ in the other gait measures.
Measures of Gait Based on the 3-Day Recordings
As shown in Table 3, the fallers and nonfallers did not differ on measures that reflect the amount of walking during the 3 days; however, many of the measures of gait consistency differed in the 2 groups. The fallers walked with significantly higher gait variability in the vertical axis and significantly lower variability in the mediolateral axis. This was expressed by the lower amplitude and slope of the dominant frequency in the vertical axis (P < .02. see Figure 2), and significantly higher amplitude and slope in the mediolateral axis (P < .02). The width tended to be higher in the fallers in the vertical and anterior-posterior axes and lower in the mediolateral axis, but these differences were not signficant. No significant group differences were observed for the regularity or harmonic ratio measures (P > .057).
Acceleration-Derived 3-Day Measures (of Periods ≥60 Seconds) of the 2 Groups.
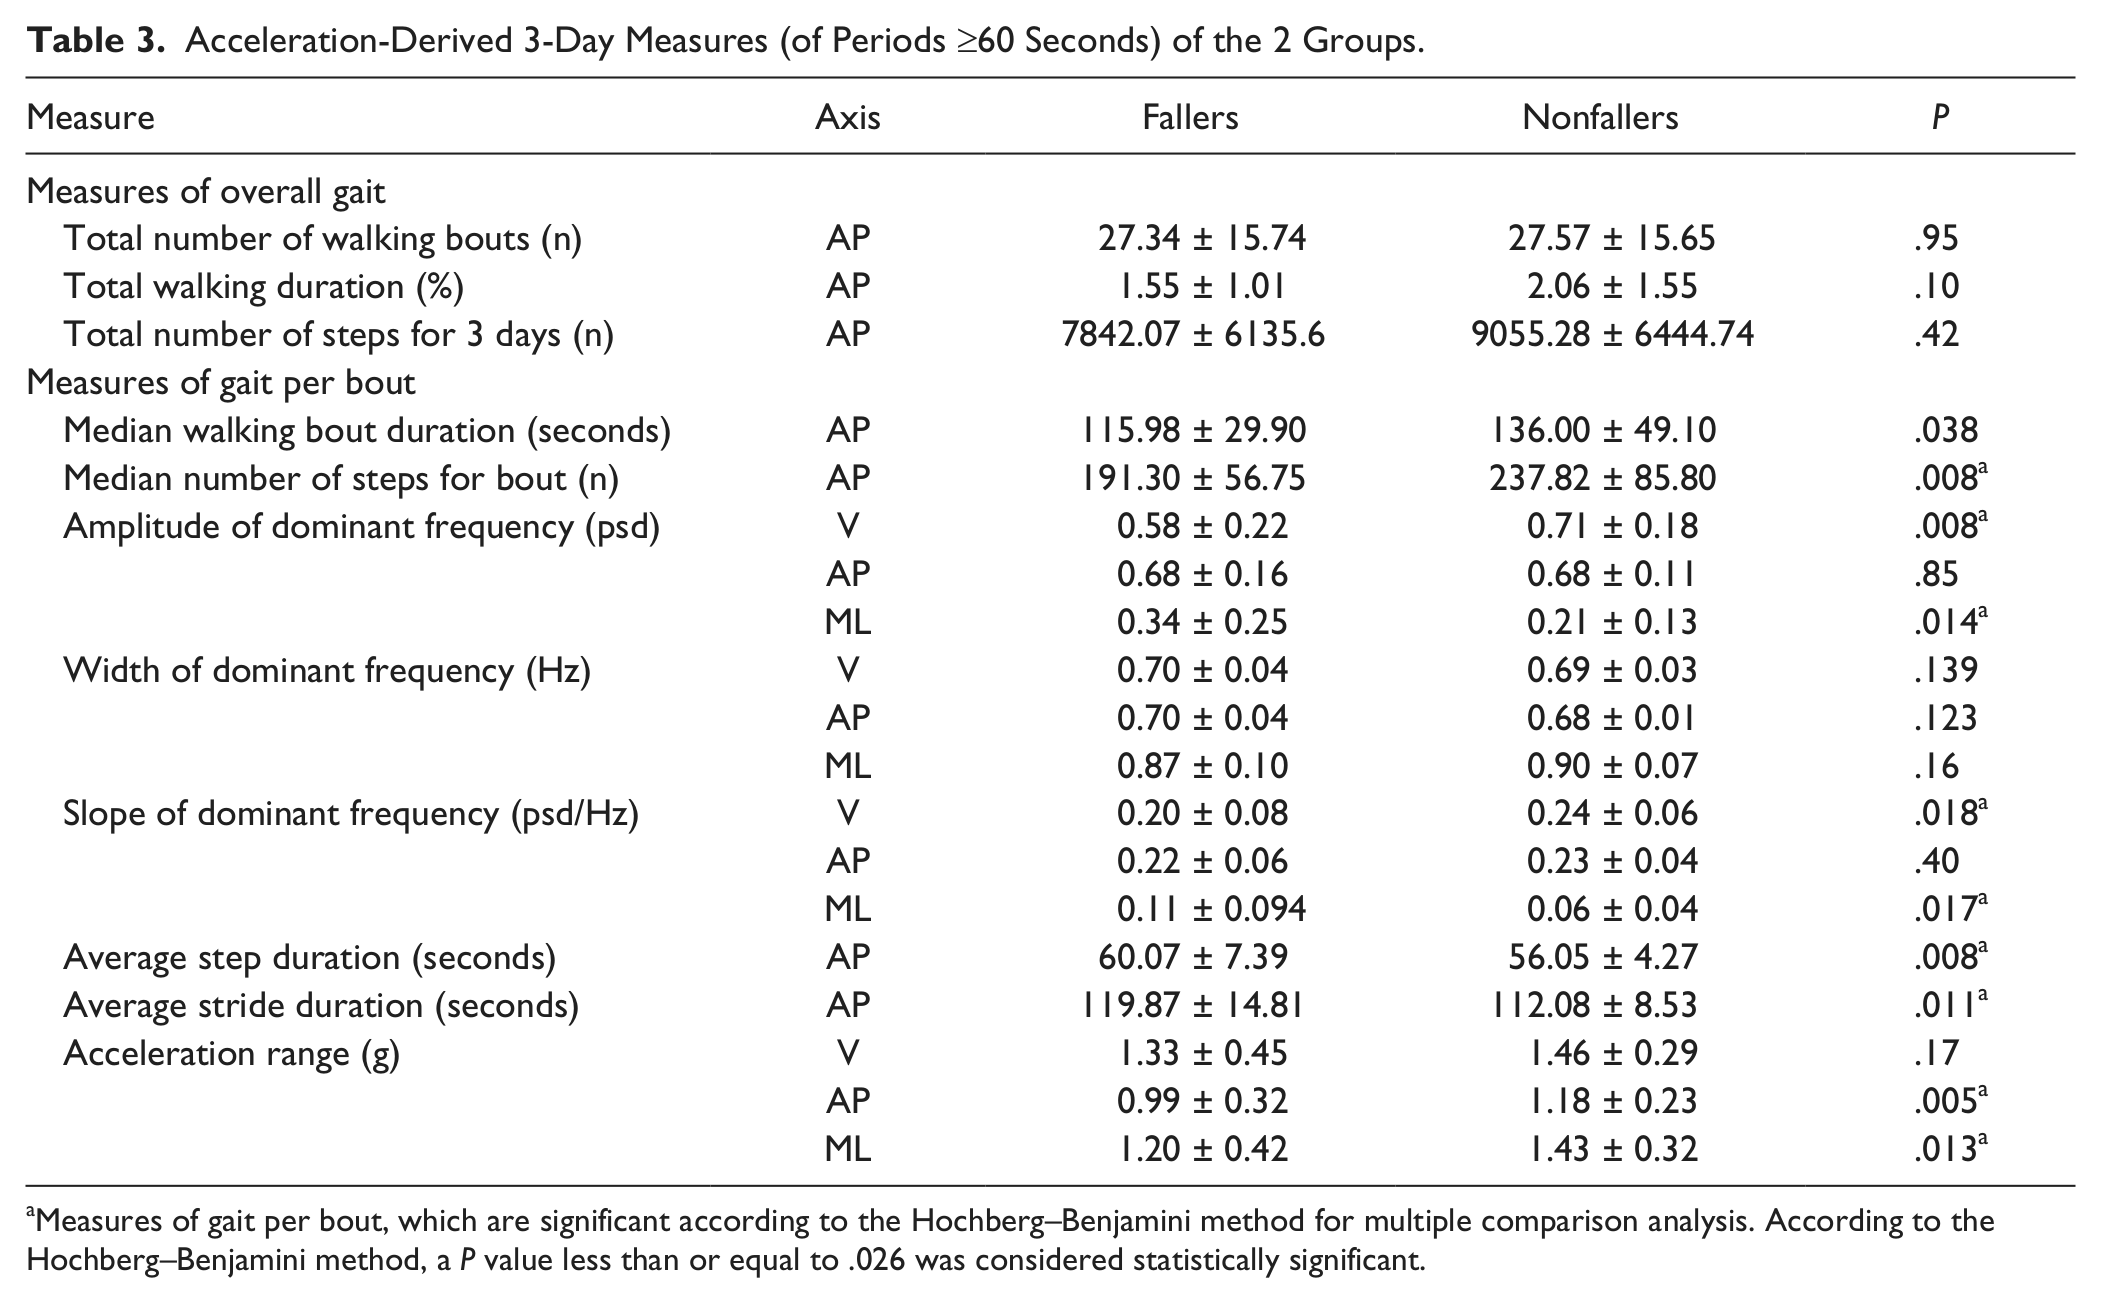
Measures of gait per bout, which are significant according to the Hochberg–Benjamini method for multiple comparison analysis. According to the Hochberg–Benjamini method, a P value less than or equal to .026 was considered statistically significant.
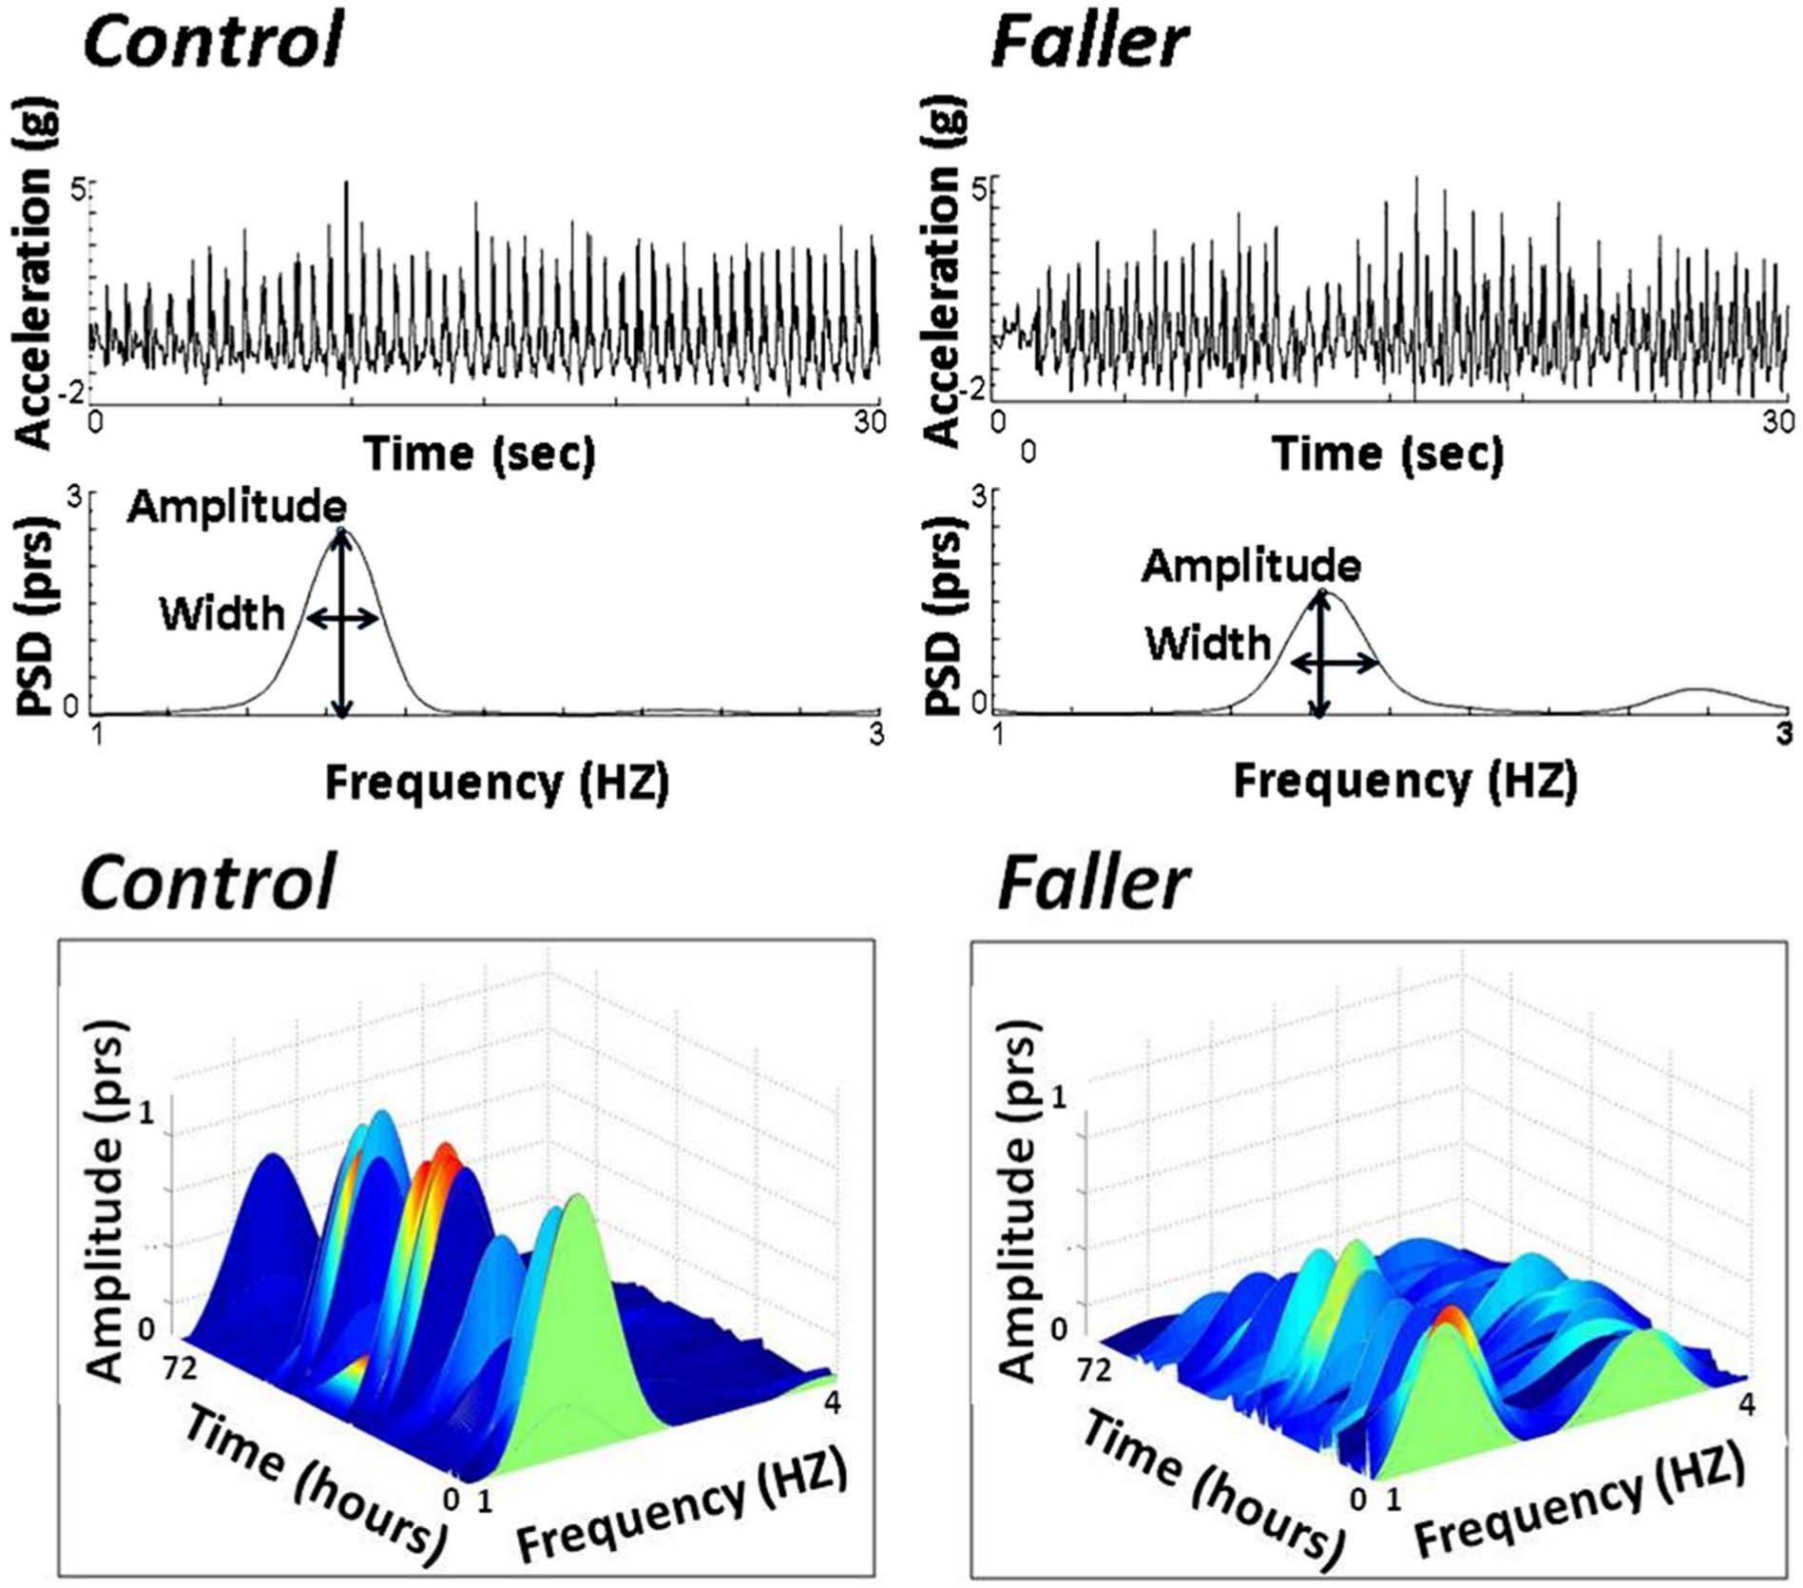
(Top) A typical example of 30 seconds of the anterior–posterior acceleration signal extracted from a faller and a control, nonfaller (based on fall history). The upper plots of raw acceleration and power spectral density (psd) plots illustrate that the faller has a less consistent gait pattern and that the psd peak amplitude is lower, reflecting greater step-to-step variability. (Bottom) The psd is plotted as a function of time over the 72-hour recording for the example faller and nonfaller. The reduction in the peak amplitude in the fallers can be readily observed.
Findings similar to the above were observed when evaluating the largest walking bout. There was no significant group differences in the size of the largest walking bout (nonfallers, 633.65 ± 405.01 seconds; fallers, 524.12 ± 319.36 seconds; P = .21) or in the number of steps of the largest walking bout (nonfallers, 1133.38 ± 746.30; fallers, 893.71 ± 650.88; P = .16). Measures of variability based on the largest walking bout differed in the nonfallers and fallers, similar to what was reported above.
Altogether, 69.2% of the nonfallers and 68.8% of the fallers wore the device for 3 weekdays. A total of 23.1% of the nonfallers and 31.2% of the fallers wore the device for 2 weekdays and 1 day over the weekend. A total of 7.7% of the nonfallers and 0% of the fallers wore the device for 1 week day and 2 weekend days. The distribution was not different in the 2 groups (P = .234).
Correlations With 3-Day Measures
Correlations with laboratory measures
Mild to moderate correlations were observed between many of the at-home measures and their corresponding in-laboratory measures of gait (r = .31-.74, P < .01). The highest correlation was observed for the mediolateral amplitude of the psd (r = .74, P < .0001), and the lowest correlation was observed for mediolateral width (r = .23, P = .07). Usual walking speed measured in the laboratory was correlated with 3-day derived measures of mediolateral and vertical frequency measures, step and stride duration, vertical and anterior–posterior harmonic ratio, ranges of acceleration in all axes, and sum of walking measures (r = .26-.56, P < .02).
Correlations with performance-based measures of fall risk
Mild to moderate correlations were observed between the at-home measures and the in-laboratory functional performance tests of fall risk. As shown in Table 4, scores on the BBS test, the DGI, the TUG, and the FSST were especially correlated with the vertical and mediolateral amplitude and slope, vertical and anterior–posterior width, step and stride duration, vertical and anterior–posterior harmonic ratio, and ranges of acceleration (r = .26-.57, P < .025).
Pearson Correlations Between Clinical and Acceleration-Derived 3-Day Measures r (P Value). a
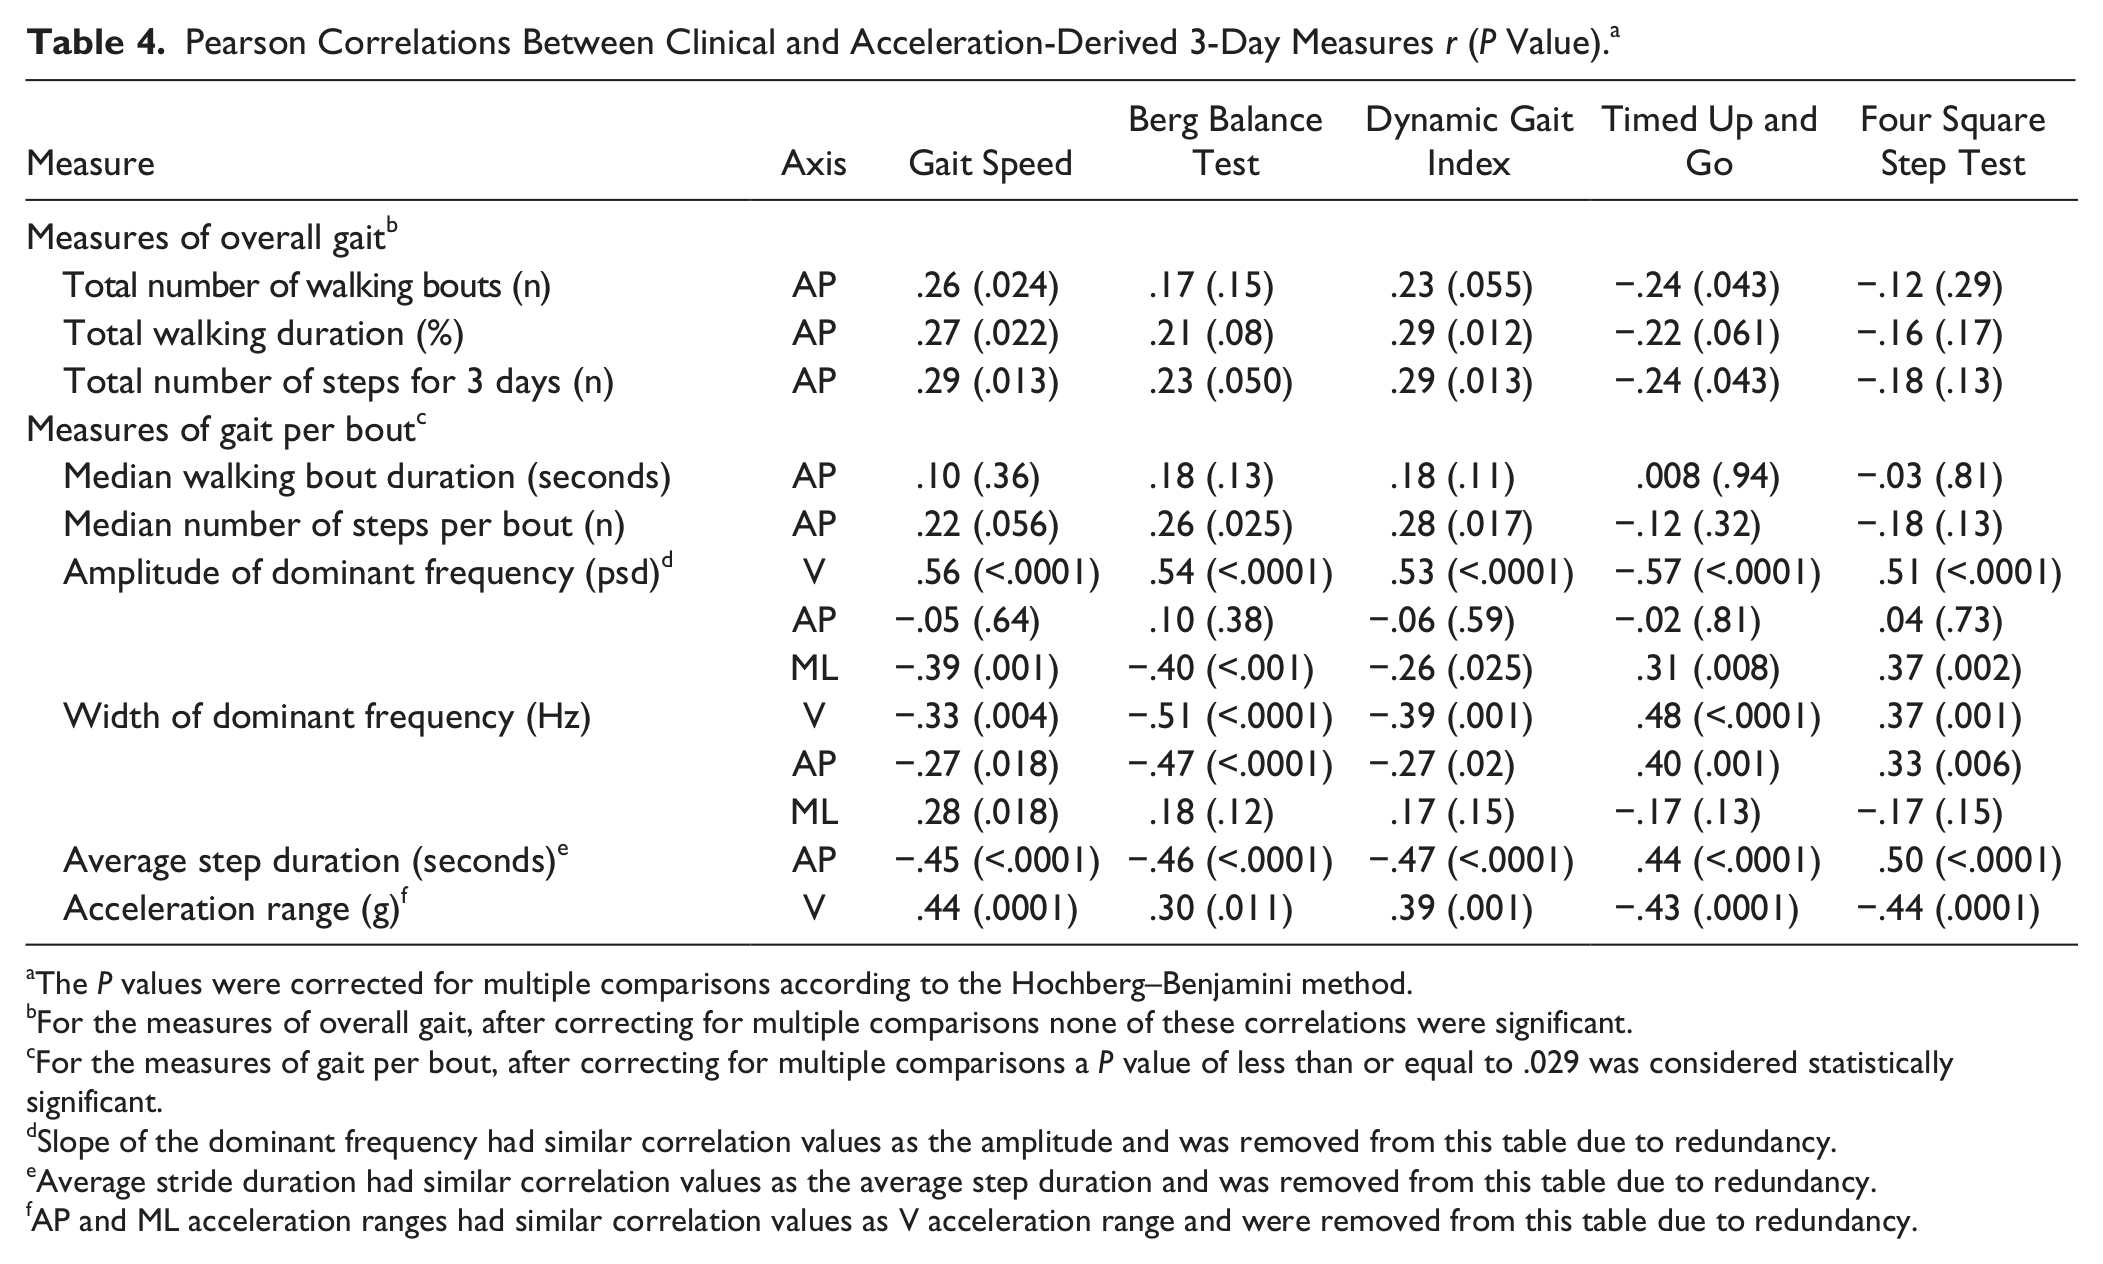
The P values were corrected for multiple comparisons according to the Hochberg–Benjamini method.
For the measures of overall gait, after correcting for multiple comparisons none of these correlations were significant.
For the measures of gait per bout, after correcting for multiple comparisons a P value of less than or equal to .029 was considered statistically significant.
Slope of the dominant frequency had similar correlation values as the amplitude and was removed from this table due to redundancy.
Average stride duration had similar correlation values as the average step duration and was removed from this table due to redundancy.
AP and ML acceleration ranges had similar correlation values as V acceleration range and were removed from this table due to redundancy.
Association With Fall History
We explored the added value of the measures derived from the 3-day recordings for discriminating between the fallers and nonfallers using binary logistic regression. In the selection process, we first included the performance-based measures of fall risk that were associated with fall history (from Table 2). We then added to the model any of the 3-day acceleration measures that were significantly or marginally (P < .15) different between the groups (from Table 3). We excluded measures that were highly correlated with each other (r ≥ .8) to assure robustness of the model. The performance-based measures of fall risk successfully identified 67.2% of the subjects as fallers or nonfallers (37.6% sensitivity, 89.5% specificity), with the FSST remaining in the final step (P = .028). With the addition of the 3-day acceleration-derived measures, 71.6% of the subjects were correctly classified (62.1% sensitivity, 78.9% specificity). The measures that remained in the final step were average step duration (P = .012), mediolateral amplitude (P = .023), age (P = .015), and median bout duration (P = .068). When comparing the basic model (without the acceleration parameters) to the model that also included the acceleration parameters based on the 3-day recordings, the log rank test indicated that the full model was significantly better (P = .001) than the basic model at identifying fall status.
Association With Future Falls
Twelve subjects reported 2 or more falls in the 6 months following the study. On average, they fell 4.0 ± 2.8 times. Binary logistic regression showed that the performance-based tests of fall risk successfully identified 84.2% of the subjects as future fallers or future nonfallers (33.3% sensitivity, 97.8% specificity), with the DGI remaining as the single independent predictor (P = .002). With the addition of the 3-day acceleration-derived measures, 94.7% of the subjects were correctly classified (75.0% sensitivity, 100% specificity). The measures that remained in the final step were total activity duration (P = .028), DGI (P = .008), age (P = .029), anterior–posterior acceleration range (P = .081), FSST (P = .083), and anterior–posterior width (P = .132). When comparing the basic model (without the acceleration parameters) to the model that also included the acceleration parameters based on the 3-day recordings, the log rank test indicated that the full model was significantly better (P = .004) than the basic model.
Discussion
The goal of this work was to evaluate the possibility of using continuous monitoring of everyday activity to assess fall risk in older adults as they ambulate freely in their home and community settings. Findings from this initial study suggest that meaningful measures that are characteristic of fallers can be extracted from these long-term recordings. Subjects carried out their routine activities of daily living, without any specific instructions or alterations in their typical routine. Thus, each subject’s walking pattern differed from the other and there was no predescribed, built in structure. Nonetheless, accelerometer-derived parameters were related to falls status, both retrospectively and prospectively, suggesting that the extracted features can be used as objective measures of fall risk.
The methods currently used for quantifying long-term walking in the home-setting usually involve commercial activity monitors (eg, pedometers) that produce count-related outcome measures. A recent review by Taraldsen et al 26 evaluated studies that included older adults who were monitored by an accelerometer for more than 1 day. Various measures of activity counts or recognition of performed activities were reported in healthy as well as in-care older adults. The measures that were reviewed included total activity duration, total number of steps taken, mean duration and mean number of steps per activity event, and the time spent in each activity. These methods generally reflect the quantity, but not the quality, of activity. Physical activity measured by these variables generally did not distinguish between the healthy and in-care samples. Moreover, none of the studies cited in this extensive review specifically focused on fallers or fall risk. Therefore, as far as we know, the present work is novel in directly comparing fallers to nonfallers based on their performance in the home setting. Furthermore, here we propose a method that is able to quantify not just the quantity but also the quality of gait. To our knowledge, this work is the first to examine measures related to the quality of gait and fall risk based on continuous, long-term monitoring during community ambulation.
Another approach for evaluating fall risk in the home setting involves the assessment of specific events such as real-world fall detection. 41 This method may provide valuable information on the number of real-life falls of a given subject and may be helpful in characterizing the fall itself. However, this approach typically requires long periods of time to collect the data (ie, many weeks or months) and involves complex data analysis. 41 In addition, fall detection algorithms with high levels of sensitivity and specificity in the real-world are not yet available. 41 The present approach required only 3 days of monitoring, making minimal demands on the subject, and used relatively straightforward data analyses.
In this study, we did not observe robust group differences between the quantity and overall walking counts. Nonetheless, the gait pattern of the fallers, as measured during the 3-day recording, differed from that of the fallers. Indeed, many of the gait changes observed in the 3-day recordings among the fallers are consistent with previous studies in laboratory-based setting. For example, the frequency-based measures demonstrate that fallers have higher gait variability in the vertical direction. This increased variability suggests that the fallers have a more impaired gait pattern, with less balance control, and increased stride-to-stride variability during everyday walking. Previous investigations have reported that fallers have increased stride-to-stride variability when they are assessed in the laboratory.4,22,23 To our knowledge, this is the first time that these findings are reported based on continuous recordings in at-home, natural settings.
In the mediolateral direction, the group differences were in the opposite direction (see Table 3). We observed lower mediolateral variability among the fallers, compared to the nonfallers. This dichotomy in the real-world gait characteristics is similar to several previous reports based on studies conducted in the laboratory.42 -46 Whereas increased variability in the vertical direction (and related step timing and length) has been related to an increased fall risk and poor control over gait rhythmicity, lower variability in the mediolateral direction may reflect a reduced ability to adapt to changing environmental conditions. This may represent a more rigid and less flexible left–right gait pattern, with possible deficits in the bilateral coordination of gait.42,45 The lower mediolateral and higher vertical variability of the fallers is supported by the work of Moe-Nilssen et al. 45 They showed that frail older adults walk with lower mediolateral variability, but higher anterior-posterior and vertical variability compared to fit elderly subjects, when tested in the lab. Moe-Nilssen et al further suggest that the vertical, mediolateral, and anterior–posterior directions represent different balance control strategies, 46 extending the hypothesis put forth by Gabell and Nayak several decades ago. 47 The present findings partially support this idea (ie, variability in the vertical and the mediolateral directions behaved differently). Thus, different constructs of locomotion should be included in the analysis of gait variability during at-home monitoring.
The significant correlations between the 3-day acceleration measures and their corresponding laboratory measures support the validity of these measures in the home setting. The 3-day acceleration-derived quality measures also seem to genuinely reflect fall risk, as demonstrated by the mild to moderate correlations with the functional performance test measures in the laboratory and the differences between the fallers and nonfallers. These findings take our previous work 11 two steps forward: in the original study, we focused on simulated activities of daily living. Here, we show that the algorithms actually can be used in the home setting and that the derived measures differ for the fallers and nonfallers. These results suggest that these metrics can serve as a proxy of fall risk, based on real-world performance.
Limitations and Future Directions
The study has several limitations, while generating questions for follow-up studies. For example, data were collected for 3 days rather than 7 days; a full week may more completely cover the possible activity range of a person. Three-day monitoring was used due to the battery life of the sensor. There are conflicting reports in the literature regarding the minimum number of days required for assessing activity. Scheers et al 25 note that at least 3 weekdays and 2 weekend days need to be monitored to obtain reliable measures of habitual physical activity. However, Graff et al 24 indicate that 3 days are sufficient to determine habitual physical activity compared to 6. While we did not attempt to control for the specific days of the week that were included in the monitoring (eg, weekdays or weekend days), 68% of the subjects were monitored for 3 weekdays. Since the emphasis here was on the quality of gait rather than quantity assessment methods, we speculate that quality may, perhaps, be less affected by the day of the week. Future studies using recently released hardware will allow continuous monitoring up to 7 days for comparison.
In the future, further algorithm development may more fully explore the advantages and disadvantages of various algorithm parameter settings (eg, the minimum size of a walking bout) and extract additional, relevant measures. For example, the angular velocity signals can provide more information on the direction and type of movement and trunk tilt. This may augment the ability to describe the specific conditions of the walking activity as well as transitions to and from various activities (eg, turning vs straight line walking, indoor vs outdoors walking).48,49 A limitation of the study is that our methods treat the entire walking portion as a whole and do not distinguish between different walking conditions. Our assumption, however, is that since most of the longer periods of walking are performed in daily living, nonstandardized settings, they most likely involve complex conditions and reflect less controlled walking. One may also enhance the proposed methods by combining them with techniques that identify specific episodic events (eg, missteps, falls).41,50 Investigation of specific gait events such as transitions and gait initiation may also provide additional, perhaps independent information that could augment the prediction of fall risk. Evaluating higher frequency bands may also hold potentially useful data for future analysis, for example, the identification of body sway prior to falls or freezing of gait events in patients with Parkinson’s disease. Future work can address why some at-home measures are similar to those observed in the laboratory, while others are not (eg, contrast to the findings of Menz et al 51 ). The present findings are a starting point towards a tool that can be used by clinicians to better assess and understand fall risk in the home setting. 27 The retrospective and prospective results are promising; larger scale studies with longer follow-up are needed to further refine and assess this and expand our results
Conclusions
The proposed sensor method for the assessment of fall risk of older adults in daily living conditions appears to provide valuable information on the quality and quantity of walking in the home setting. Three days of acceleration-derived measures are sensitive to fall risk, distinguish between subjects who have a high and low fall risk, and capture properties of gait that are complementary to those evaluated by traditional performance-based tests.
Footnotes
Appendix A
Acknowledgements
The authors wish to thank Eran Gazit for his helpful input on data analysis, and specifically for his contribution of the frequency-based activity-monitor filter; Inbal Maidan, Roy Tzemah for clinical supervision and data collection; and Ariel Tankus, Tal Freedman, and Hagar Bernad for helpful input. We thank Dr Elliot Sprecher for help with biostatistics.
Authors’ Note
Declaration of Conflicting Interests
The author(s) declared no potential conflicts of interest with respect to the research, authorship, and/or publication of this article.
Funding
The author(s) disclosed receipt of the following financial support for the research, authorship, and/or publication of this article: This work was supported in part by the National Institute on Aging (5R21AG034227), the Israel Science Foundation, and the European Commission (FP7-ICT-2011-7-ICT-2011.5.4—Contract No. 288878).