
Abstract
Objective. To develop an automated and objective method to assess mobility in Parkinson disease (PD) patients in daily-life settings and to investigate whether accelerometer-derived measures discriminate between PD and healthy controls as they walk and simulate activities of daily living (ADL). Methods. Healthy older adults (17) and patients with PD (22) wore a triaxial accelerometer on their lower back during short walks (validation study) and during a walk around the medical center to simulate daily activities (ADL simulation). The variability (consistency and rhythmicity) of stepping was assessed. The patients completed the walks before and after taking their anti-Parkinsonian medications. Frequency-based acceleration measures included dominant frequency, amplitude (strength of signal frequency), width (frequency dispersion), and slope (a combination reflecting amplitude and width) of the main frequency of the power spectral density in the 0.5- to 3.0-Hz band. A subset of the Unified Parkinson-Disease Rating Scale provided a clinical measure of gait impairment (UPDRS-Gait5). A PD patient and control wore the sensors for 3 days at home. Results. The width was larger, and the amplitude and slope were smaller in the PD patients compared to the controls in the validation study and ADL simulation (P < .02). The width decreased, and the amplitude and slope increased when patients took anti-Parkinsonian medications (P < .007). Significant correlations were observed between acceleration-derived measures and UPDRS-Gait5. The data obtained at home was similar to the clinic data. Conclusions. Frequency-derived measures are valid and sensitive estimates of stride-to-stride variability that can be used to assess the quality and consistency of walking in patients with PD in real-life settings.
Introduction
Among the motor symptoms of Parkinson disease (PD), postural instability and gait disturbances (PIGDs) are particularly limiting as they may lead to falls, loss of mobility, and reduced independence. The typical clinical assessment of patients with PIGD does not adequately reflect their actual status during daily life. For example, participants may exert more effort, artificially enhancing performance, when they are examined in outpatient clinics. 1 Ambulatory assessment of patients during activities of daily living (ADL) could, potentially, serve as an approach for quantifying the quality of gait and locomotion outside the clinic, similar to the way in which a heart rate Holter monitor evaluates cardiac function over a relatively long time. The long-term aim of the present research is to develop an “at-home” test with sensors suitable for ambulatory monitoring of mobility in the daily living environment among PD patients and perhaps, in the future, in other patient populations.
A variety of commercialized activity monitors and sensor configurations were previously proposed for activity monitoring of PD patients. For example, White et al 2 examined the reliability of an activity monitor in PD patients by calculating measures such as the percentage of time spent in different activities, the total number of transitions, and stride frequency. Van Hilten et al 3 and others, 4 and Garcia Ruiz and Sanchez Bernardos 5 used a wrist-worn activity monitor to examine mobility patterns in PD patients. Salarian et al 6 examined activity patterns in PD patients (eg, tremor and bradykinesia) by placing 2 gyroscopes on the forearms and 3 inertial sensors on the shanks and trunk. 7 Dijkstra et al 8 used a triaxial accelerometer to detect the durations of gait and postures in patients with mild to moderate PD during domestic activities in the home. A major focus of these studies is posture detection and the time spent in each type of posture and activity.
We were especially interested in measures reflecting the quality of gait among patients with PD as they ambulate in real-life settings. Zijlstra 9 previously assessed temporal and spatial gait parameters in healthy young and elderly participants during unconstrained walking in a corridor using a lower-trunk triaxial accelerometer. Measures included the duration of subsequent stride cycles and left/right steps as well as step length and walking speed. Participants were required not to make abrupt corrections of gait direction and speed during their walking. In real-life settings, for example, the home environment, the task of assessing the quality of gait becomes even more challenging. Walking is dotted with transitions, starts, stops, and turns. In PD patients, tremor, shuffling, and dyskinesia may also operate in the background, making it more difficult to quantify gait.
One well-known measure that reflects the quality of walking is gait variability. Gait variability quantifies the consistency and rhythmicity of stepping. In general, patients with PD are not able to walk with a consistent gait pattern, and thus, the magnitudes of the stride-to-stride fluctuations of the gait pattern (eg, stride time) are much larger than in healthy controls. Variability in the timing of the gait pattern is associated with PD symptoms; this becomes smaller in response to anti-Parkinsonian medications, indicating a more consistent gait pattern, and is related to fall risk among patients with PD and in other populations.10-16 Using footswitches, studies performed in laboratory settings show differences in gait variability between controls and those with PD, even among patients who were only recently diagnosed, and responsiveness to challenges and therapy.17-23 These reports suggest that gait variability may measure at-home walking quality. However, measures of gait based on footswitches typically assume a straight-line walking trajectory under clearly defined conditions. Here, we investigate the properties of acceleration-derived measures that reflect gait timing and variability, focusing on their utility to evaluate PD patients, outside the laboratory, as they walk while simulating typical ADL.
In this research, we used a simple sensor configuration that could readily be adapted for long-term and home-based use: a single waist-mounted 3D linear accelerometer. We used frequency-domain measures to quantify gait variability in the daily-living environment, instead of traditional temporal-based measures. The latter may be appropriate for use inside the laboratory or clinic when the conditions are clearly defined and where starting, stopping, and other disruptions of walking are not an integral part of the protocol. Specifically, we sought to prepare the way for long-term monitoring using frequency-derived measures of a single accelerometer by investigating 3 questions: (a) Do these measures differ in patients and healthy controls when they carry out walking that simulates ADL? (b) Are these measures associated with clinically meaningful measures of PD symptoms? (c) Do these measures respond to anti-Parkinsonian medications? We also examined associations within the measures to determine how they were related to each other.
Methods
Participants
Consecutive PD patients fulfilling the UK Parkinson’s Disease Society Brain Bank Criteria were evaluated. The PD patients were recruited from the outpatient clinic of the Movement Disorders Unit of the Tel Aviv Sourasky Medical Center. The inclusion criteria for the PD patients were age between 50 and 80 years, Hoehn and Yahr stage 1.5 to 3.0, and use of dopaminergic treatment. General cognitive function was assessed using the Mini-Mental State Examination (MMSE), 24 a widely used screening test for dementia. The Unified Parkinson’s Disease Rating Scale (UPDRS) 25 was used to assess disease severity and clinical symptoms. Participants with a clinically significant history of stroke, brain surgery, dementia (MMSE < 24), major depression, traumatic head injury, uncontrolled diabetes mellitus, and other conditions that may alter walking or require an assistive device were excluded. A healthy, age-matched control group was recruited from local senior centers. Participants were 50 to 80 years of age, had no medical conditions that affected their gait, and a MMSE > 24.
Materials
Participants wore the Mobi8 ambulatory monitoring system (TMSI International). The Mobi system is a multichannel data logger (dimensions 11.4 × 9.8 × 3.7 cm3, weight 165 g, powered by 2 AA batteries) that is connected to a 3D acceleration sensor (Analog Devices ADXL330; range ±3g; 300 mV/g at the output). Sensor dimensions and weight were 13 × 10 × 5 mm3 and 20 g. The accelerometer was worn on the lower back at a point that approximates the body’s center of mass. The 3 axes measured were anterior-posterior, vertical, and mediolateral (AP, V, and ML, respectively). The data were sampled at 256 Hz, and were acquired via a flash memory card and downloaded to a personal computer for further processing using custom software written in MATLAB (The Mathworks, Inc).
Walking Protocols
The validation study included a 1-minute, straight-line walk at a self-selected, comfortable pace inside a long hallway. This walk was used to demonstrate that the accelerometer-derived measures have clinical meaning (ie, differ between patients and controls) during straight-line walking. The patients with PD first performed this walk in the morning, while off medications, at least 12 hours after they last took their anti-Parkinsonian medications. After completing the gait protocol and clinical evaluation, they took their regular anti-Parkinsonian medications, and when they reported that the medication effect peaked, testing continued (usually 45-60 minutes later). In this state, the patients performed a second straight-line walk (~25 m, ×2). The control group carried out the same walking protocols with similar time differences between parts.
During the ADL simulation, participants completed a 500-m walk around the hospital at their comfortable, self-selected walking speed. This walk simulated daily living walking and included exiting the gait laboratory, walking in a crowded environment through the hospital’s hallway, walking to an outdoor area and then outside, going down a flight of stairs, turning back and entering the hospital through another entrance, visiting in the hospital’s book store, and returning to the gait laboratory. The ADL simulation also included resting (eg, sitting) for those who had difficulty performing these tasks all at once. The PD group carried out this task after taking their anti-Parkinsonian medications.
Temporal-Based Acceleration Measures
Temporal measures included the average stride time (s) and stride time variability (coefficient of variability [%]) derived from the acceleration time series. The details of this analysis are provided in the appendix. The temporal measures were only applied to the validation study (ie, well-defined, straight-line walking) for the purpose of validating the frequency measures. They were not applied to the ADL simulation because they are not valid in real-life settings without extensive filtering to account for the many obstacles and interruptions that this path included.
Frequency-Based Acceleration Measures
The frequency measures calculated for both the validation and ADL parts (please see online appendix) included the frequency (Hz), amplitude (psd), width (Hz), and slope (psd/Hz) of the dominant harmony of the power spectral density (psd) in the locomotor band of the acceleration signal. The width is a measure of frequency dispersion and is related to variability. The amplitude is more related to the dominance (or strength) of the frequency in the signal. The slope is a combination of the amplitude and the width and reflects both the periodicity and the frequency dispersion. We speculated that a larger width, lower amplitude, and lower slope of the dominant frequency would all reflect greater stride-to-stride variability and a relatively less consistent gait pattern.
Clinical Evaluation
Five UPDRS motor items representing PIGD were extracted to provide a more general clinical measure of gait 26 ; these were based on UPDRS items that evaluated falling, freezing of gait, walking, postural stability, and gait. The sum of these 5 scores was taken and referred to as UPDRS-Gait5. 26
Statistical Analysis
Group mean values are reported as mean ± standard deviation. Student t tests (2-tailed) were used to compare the 2 groups, and paired t tests were applied to assess within-group changes (eg, the effects of anti-Parkinsonian medications). A P value below .05 was considered as significant. Pearson correlation coefficients were used to estimate correlations between measures. Statistical analyses were performed using SPSS software.
Results
A total of 22 patients with PD were studied (mean age: 65.9 ± 5.9 years, range 55-79 years; mean disease duration: 4.8 ± 3.8 years, range 1-16 years; Hoehn and Yahr Scale off anti-Parkinsonian medications: 2.5 ± 0.4, range 1.5-3; mean of the UPDRS total score off anti-Parkinsonian medications: 42.4 ± 15.7; mean of the UPDRS Motor score while off anti-Parkinsonian medications: 23.6 ± 9.4; 31.8% were women). Also, 17 healthy older adults (mean age: 69.9 ± 8.8 years, range: 50-78 years; 52.9% were women) who were free of neurological, orthopedic, or other history likely to affect their gait served as a control group.
An example of the raw acceleration and the power spectra from a patient and a control is shown in Figure 1. The figure demonstrates how the peak amplitude of the patient is about half the size of the amplitude of the control. Compared with the control, the width was larger, and the slope was smaller in this patient with PD. As described further below, these frequency spectra are typical of the patient and control cohorts.
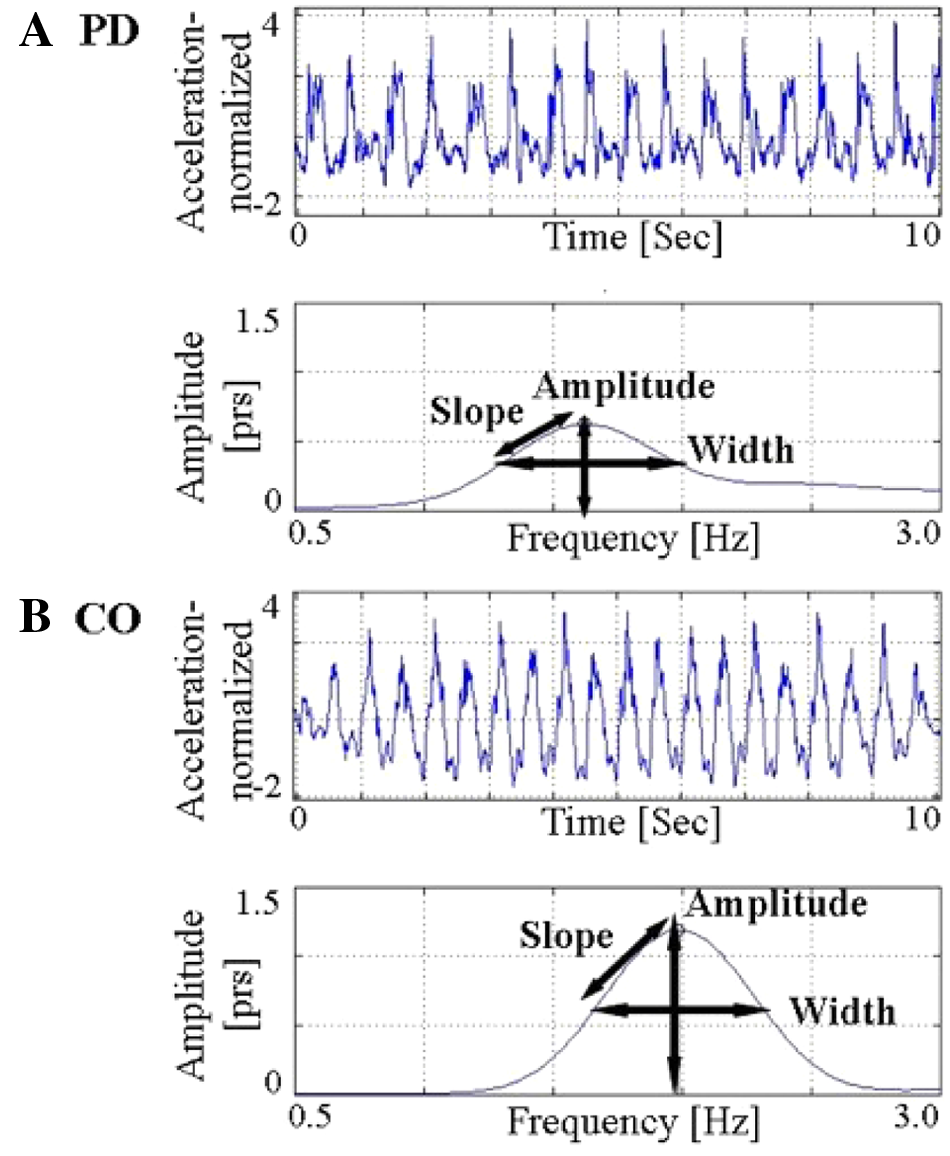
Comparison of raw normalized acceleration data and frequency-based measures in a patient with (A) Parkinson disease (PD) and (B) a control (CO). PRS: power per radians per second. This is synonymous with PSD.
Accelerometer-Based Measures During the Validation Study
In Table 1, we summarize the results of the validation study. Average stride time, stride time variability, and width were significantly higher in the patients with PD compared with controls. The dominant frequency, amplitude, and slope were significantly lower in patients with PD. For example, the amplitude was 0.67 ± 0.22 psd in patients with PD and 0.94 ± 0.16 psd in controls (P < .0001). Table 2 summarizes the associations between the temporal and frequency-based measures. Average stride time was highly correlated with dominant frequency, as might be expected. Stride time variability was most highly correlated with width. Other correlations were lower in magnitude. Table 3 shows that among the PD patients, the dominant frequency, amplitude, and slope were significantly lower when patients were not on medications compared with when they were using medications, whereas the width was significantly higher. In other words, acceleration-derived measures indicated a more consistent and rhythmic gait pattern in response to anti-Parkinsonian medications, as expected.
Between-Group Comparisons
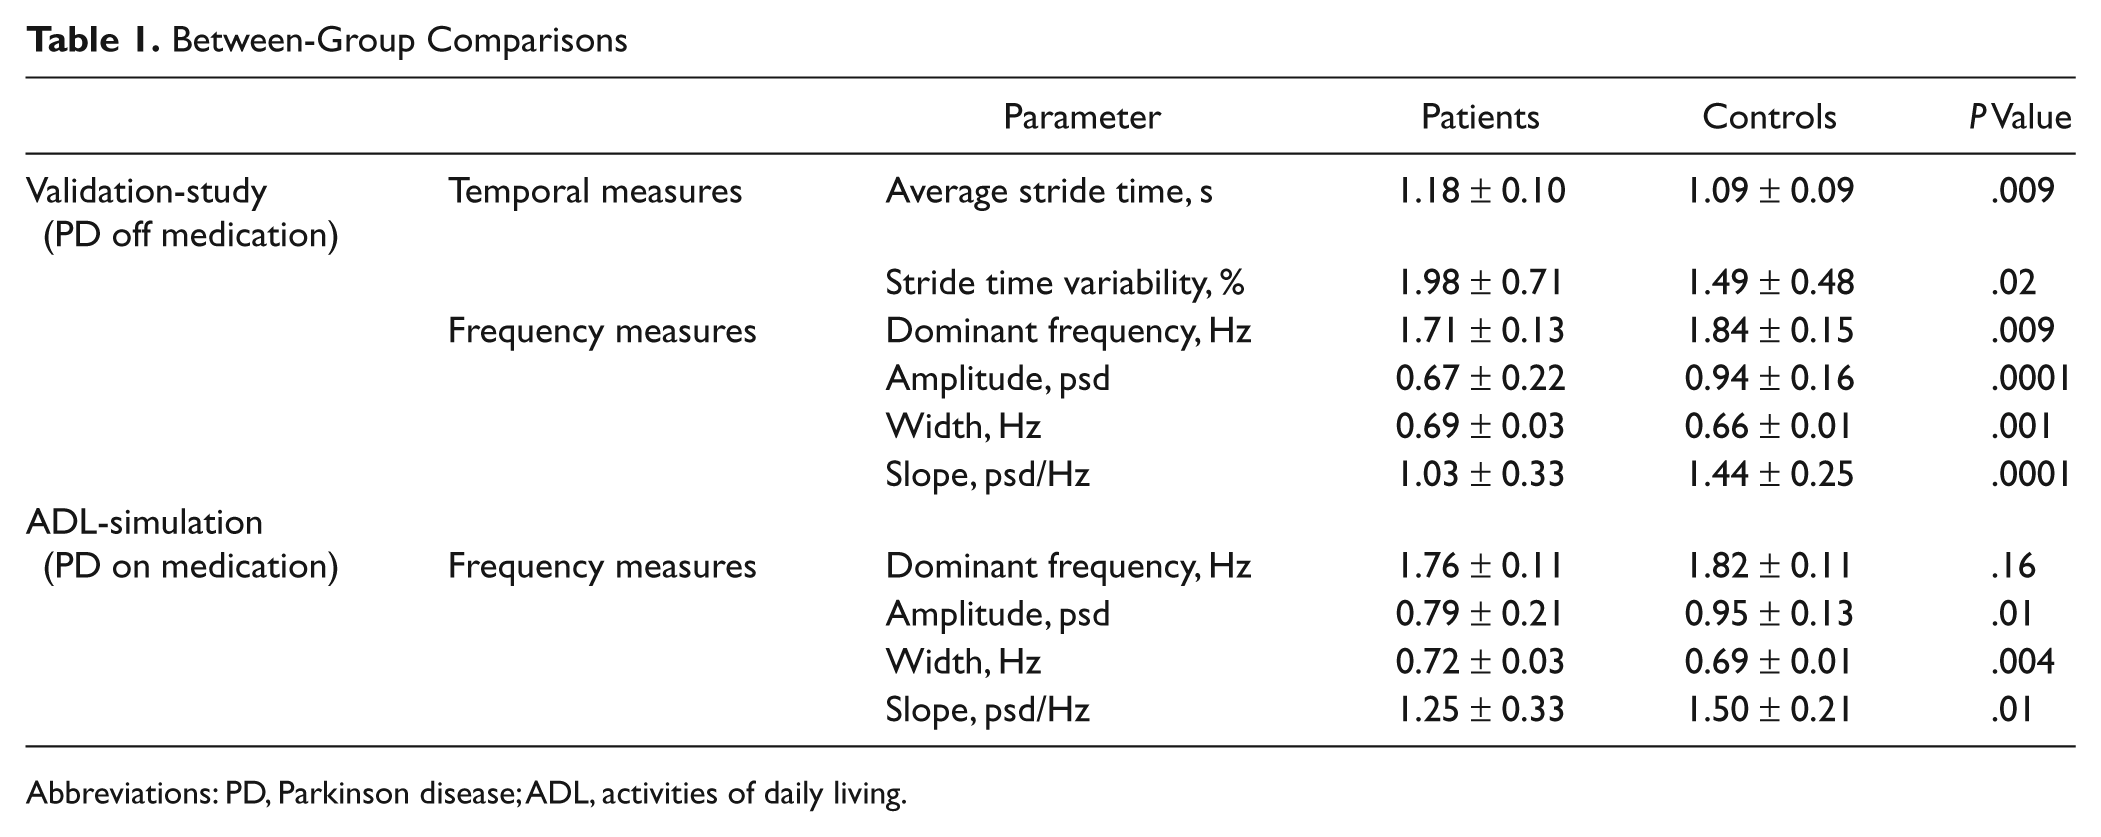
Abbreviations: PD, Parkinson disease; ADL, activities of daily living.
Validation Study: Correlation Between Frequency-Based and Temporal Measures in the Validation Study a
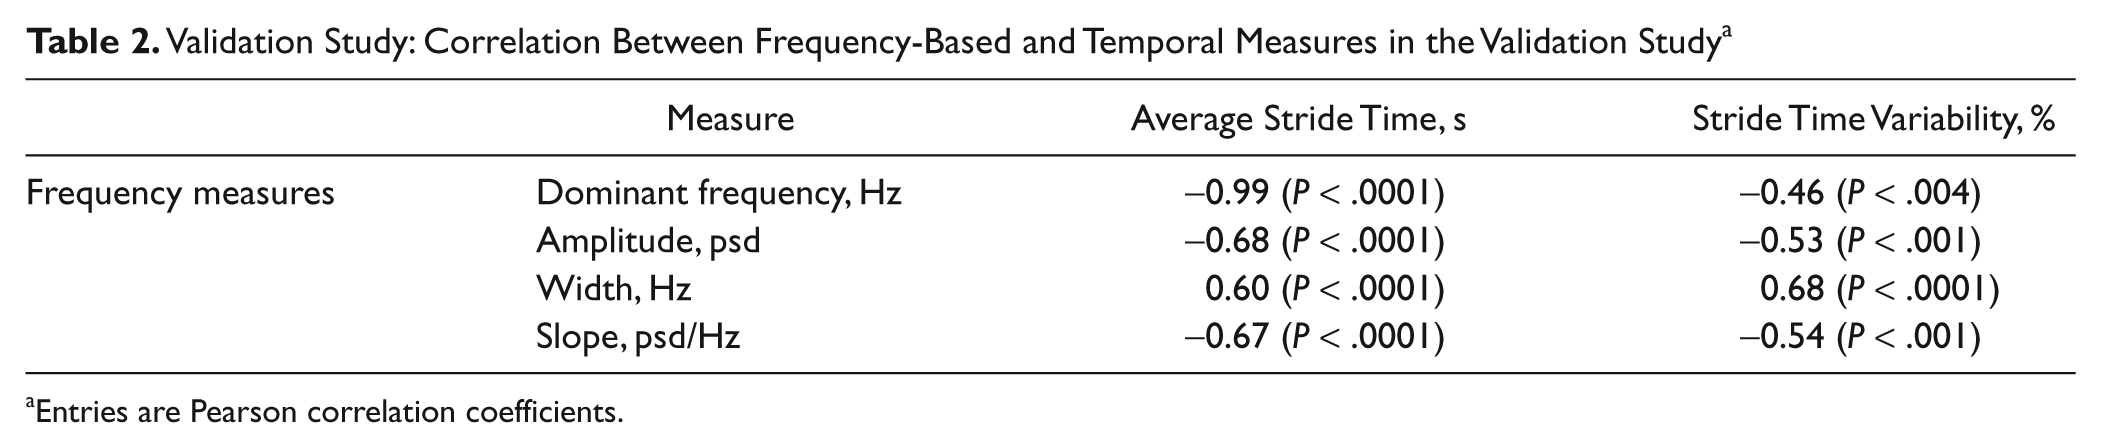
Entries are Pearson correlation coefficients.
Validation Study: With and Without Medication Comparisons Among Patients With Parkinson Disease
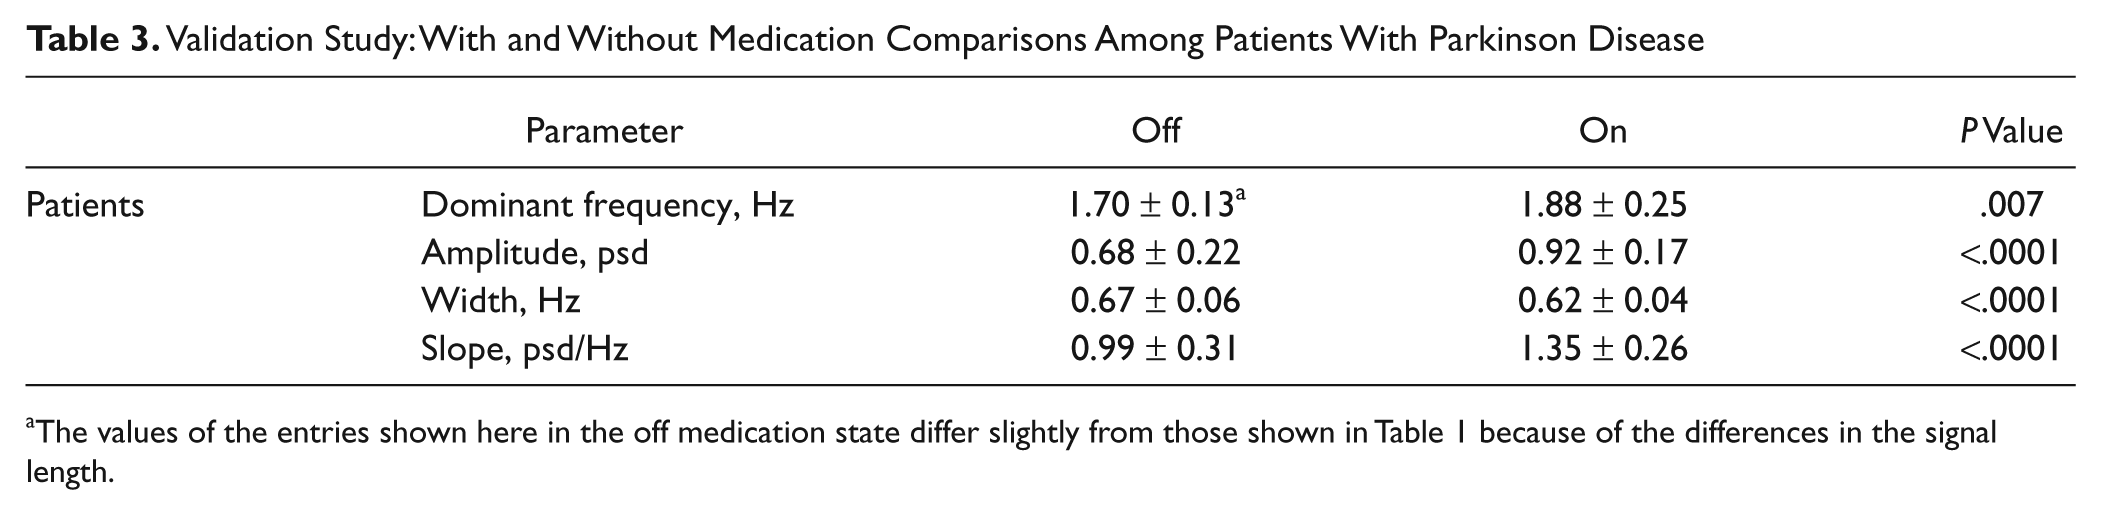
The values of the entries shown here in the off medication state differ slightly from those shown in Table 1 because of the differences in the signal length.
Among the patients with PD, there were no correlations between the UPDRS total, UPDRS motor, Hoehn and Yahr, and acceleration (temporal or frequency) measures while the patients were off their anti-Parkinsonian medications. However, in this state, there was a significant correlation between UPDRS-Gait5 and average stride time (r = 0.50; P < .03) and between UPDRS-Gait5 and dominant-frequency (r = −0.50; P < .02).
Accelerometer-Based Measures During the ADL Simulation
The average total time to complete the ADL simulation was 10.24 ± 1.79 minutes for the controls and 12.20 ± 1.89 minutes for the patients. This total time to complete the ADL simulation includes the sedentary as well as the locomotor portions of the trial. The average locomotor activity time was 9.30 ± 1.53 minutes for the controls and 10.55 ± 1.82 minutes for the patients.
The amplitude and slope were significantly lower in the patients, compared with controls. The width was significantly higher (P < .004) in patients with PD (0.72 ± 0.03 Hz) compared with the controls (0.69 ± 0.01 Hz). No significant group difference was found in the dominant frequency (Table 1). The differences in the frequency-domain measures are illustrated in Figure 2. Power spectra of the acceleration signal obtained from the ADL simulation are plotted for 1 PD patient and for 1 control in 10 successive windows of 30 s each (spanning the 5-minute period that was analyzed). When applying these measures in at-home, real-life settings, it may be informative to examine changes over time. Figure 2 demonstrates the possibility of applying these measures using a relatively short window—the same size as used when assessing the effects of medication. In this example, the extracted parameters are consistent over the ADL simulation, suggesting that the differences between the patient and control persisted throughout the 5 minutes.
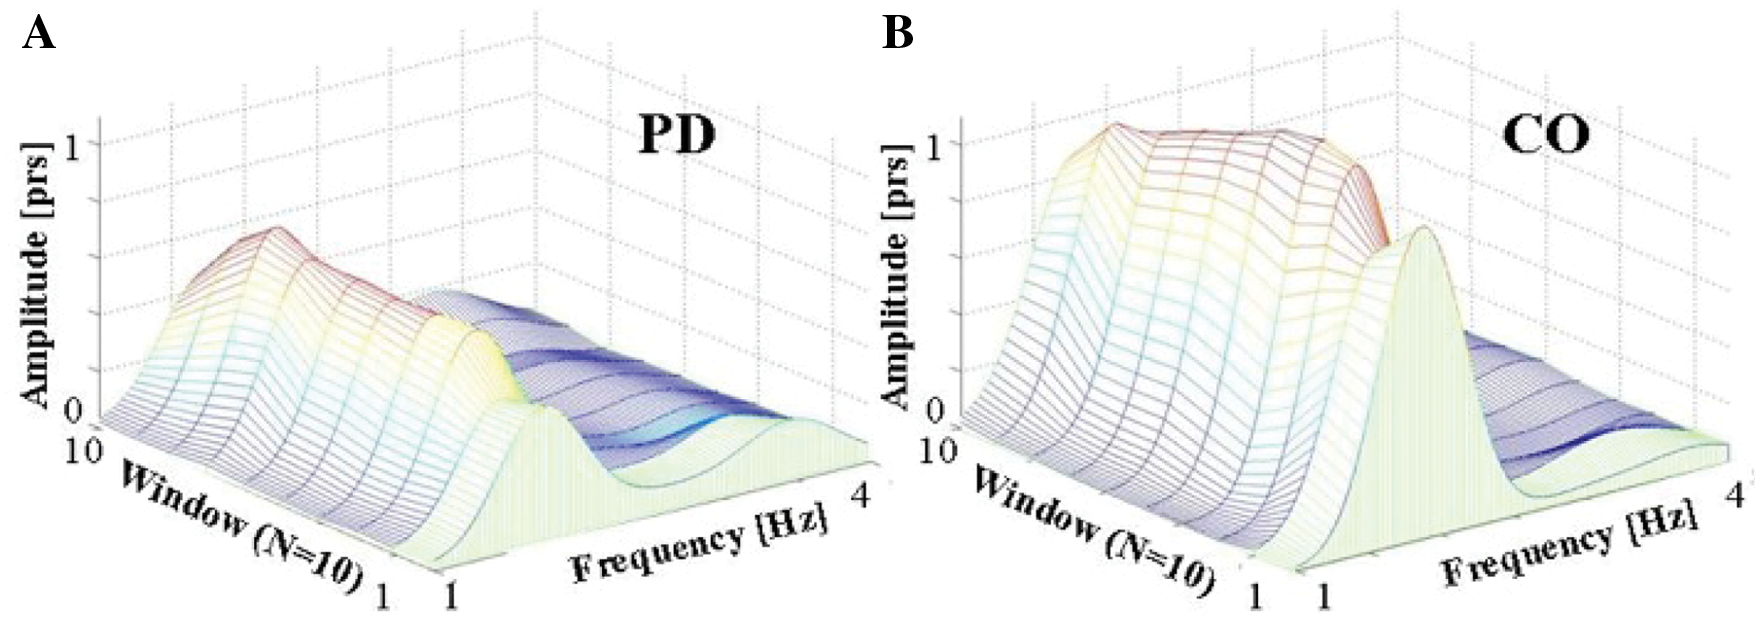
Comparison of a 3-dimensional plot of the amplitude in the frequency domain of the 5-minute activities of daily living simulation in 10 successive windows of 30 s each in (A) a patient with Parkinson disease (PD) and (B) a control (CO).
Correlation Within Frequency Measures
As expected, the frequency measures among all participants were significantly correlated with each other. In the ADL simulation trial, the width was inversely correlated with the dominant frequency (r = −0.36; P < .02), amplitude (r = −0.77; P < .0001), and slope (r < −0.78; P < .0001). The frequency was positively correlated with amplitude (r = 0.49; P < .002) and slope (r = 0.48; P < .002), and the highest correlation was achieved between amplitude and slope (r = 0.99; P < .0001). Similar results were obtained for the validation study. Among the patients, gait speed estimated from the locomotor activity time was moderately correlated with the frequency-derived measures (r < 0.6), but among the controls, it was not.
Monitoring Participants at Home for 3 Consecutive Days
To demonstrate the potential applicability of the new measures and their ability to assess gait as participants walk in their daily living environment, we collected 3 consecutive days of data from 1 patient with PD (64 years old, male) and 1 healthy elderly control (77 years old, male). Participants carried out their routine daily activities in and outside the home while wearing a DynaPort Hybrid Monitor (McRoberts, The Hague) that consists of a 3D accelerometer and gyroscope located on the lower trunk in the same location as in the other trials. We identified 8.8 hours of locomotor activity from the PD patient and 16.2 hours from the control. Figure 3 shows the power spectra of these 2 participants in successive windows of 5 minutes each. Consistent with what was observed in the validation and ADL simulation experiments, the patient with PD had shorter and wider peaks (ie, the walking pattern was less consistent). This example suggests that the parameters extracted from the ADL simulation can be applied and likely have meaning in real-world, long-term recordings.
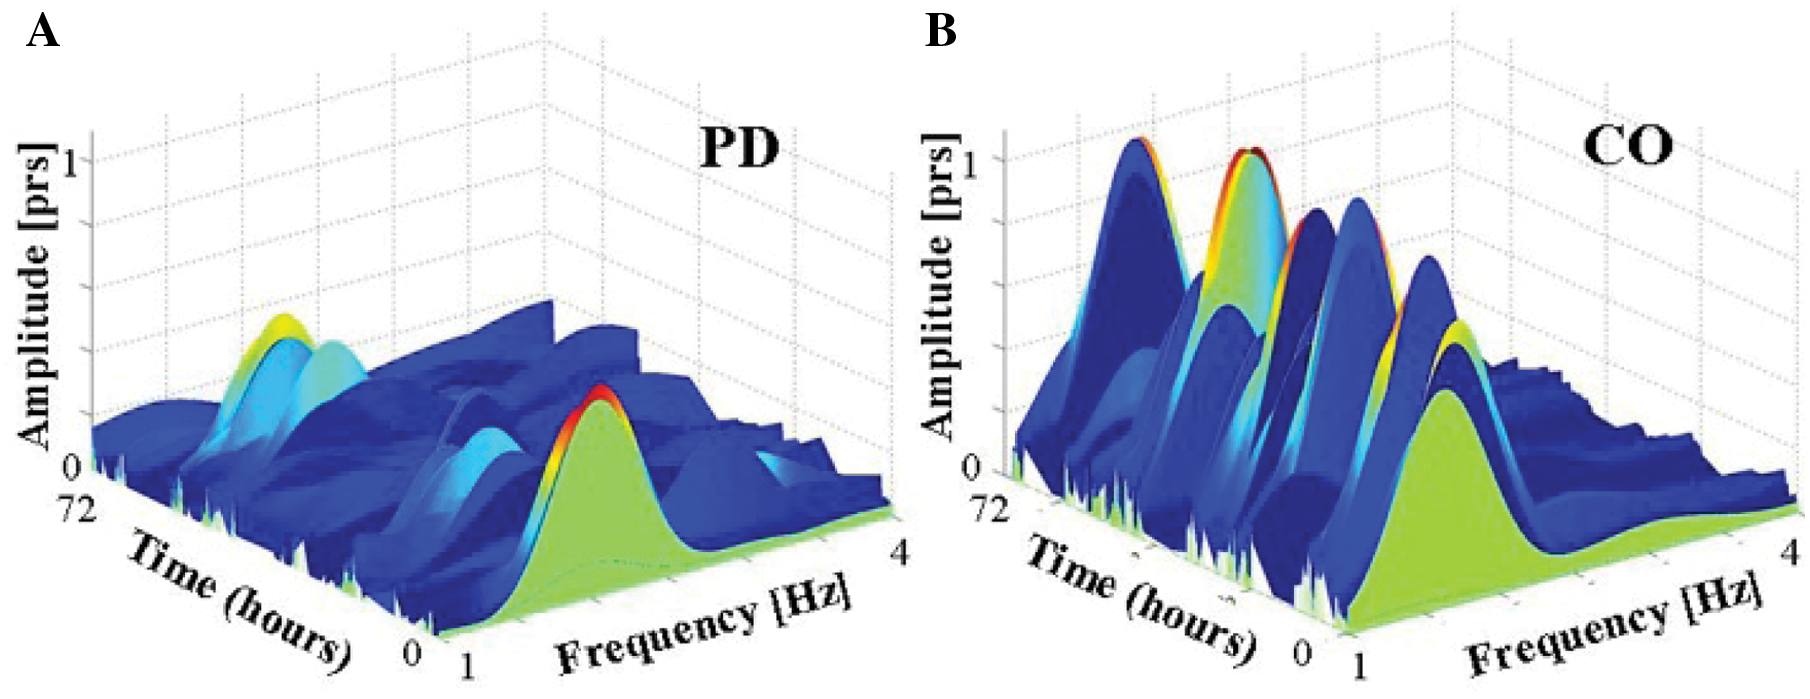
Comparison of a 3-dimensional plot of the amplitude in the frequency domain, covering the entire activity portion used for the analysis, in successive windows of 5 minutes each, in data collected over 3 days (72 hours) in (A) a patient with Parkinson disease (PD) and (B) a control (CO). The use of consecutive blocks in a longer trial (eg, 3 days) may enable researchers to examine relatively small-scale changes and variations in the data. In this figure, it can be seen that most of the successive peak amplitudes of the patient were lower than the peak amplitudes of the control, hence implying that the patient had a lower consistency and rhythmicity of the gait pattern compared with the control. Note that the peak amplitude value in the frequency domain was above 0.3 psd for 355 minutes in the control and only 165 minutes in the patient.
Discussion
The frequency-based measures behaved as hypothesized, both inside and outside the laboratory setting (ie, in the validation study and ADL simulation). These measures differed in patients and controls and improved when patients took their anti-Parkinsonian medications. Frequency-derived measures were also correlated specifically with severity of gait disturbances, as measured by the UPRDS. Similar findings were previously shown for temporal-based measures when participants were assessed in laboratory conditions.16,18,27,28 Indeed, in the laboratory testing, there were significant correlations between the temporal, conventional, and frequency-based measures. These findings all support the idea that frequency-derived parameters are valid and sensitive measures that can be used to assess walking performance among patients with PD in real-life settings.
From a theoretical perspective, if the data are stationary and “well behaved,” the dominant frequency will simply reflect the average step time—that is, ~50% of the gait cycle duration. Indeed, lower dominant frequency reflects a higher average stride time, and these 2 measures were highly correlated (Table 2). Whereas average stride time was closely related to the dominant frequency, stride time variability was most closely associated with width. Again, from a theoretical perspective, the width represents the variability and consistency of the signal. Slope and amplitude behaved similarly and were highly correlated with each other, likely because slope is derived in part from the amplitude; therefore, one of them is essentially redundant. It is probably best to choose the amplitude because it is independent of width. Thus, 3 frequency-based measures are likely appropriate for future work: dominant frequency, width, and amplitude.
Gait variability has previously been shown to reflect substrates of the neural control of gait in PD and other populations. 29,21 It is affected by aging and pathology, including cognitive deficits and mobility impairment.27,30,31 Indeed, gait variability increases during the performance of attention-demanding, dual tasks in patients with PD.22,32 Gait variability is sensitive to subtle changes in patients with PD 17 and predicts cognitive decline and falls.14,33,34 Although in the future it may be helpful to also assess gait speed and spatial measures like stride length in the home setting, in practice, it has only recently been possible to obtain accurate measures of velocity from the accelerometer signal or other body-worn sensors. 35
Those with PD generally walk more slowly than healthy elderly people. One might argue, therefore, that the group differences in the frequency domain merely reflect group differences in gait speed. However, the frequency-derived measures are directly related to gait variability and the rhythmicity and consistency of the gait pattern. Thus, one would expect that the new frequency measures are related to velocity in the same manner that the traditional stride-to-stride time variability measures are related to velocity. Indeed, in the present study, gait speed explained less than 40% of the variance in the frequency-based measures among the patients and was not associated with these measures among the controls. These findings are consistent with previous work 27 suggesting that walking speed and gait variability are independent.
We analyzed a 5-minute block of data. Measures were different between the groups and reflect the quality of gait outside the clinic, in a relatively complex, natural walking environment. We also suggest that this duration appropriately reflects the entire ADL simulation period and can save important data analysis time and calculation resources. Nonetheless, both 30-second and 5-minute block sizes may be appropriate. Future investigations are needed to evaluate the trade-offs of using different window (or block) sizes when quantifying long-term, real-life activity patterns. The use of consecutive blocks in a longer trial (eg, 3 days) may enable researchers to examine relatively small-scale changes and variations in the data over time, as shown in Figure 3.
In this regard, it may be helpful to recall that gait disturbances in PD have often been divided into 2 types: those that are continuous and common to every step (eg, short stride length, reduced arm swing, and increased stride-to-stride variability) and those that occur on an episodic basis (eg, festination and freezing of gait). 36,40 Ultimately, we envision a system that is capable of monitoring all these features. We suggest that the work described herein is an important step in the right direction, demonstrating the potential utility of this approach.
The idea of using accelerometers to monitor activity in the real-life setting has been proposed in the context of other diseases.35,37 This approach competes with pedometer-based systems that provide informative activity counts but do not give specific information about walking quality. An alternative, parallel effort uses sensors embedded in the home to monitor the activity status of patients.38,39 Home-based monitoring has many advantages and provides robust and intriguing data sets; however, a key limitation is that activity outside the home can only be inferred.
The location of the monitor (belt worn) was chosen because it reflects the center of mass and does not interfere with the participant’s everyday activity. The method presented could, theoretically, be adapted to monitors worn on other locations, such as an ankle-worn monitor. 35,40 The results of the present study advance the possibility of using an accelerometer to monitor real-world mobility. Additional work is needed to fully compare and contrast the benefits of different locations. For the purpose of concurrent validation, it may also be helpful to apply these measures to data derived from footswitches or using other measurement techniques.
In summary, the results of the present study suggest that among patients with PD, frequency-based measures may serve as an objective marker of gait variability in real-world settings. These new measures have the advantage that they are easy to calculate and may be less prone to artifacts compared with temporal measures, when the traditional temporal- based measures are difficult to extract.
Footnotes
Acknowledgements
The authors wish to thank Marina Brozgol, Noit Inbar, and Inbal Maidan for clinical supervision and data collection; Mr Leor Greundlinger for his contribution to the acceleration time domain analysis; and Dr Anat Mirelman for statistical input.
The author(s) declared no potential conflicts of interest with respect to the research, authorship, and/or publication of this article.
The author(s) disclosed receipt of the following financial support for the research, authorship, and/or publication of this article: This work was supported in part by the European Commission in the context of FP6 projects
References
Supplementary Material
Please find the following supplemental material available below.
For Open Access articles published under a Creative Commons License, all supplemental material carries the same license as the article it is associated with.
For non-Open Access articles published, all supplemental material carries a non-exclusive license, and permission requests for re-use of supplemental material or any part of supplemental material shall be sent directly to the copyright owner as specified in the copyright notice associated with the article.