
Abstract
Background. It is suggested that transcranial direct current stimulation (tDCS) can produce lasting changes in corticospinal excitability and can potentially be used for the treatment of neuropathic pain. However, the detailed mechanisms underlying the effects of tDCS are unknown. Objective. We investigated the underlying neural mechanisms of tDCS for chronic pain relief using [18F]-fluorodeoxyglucose positron emission tomography ([18F]FDG-PET). Methods. Sixteen patients with neuropathic pain (mean age 44.1 ± 8.6 years, 4 females) due to traumatic spinal cord injury received sham or active anodal stimulation of the motor cortex using tDCS for 10 days (20 minutes, 2 mA, twice a day). The effect of tDCS on regional cerebral glucose metabolism was evaluated by [18F]FDG-PET before and after tDCS sessions. Results. There was a significant decrease in the numeric rating scale scores for pain, from 7.6 ± 0.5 at baseline to 5.9 ± 1.8 after active tDCS (P = .016). We found increased metabolism in the medulla and decreased metabolism in the left dorsolateral prefrontal cortex after active tDCS treatment compared with the changes induced by sham tDCS. Additionally, an increase in metabolism after active tDCS was observed in the subgenual anterior cingulate cortex and insula. Conclusion. The results of this study suggest that anodal stimulation of the motor cortex using tDCS can modulate emotional and cognitive components of pain and normalize excessive attention to pain and pain-related information.
Introduction
Neuropathic pain is considered to be a major problem after spinal cord injury (SCI) because it has a prevalence of almost 50% and impairs the quality of daily life to a greater extent than the motor impairment.1,2 Despite the availability of multiple pharmacological, neurosurgical, and behavioral therapeutic treatment strategies, it is not uncommon for patients with neuropathic pain following SCI to fail to experience sufficient relief. 3 Recently, noninvasive brain stimulation, such as repetitive transcranial magnetic stimulation (rTMS) and transcranial direct current stimulation (tDCS), have been suggested as promising therapies for patients with refractory pain. tDCS applies weak direct currents via scalp electrodes to modulate the level of cortical excitability. 4 The modulatory effects of tDCS are reversible, painless, and safe. Moreover, tDCS is less expensive, and easier to administer than rTMS.5,6 Anodal tDCS of the motor cortex has been reported to increase the pain threshold and to provide relief from neuropathic pain.7-9 Fregni et al 8 applied tDCS for 5 days over the primary motor cortex (M1) of patients with neuropathic pain after SCI, and found significant pain improvement after active anodal stimulation compared with sham stimulation. They found not only that the effects of consecutive sessions were cumulative but also that the effects of tDCS lasted for at least 24 hours. Neuropathic pain in patients with multiple sclerosis was also relieved during 5 days of anodal stimulation, and the pain reduction persisted for 3 weeks after completion of the tDCS sessions. 9 These evidences suggest that repeated sessions of anodal tDCS over the M1 may be useful for pain relief and may have a long-lasting effect.
In spite of the encouraging results of tDCS, detailed mechanisms accounting for its analgesic effect have not yet been elucidated. Therefore, we investigated the neural mechanisms underlying the effects of tDCS using [18F]-fluorodeoxyglucose positron emission tomography ([18F]FDG-PET). [18F]FDG-PET at rest measures the distribution of glucose uptake, which reflects integrated synaptic activity. 10 We conducted [18F]FDG-PET imaging before, and 10 days after, active or sham motor cortex stimulation using anodal tDCS. This method enabled us to assess which components of the pain network could contribute to pain relief by tDCS.
Methods
Subjects
Sixteen patients with chronic neuropathic pain due to traumatic SCI were recruited for this study. The inclusion criteria were as follows: (a) more than 6 months since SCI, (b) stable chronic pain for at least the 3 preceding months, (c) pain that was not attributable to causes other than neuropathic pain (eg, musculoskeletal pain or pain from diabetic polyneuropathy), and (d) pain that was resistant to medications, or physical or complementary medical treatment. Patients with any kind of metal implant in the head, heart disease, a cardiac pacemaker, or a family or personal history of epilepsy or neuropsychiatric illness were excluded. The characteristics of SCI-related pain were assessed according to the international spinal cord injury data set, 11 and the extent of injury was defined by the American Spinal Injury Association (ASIA) impairment scale. 12
Because depression is a common comorbidity in patients with chronic neuropathic pain, 13 the Beck Depression Inventory (BDI) was completed for all patients. All patients were being treated with various medications including anticonvulsants, nonsteroidal anti-inflammatory drugs, and antidepressants. They were instructed not to change the dosage throughout the experimental period. The study protocol and consent forms were reviewed and approved by the Institutional Review Board of the Seoul National University Bundang Hospital, Korea (IRB No E-0804/027-001) and registered on www.clinicaltrials.gov (ID NCT01781065). Written informed consent was obtained from all participants after a detailed explanation of the procedure.
Transcranial Direct Current Stimulation
Direct current was delivered by a battery-driven, constant-current stimulator (Phoresor II Auto Model No. PM850, IOMED, Salt Lake City, UT) via a pair of rubber pads with sponge-insert electrodes. The anode was placed over the left M1 (C3, EEG 10/20 system) and the cathode over the contralateral supraorbital area. This electrode position has been shown to be effective in enhancing the excitability of the M1. 14 For patients with symmetric pain, the stimulation was applied over the dominant hemisphere.8,15 In our study, all of the patients had symmetric pain and were right-handed, so we stimulated C3. A constant 2-mA current was applied for 20 minutes. Each patient received 20 treatments over a 2-week period. Treatments were given twice daily, with an interval of more than 4 hours, from Monday to Friday. For sham stimulation, the electrodes were placed in the same positions as for anodal M1 stimulation, but the stimulator was turned off after 10 seconds. Therefore, the patients felt an initial itching sensation, but received no current for the remaining stimulation period.8,16
Outcome Measures
The numeric rating scale (NRS) score for average pain during the preceding 24 hours was defined as the primary outcome measure. Patients were asked to rate their pain, indicating the number that best described their pain from 0 (no pain) to 10 (the most intense pain sensation imaginable). 17 As a secondary outcome measure, we assessed the patient global impression of change (PGIC) and pain interference. The PGIC is a single-item rating by participants of their improvement after treatment on a 7-point scale that ranges from “very much improved” to “very much worse” with “no change” as the midpoint. 18 Each participant was asked to rate how their pain interfered with general daily life, mood, or sleep over the previous week using a 7-point NRS ranging from 0 (no interference) to 6 (complete interference). The NRS for pain intensity and for pain interference was assessed before treatment and the day after treatment, and the PGIC was evaluated on the day after treatment. All evaluations were performed by a rater who was blinded to the study procedures.
Image Acquisition
[18F]FDG-PET was conducted twice, on the day before the beginning of the tDCS sessions and the day after the end of treatment. Structural magnetic resonance imaging was used to scan for brain abnormalities and for anatomical information. [18F]FDG-PET images were acquired using an Allegro PET scanner (Phillips Medical System, Cleveland, OH) operating in 3-dimensional (3D) mode. All subjects had fasted for at least 6 hours before scanning. They received an intravenous injection of 4.8 MBq/kg of FDG in a quiet, dimly lit waiting room and were instructed to remain lying comfortably during an FDG equilibration period of 40 minutes. Ten-minute emission scans and attenuation maps using a Cs137 transmission source were obtained. Attenuation-corrected images were reconstructed using the 3D Row-Action Maximum-Likelihood algorithm with a 3D image filter of 128 × 128 × 90 matrices with a pixel size of 2 × 2 × 2 mm.
Data Processing
Original FDG-PET images were corrected for a partial volume effect (PVE) based on a modified version of the Müller–Gärtner approach that was fully implemented in the PVElab software package (http://nru.dk/pveout). 19 PVE-corrected FDG-PET images were processed and analyzed using SPM5 (Statistical Parametric Mapping, Wellcome Department of Cognitive Neurology, London, UK) running on Matlab 7.6 (Mathworks, Natick, MA). Individual FDG-PET images were coregistered to structural MR images, and then MR images were normalized to a T1-weighted magnetic resonance imaging template developed and distributed by the Montreal Neurological Institute. By using these parameters, FDG-PET images were normalized and reformatted with a voxel size of 2 × 2 × 2 mm. The normalized PET images were then smoothed with a 12-mm full-width at half-maximum isotropic Gaussian kernel.
Statistical Analysis
Baseline homogeneity of groups was compared by independent t test for continuous variables and Fisher’s exact test for categorical variables. The effect of tDCS on changes in NRS scores for pain and pain interference was analyzed using the Wilcoxon signed-rank test for each group. A flexible factorial model in SPM5 with group (real and sham) and treatment (pre- and posttreatment factors was used for the analysis comparing the effect of treatment on brain glucose metabolism. To identify significant between-group differences in the effect of treatment, paired t tests were performed for each group separately. Additionally, to detect correlation between brain metabolic changes in the active tDCS group and tDCS efficacy, voxel-by-voxel multiple regression analysis was performed using tDCS efficacy for the difference maps (subtraction from post- to pre-tDCS images). The tDCS efficacy was calculated with the following equation: [(pre-tDCS − post-tDCS pain score)/pre-tDCS pain score × 100]. Brain glucose metabolism at each voxel was proportionally scaled to the mean FDG uptake value of the whole brain. The level of statistical significance for all brain imaging analyses was P < .005 without correction. We used a liberal significance threshold to avoid type II errors because the relatively low number of subjects in this study leads to fairly conservative testing. No regions survived corrections for multiple comparisons.
To evaluate the effect of depressive symptoms on changes in pain in the active tDCS group, we performed a correlation analysis between BDI scores at baseline and tDCS efficacy, and a voxel-by-voxel multiple regression analysis using BDI scores at baseline for difference maps of brain glucose metabolism.
Results
Patient Characteristics
Patient characteristics are shown in Table 1. There were no significant differences in clinical and demographic characteristics between the active and sham tDCS groups. All participants had symptoms of neuropathic pain (eg, pricking, tingling, hot burning, stabbing, shooting) at multiple sites below the level of the SCI. Patients with chronic pain above or at the lesion level were excluded. As defined by BDI, 9 patients showed mild depressive symptoms (BDI = 10-18) and 4 patients showed moderate to severe depressive symptoms (BDI > 19).
Characteristics of Patients With Chronic Neuropathic Pain After Spinal Cord Injury.
Abbreviations: tDCS, transcranial direct current stimulation; ASIA, American Spinal Injury Association scale (A = complete, no sensory or motor function in sacral segments S4-S5; B = incomplete, sensory but not motor function preservation below the neurologic level and extends through sacral segments S4-S5); M, male; F, female; BDI, Beck Depression Inventory; NRS, numeric rating scale.
Changes in Pain Intensity After tDCS
The Wilcoxon signed-rank test for each group found a significant decrease in NRS for pain in the active tDCS group (z = −2.410, P = .016), but not in the sham tDCS group (P = .102). In the active group, pain intensity was reduced from 7.6 ± 0.5 at baseline to 5.9 ± 1.8 after the tDCS sessions, an average decrease of 22.9%. Seven patients showed various degrees of pain reduction according to NRS data (range, 1-4 or 12.5% to 62.5%); the NRS scores for the other 3 patients did not change. It is suggested that only patients with reductions in pain intensity of at least 30% from baseline, or more strictly 50%, obtained a clinically meaningful reduction in chronic pain.18,20 Therefore, in the present study, there were only 2 responders, or just 1 responder according to the strict criterion.
Patient Global Impression of Change in Pain After tDCS
There was no significant difference between the active and sham groups in PGIC scores. The average PGIC score in the active tDCS group was 3.7 ± 1.4, which means that patients generally rated the pain-relieving effect of the treatment as “no change.” Two patients, who were tDCS responders by the 30% criterion, rated pain as markedly improved (“much improved” or “very much improved”). The other 5 patients reported “no change” in their pain, and 1 patient rated pain as “minimally improved.” On the other hand, 2 patients rated their pain as worse than before (“minimally worse” and “much worse”). The average PGIC score in the sham tDCS group was 4.3 ± 0.8. In the sham group, 5 patients reported “no change” in their pain and the sixth rated pain as much worse than before.
Changes in Pain Interference With Activities of Daily Life After tDCS
In the active tDCS group, patients rated pain interference with general daily life as somewhat alleviated after tDCS treatment (4.6 ± 0.8 at baseline; 3.7 ± 0.8 the day after tDCS; z = −2.251, P = .024). However, there were no effects of tDCS on pain interference with mood (3.8 ± 1.4; 3.2 ± 1.3; P = .380) or sleep (3.7 ± 1.3; 2.8 ± 1.1; P = .135). In the sham tDCS group, there were no effects of tDCS on pain interference with daily life (2.8 ± 2.5; 3.5 ± 2.1; P = .461), mood (3.8 ± 2.3; 3.7 ± 1.4; P = .785), or sleep (2.5 ± 2.8; 1.2 ± 2.4; P = .285).
Changes of Regional Metabolism in Response to tDCS
A flexible factorial model identified bidirectional metabolic changes from pre- to posttreatment in the active tDCS group compared with the sham tDCS group (Figure 1A, Table 2). Significantly increased metabolism after active tDCS compared with sham tDCS was found in the left postcentral gyrus around the stimulation site, the right caudate, and the medulla. Significantly decreased glucose metabolism after active tDCS compared with sham tDCS was found in the left angular gyrus, the posterior cingulate cortex (PCC), and the orbital and dorsolateral portions of the left middle and superior frontal gyrus. To interpret the interaction findings, we examined the effect of treatment for the groups separately. In agreement with the interaction results, significantly increased metabolism was observed in the left postcentral gyrus, right caudate, and medulla, and decreased metabolism in the left dorsolateral prefrontal cortex (DLPFC) and PCC after active tDCS (Figure 1B, Table 3). For the sham tDCS group, the increased metabolism in the left orbital part of the middle frontal gyrus and the angular gyrus agreed with interaction results (Figure 1C). The changes seen in the PCC and angular gyrus in a separate group analysis were found at a less stringent statistical threshold (P = .01; data not shown).
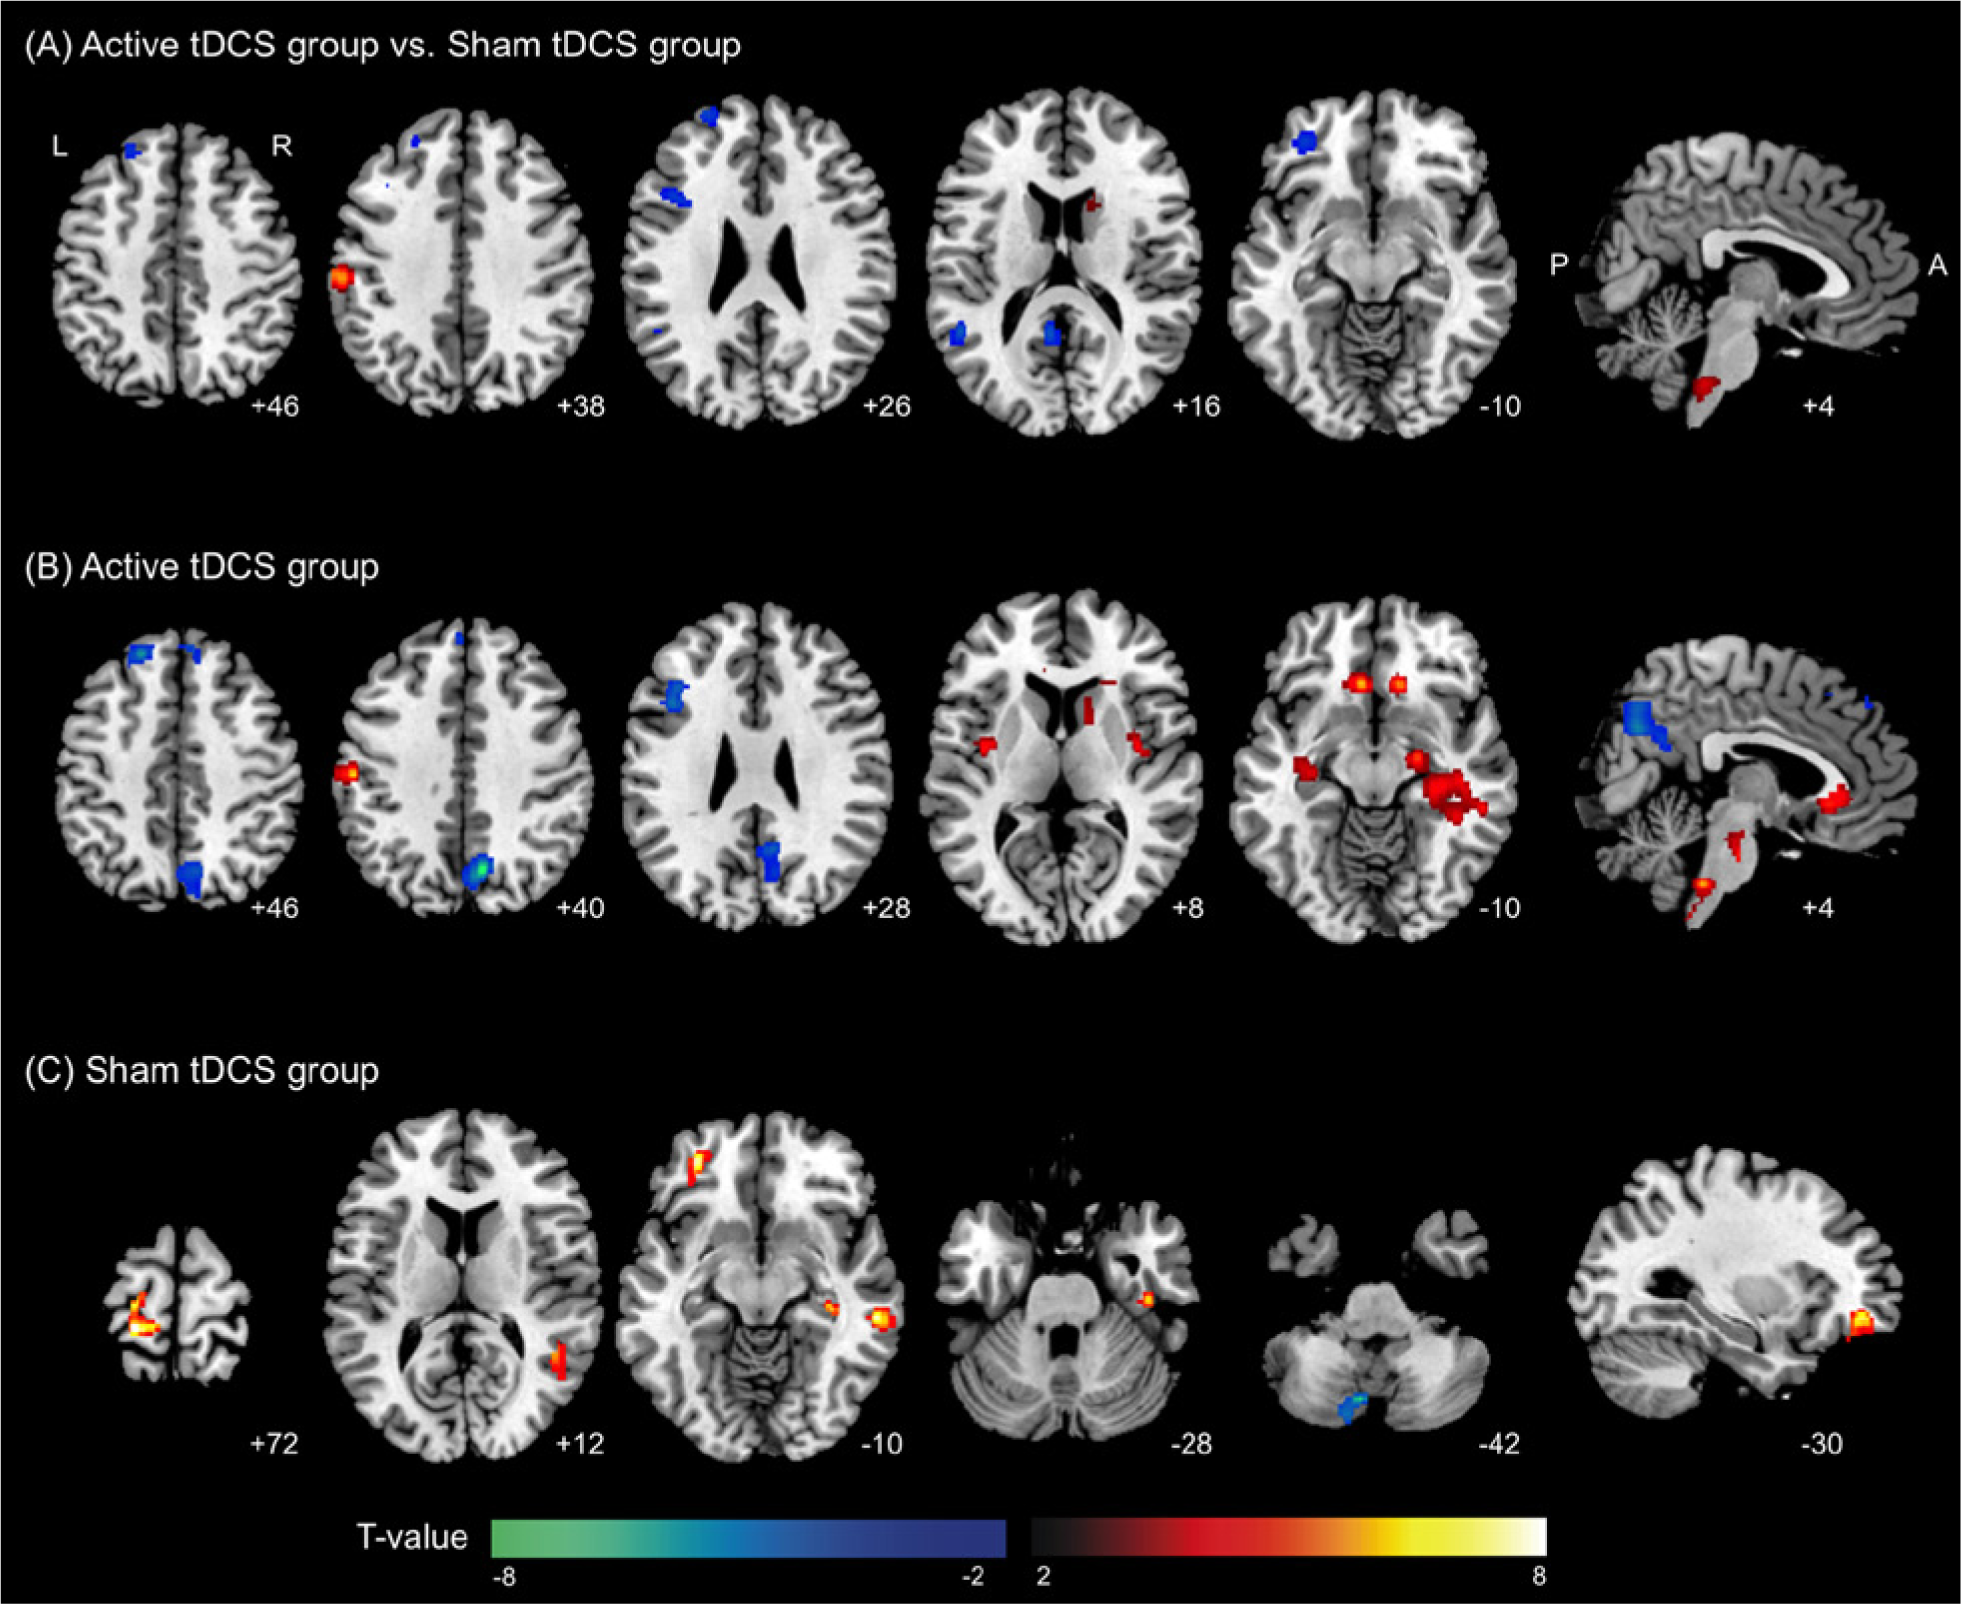
(A) Brain regions showing significant metabolic changes from pre- to posttreatment in the active transcranial direct current stimulation (tDCS) group compared with the sham tDCS group. To identify the group whose data accounted for the significant differences in treatment effect, brain metabolic changes were analyzed in each group separately. (B) Significant metabolic changes after active tDCS. (C) Significant metabolic changes after sham tDCS. Significant clusters are overlaid onto an MNI-152 brain template image. The warm color scale indicates increased metabolism and the cool color scale indicates decreased metabolism. The labels of each slice indicate the z-coordinate for axial slices and the x-coordinate for the sagittal slice.
Brain Regions Showing Significant Changes in Metabolism After Active tDCS in Patients With Neuropathic Pain After Spinal Cord Injury Compared With the Sham tDCS Group.
Abbreviations: tDCS, transcranial direct current stimulation; BA, Brodmann area; MNI, Montreal Neurological Institute.
Brain Regions Showing Significant Changes in Metabolism After Active tDCS in Patients With Neuropathic Pain After Spinal Cord Injury.
Abbreviations: tDCS, transcranial direct current stimulation; BA, Brodmann area; MNI, Montreal Neurological Institute.
Metabolic changes induced by active tDCS were found in additional brain regions. We found increased metabolism in the bilateral hippocampal and parahippocampal areas and the adjacent fusiform gyrus, subgenual anterior cingulate cortex (sACC), insulae, left putamen, and brainstem, and decreased metabolism in the right precuneus, and the bilateral superior frontal gyri that corresponds to medial prefrontal cortex after active tDCS (Figure 1B, Table 3). In the sham tDCS group, there was increased metabolism in the left pre-and postcentral gyrus, right middle and superior temporal gyrus, and right parahippocampal gyrus, and decreased metabolism in the cerebellum (Figure 1C).
Correlation Between Brain Metabolic Changes and tDCS Efficacy
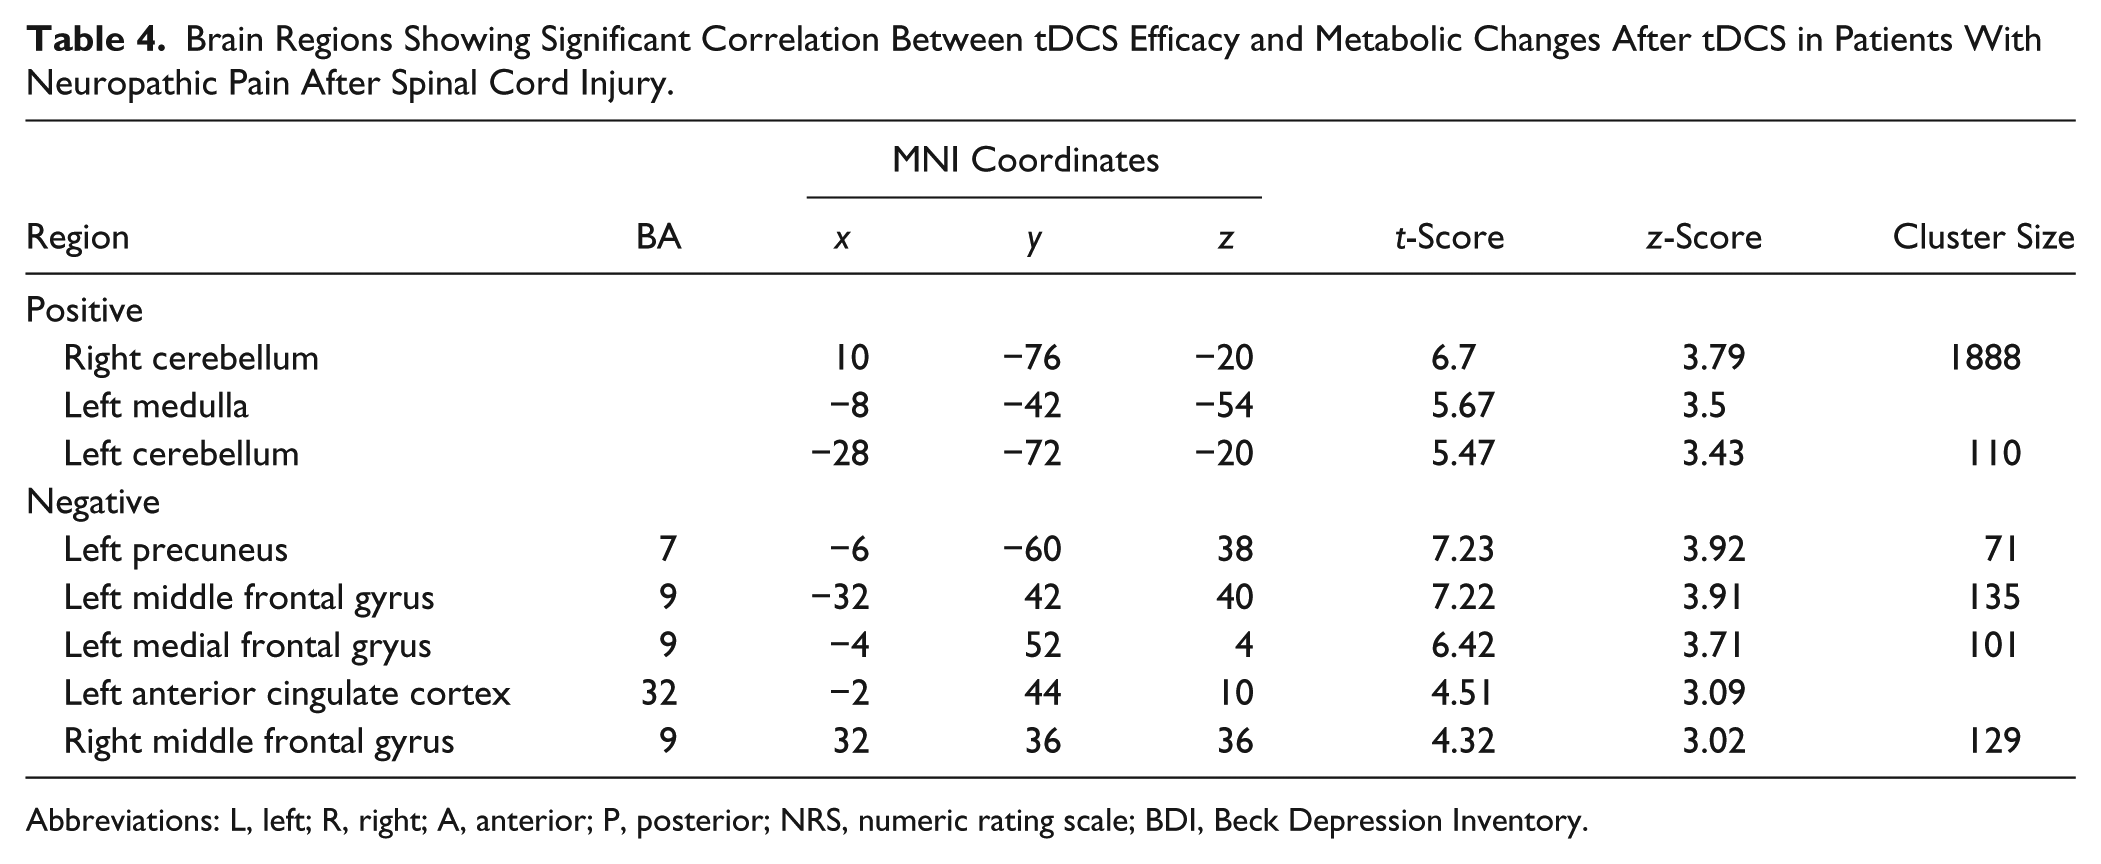
We assessed the correlation between brain metabolic changes and tDCS efficacy in the active tDCS group and found that tDCS efficacy was positively correlated with metabolic changes in the bilateral cerebellum and left medulla. tDCS efficacy in the active tDCS group was negatively correlated with metabolic changes in the left precuneus and perigenual ACC (pACC), along with the adjacent medial frontal gyrus and the bilateral middle frontal gyri, equivalent to the DLPFC (Figure 2A, Table 4).
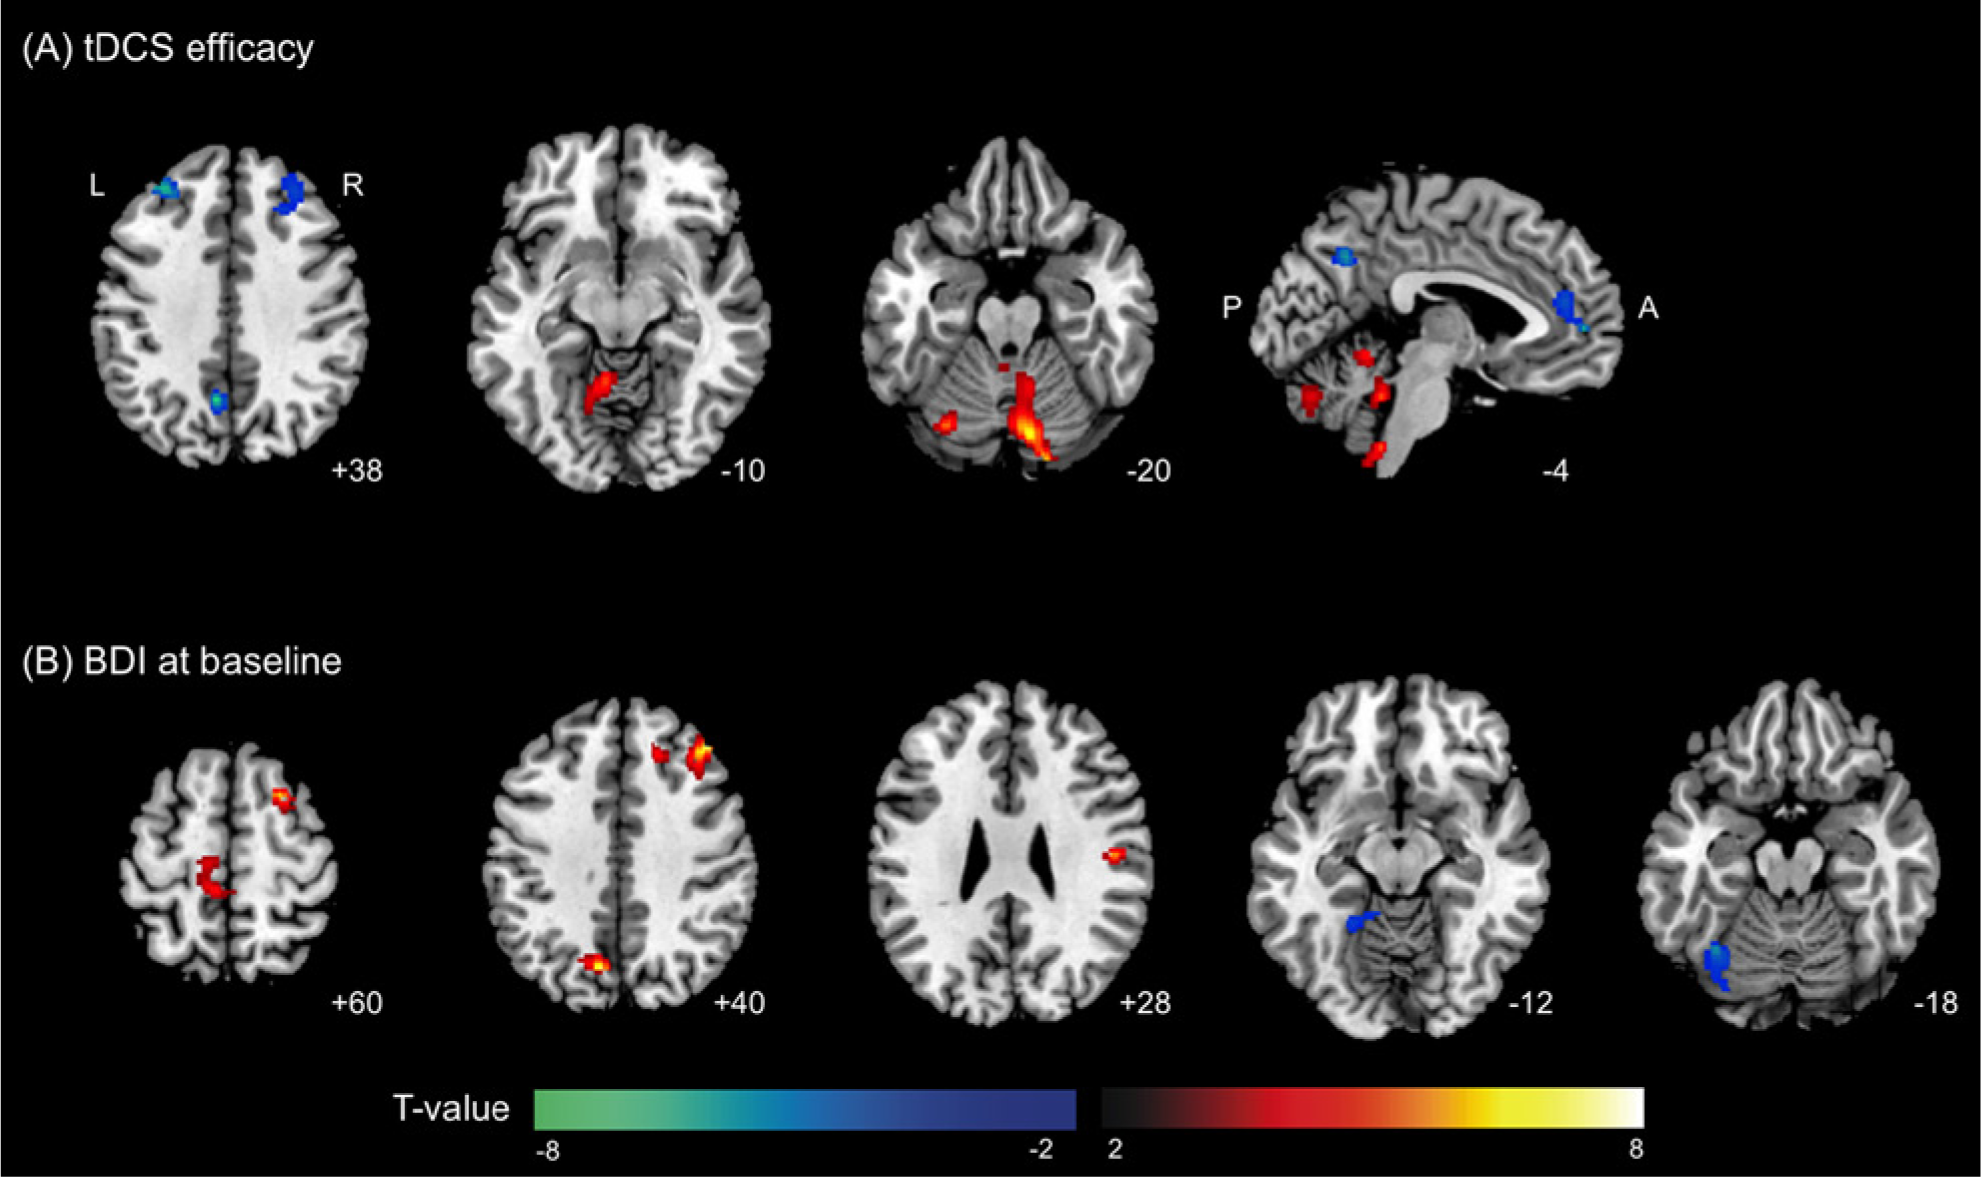
Brain regions with observed metabolic changes after transcranial direct current stimulation (tDCS) correlated with (A) tDCS efficacy and (B) BDI scores at baseline. Significant clusters are overlaid onto an MNI-152 brain template image. The warm color scale indicates a positive correlation and the cool color scale indicates a negative correlation. The labels of each slice indicate the z-coordinate for axial slices and the x-coordinate for the sagittal slice.
Brain Regions Showing Significant Correlation Between tDCS Efficacy and Metabolic Changes After tDCS in Patients With Neuropathic Pain After Spinal Cord Injury.
Abbreviations: L, left; R, right; A, anterior; P, posterior; NRS, numeric rating scale; BDI, Beck Depression Inventory.
Effect of Baseline BDI Scores on tDCS Efficacy and Brain Metabolic Changes
There was no significant correlation between BDI score at baseline and tDCS efficacy in the active tDCS group (P = .181). However, we found positive metabolic correlations in the left precuneus, right dorsolateral portion of the middle frontal gyrus, and bilateral motor and sensory areas with the BDI baseline score (Figure 2B). The bilateral motor and sensory areas included the right premotor (superior frontal gyrus), primary somatosensory area (postcentral gyrus), and left primary and supplementary motor areas (paracentral lobule, medial frontal and precentral gyri). Brain regions showing negative correlations with BDI scores were the left fusiform and lingual gyrus and the adjacent cerebellum.
Discussion
Transcranial Diresct Current Stimulation Effect on Brain Regional Metabolism: Possible Mechanisms of tDCS-Induced Pain Relief
To our knowledge, this is the first [18F]FDG-PET imaging study to evaluate the underlying neural mechanisms of tDCS effect on neuropathic pain following SCI. After active tDCS treatment, we found increased metabolism at sites of anodal stimulation, the right caudate and medulla. The medulla also showed positive correlation with pain relief on the left side. The left DLPFC showed decreased metabolism after active tDCS, which was negatively correlated with pain relief. The DLPFC and brainstem are the key regions of the top-down pain modulatory system.21,22 In a study of experimentally induced allodynia, brain activation in the DLPFC showed a negative correlation with unpleasantness and perceived pain intensity, supposedly by inhibiting the neuronal coupling in the midbrain–thalamus. 23 A recent rTMS study found that left DLPFC stimulation was associated with reduced pain ratings during allodynia and signal changes in the medulla. 22 In addition, it is well described that the prefrontal area is generally related to cognitive and attentional processing of painful stimuli.24,25 Previous PET studies of neuropathic pain in patients receiving motor cortex stimulation (MCS) also identified changes in these brain regions. Kishima et al 26 found decreased activity in the DLPFC during the early postphase (20 minutes after MCS) and suggested that the reduced activity in the DLPFC might reflect attenuation of attention to and perception of neuropathic pain. Garcia-Larrea et al27,28 identified activations in the brainstem during MCS as a part of descending inhibitory processes. Hypervigilance in relation to pain and pain-related information is a main clinical feature seen in many patients with chronic pain. 21 From these results, we suggest that the analgesic effects of tDCS are associated with attentional modulation of pain perception through the DLPFC and medulla.
Additional Brain Metabolic Changes Associated With Active tDCS
We found increased metabolism in the sACC and insula after active tDCS. Human functional neuroimaging studies have indicated that the ACC might mediate an affective response to noxious stimuli.29,30 In particular, sACC may be activated during the negative event and be involved in storage of the negative memory.31,32 The anterior insula is also suggested to be involved in emotional processes such as identification of the emotional significance of stimuli, and production of an affective state and related behavior.33,34 We also found increased metabolism in the posterior insula. The posterior insula is well described as reflecting pain perception and is activated by noxious stimuli. 35 Involvement of these brain regions has consistently been reported in previous neuroimaging studies of the neural mechanisms of MCS.26-28,36,37 The precuneus, a core region of the default mode network (DMN), showed decreased metabolism after active tDCS, and these hypometabolic regions also showed a negative correlation with pain relief. Recently, it was suggested that changes occur in the resting DMN in patients with chronic pain. In patients with chronic back pain, the precuneus showed reduction in deactivation during a simple visual attention task compared with controls. 38 Cauda et al 39 found that the DMNs of patients suffering from diabetic pain displayed increased precuneus connectivity compared with those of the healthy controls.
These findings suggest that tDCS might contribute to pain relief by controlling the emotional components of pain and normalizing DMN function. However, these additional brain metabolic changes were not significantly different compared with changes observed in the sham tDCS group. Therefore, the placebo effect cannot be ruled out as a cause of these metabolic changes in this study.
Effect of BDI on tDCS Efficacy and Metabolic Changes
We found a positive correlation between BDI scores at baseline and metabolic changes in the left precuneus and right DLPFC after active tDCS. This positive correlation means that subjects with less depressive symptom before treatment showed reduced brain metabolism in those brain regions after tDCS. Therefore, we cannot rule out the possibility that the changes in the left precuneus and right DLPFC might be associated with depressive symptoms. However, we did not find a significant correlation between tDCS efficacy and BDI scores at baseline, and the BDI scores were not correlated with the brain regions associated with possible mechanisms of tDCS-induced pain relief such as the left DLPFC, medulla, sACC, and insula. These findings suggest that the pain relief and brain metabolic changes following tDCS were not confounded by depression.
Effect of tDCS on Pain Relief
In the present study, patients with neuropathic pain following SCI showed a statistically significant decrease in pain ratings after the active tDCS treatment. However, clinically meaningful improvement was found in only 2 patients (20%) with reductions in pain intensity from baseline of more than 30% and who rated pain as markedly improved (“much improved” or “very much improved”). The intervention in our study was thus less effective than that in the study by Fregni et al, 8 who found a reduction of 50% or more in the visual analogue scale (VAS) for overall pain in 63% of patients with neuropathic pain following SCI. The reason behind this inconsistency does not appear to be related to the tDCS methodology, because we used essentially the same study protocol as described by Fregni et al. 8 Two more recent tDCS studies, also using essentially the same protocol, failed to find any statistically significant reduction in overall pain intensity in patients with neuropathic pain following SCI.40,41 Wrigley et al 41 suggested that the reason for lack of tDCS efficacy was the long injury duration of their patients (21.3 ± 13.8 years). They mentioned the possibility that central changes resulting from neuropathic SCI pain had become consolidated, so that tDCS could not modulate the central pain-related system. In the present study, however, the injury duration was 2.5 years on average, and was thus shorter than that of the participants in the study by Fregni et al. 8 Therefore, we suggest that injury duration was not very likely to contribute to the lack of tDCS efficacy in this study. Soler et al, 40 on the other hand, suggested that the analgesic effect of tDCS differed according to the subtype of spontaneous pain. In that study, paroxysmal pain was more reduced than continuous pain, and the pain relief lasted for 12 weeks after treatment. Fregni et al 8 also found that tDCS was more effective for paroxysmal pain than for continuous pain. One of the reasons for the apparently reduced effect of tDCS observed in the present study might be that we considered only overall pain, not the specific type of pain (eg, paroxysmal or continuous). Recent studies demonstrated that tDCS combined with visual illusion reduced pain in SCI patients. The combined intervention led to a greater and more sustained analgesic effect than either intervention alone, 41 and pain perception thresholds were increased in patients, who reported reduced ongoing pain after the combined intervention. 42 The visual illusion can affect corticospinal excitability, and so it may have a synergistic effect with tDCS. These observations suggest that tDCS combined with other therapeutic approaches may, at least in part, overcome the limitations of indirect stimulation.
Limitations and Suggestions for Further Studies
This sham-controlled tDCS study was not randomized. Subjects were assigned to the active or sham group according to years of enrollment. Although there were no significant group differences in demographic and clinical characteristic between the active and sham groups, an imbalance of confounding factors might have affected the results. Randomized studies powered for an outcome relevant to disabling pain are needed. Furthermore, brain imaging studies combining tDCS with sensory stimulation such as pain provocation could provide additional information on the mechanisms of the analgesic effect induced by tDCS.43,44
Conclusions
We found increased metabolism in the medulla and decreased metabolism in the left DLPFC after active tDCS compared with sham tDCS. The left DLPFC change was negatively correlated with pain relief. These results suggest that the analgesic effects of tDCS are associated with attentional modulation of pain perception through the DLPFC and medulla. In addition, the increase in metabolism after active tDCS in the sACC and insula suggests that tDCS modulates emotional components of the pain system. Our findings suggest that, similar to invasive MCS, noninvasive tDCS has a potential role in alleviating neuropathic pain.
Footnotes
Declaration of Conflicting Interests
The author(s) declared no potential conflicts of interest with respect to the research, authorship, and/or publication of this article.
Funding
The author(s) disclosed receipt of the following financial support for the research, authorship, and/or publication of this article: This work was supported by the National Research Foundation of Korea (NRF) grant funded by the Korea government (MSIP) (No. 2011-0030815), and Grant 11-2008-010 from SNUBH Research Fund.