
Abstract
Background. Kinematic assessment of upper limb motor recovery after stroke may be related to clinical scores while being more sensitive and reliable than clinical evaluation alone. Objective. To identify the potential of kinematics in assessing upper limb recovery early poststroke. Methods. Thirteen patients were included within 1 month poststroke and evaluated once a week for 6 weeks and at 3 months with (a) the Fugl-Meyer Assessment (FMA) and (b) kinematic analysis of reach-to-grasp movements. The link between clinical and kinematic data was identified using mixed model with random coefficient analysis. Results. Movement time, trajectory length, directness, smoothness, mean and maximum velocity of the hand were sensitive to change over time and distinguished between movements of paretic, nonparetic, and healthy control limbs. The FMA score increased with movement smoothness over time, explaining 62.5% of FMA variability. Conclusion. Kinematic analysis of reach-to-grasp movements is relevant to assess upper limb recovery early poststroke, and is linked to the FMA. Kinematics could provide more accurate real-time indicators of patients’ recovery as compared with the sole use of clinical scores, although it remains challenging to establish the universality of the reaching model in relation to motor recovery after stroke.
Introduction
Restoring upper limb function forms a major challenge in poststroke rehabilitation. Several international clinical studies have been conducted over the past decade addressing this topic. 1 It is clear, however, that the method selected to assess upper limb impairment plays a key role in the evaluation of rehabilitation 2 and, consequently, in the construction of theoretical frameworks on motor recovery. 3
In clinical settings, upper limb motor impairment is mainly evaluated by measures such as the upper extremity Fugl-Meyer Assessment (FMA), 4 the Action Research Arm Test, 5 or the more recent Upper Limb Assessment in Daily Living Scale. 6 These scales address various levels of motor evaluation, from deficiencies (flexion/extension of fingers) to capacities (grasping a glass) based on examiner’s observation. Often, outcome scores alone do not clarify whether the observed changes depend on recovery or compensation strategies 7 and they may be subject to observer bias. 8 In research, the FMA scale is regularly used to evaluate the effect of interventions on upper limb recovery. However, close to full recovery, the FMA scale lacks the sensitivity to detect small changes in motor performance.3,9 Small variations in motor performance may yet provide important information on recovery and therapy response after stroke. Therefore, it has repeatedly been recommended to construct and validate objective clinical and instrumental approaches to assess upper limb recovery poststroke. 9
Well-trained movements in healthy people are smooth in the kinematic and/or motor command domain. 10 In contrast, hemiparetic movements are marked by a concatenation of discrete (sub)movements because of the necessity of online corrections in the face of increased neuromotor noise. 11 When reaching for a target, deviations from the smooth and direct trajectory are clearly visible at the end-point. 12 Calculations based on this point are assumed to provide an idea of overall coordination in a noninvasive way. Therefore, kinematic analysis of the end-point movement may allow for an objective, quantitative and easily reproducible evaluation of sensorimotor impairments.1,13 A combination of several kinematic variables addressing changes in motor control might provide a complete image of recovery.
Surprisingly, the link between information on recovery provided by kinematics and by traditional clinical scales has been sparsely addressed. The lack of appropriate and consistent analysis parameters makes comparison of these few results difficult. For instance, Bosecker et al 14 found that 58% of the FMA score could be explained by the combination of smoothness, peak velocity, movement time, and joint coordination during reaching. However, these conclusions were based on a chronic stroke population, executing an unconstrained reaching movement in a robot with low compliance in vertical direction. Mirbagheri and Rymer 15 identified active range of motion and maximum voluntary contraction as predictors of motor recovery, yet this study only looked at kinematic properties of fast extension/flexion elbow movements in an early stroke population (within 4 weeks after stroke). Finally, Osu et al 10 found an inverse relationship between the instantaneous curvature of the movement trajectory and the Stroke Impairment Assessment Set score, evaluating “clumsiness” of arm movements, through evaluation of a functional grasp-to-lift task (grasping a cup and lifting it from the knees to the mouth) within a chronic stroke population. First, from a methodological point of view, kinematics are known to differ between reaching and grasping. 16 Then, using a robot to register overall movement trajectories 14 or a sensor focusing on the trajectory of a handheld object rather than the arm/hand itself 10 changes task dynamics and consequently alters kinematic outcomes. Thus, the comparability of these results remains difficult to interpret.
As motor capacities evolve most strongly over the first months poststroke, the current study addressed the link between clinical and kinematic assessment of motor performance during early poststroke recovery. A noninvasive reach-to-grasp task, closely related to everyday situations was selected. The relationship between clinical and kinematic outcomes was evaluated using a mixed model with random coefficient analysis. Its relevance was discussed in the light of daily clinical practice and underlying neurological deficits.
Methods
Participants
A total of 13 participants (>18 years) were included after a first supratentorial stroke (10 men, aged 63.9 ± 9.4 years). Six of them had left-sided hemiplegia. Details are presented in Table 1. Inclusion in the study coincided with the start of motor rehabilitation, which was around 3 weeks poststroke. Exclusion criteria were (a) the presence of a legal guardian, (b) severe cognitive disorders (Mini Mental Status Examination score <24), 17 (c) severe aphasia with impaired comprehension (Boston Disability Aphasia Quotient <4/5), 18 (d) strong neglect (Catherine Bergego scale >15/30), 19 and (e) limited passive range of motion (shoulder abduction <60°, elbow extension <30°, and wrist dorsiflexion <20°, specified by goniometric assessment). An overview of flow of participants can be found in Figure 1. Demographic data (age and gender) and clinical history (date, location, nature of stroke) were collected at inclusion. In addition, 12 healthy controls (12 women, aged 32.5 ± 11.4 years), with no history of neurological or orthopedic disease were recruited. The study protocol was approved by the Ethics Committee of Nîmes, France (2009.09.02) and was executed at the Physical Medicine and Rehabilitation Department at Le Grau du Roi (University Hospital of Nîmes, France). All participants provided written consent before inclusion.
Patients’ Characteristics.
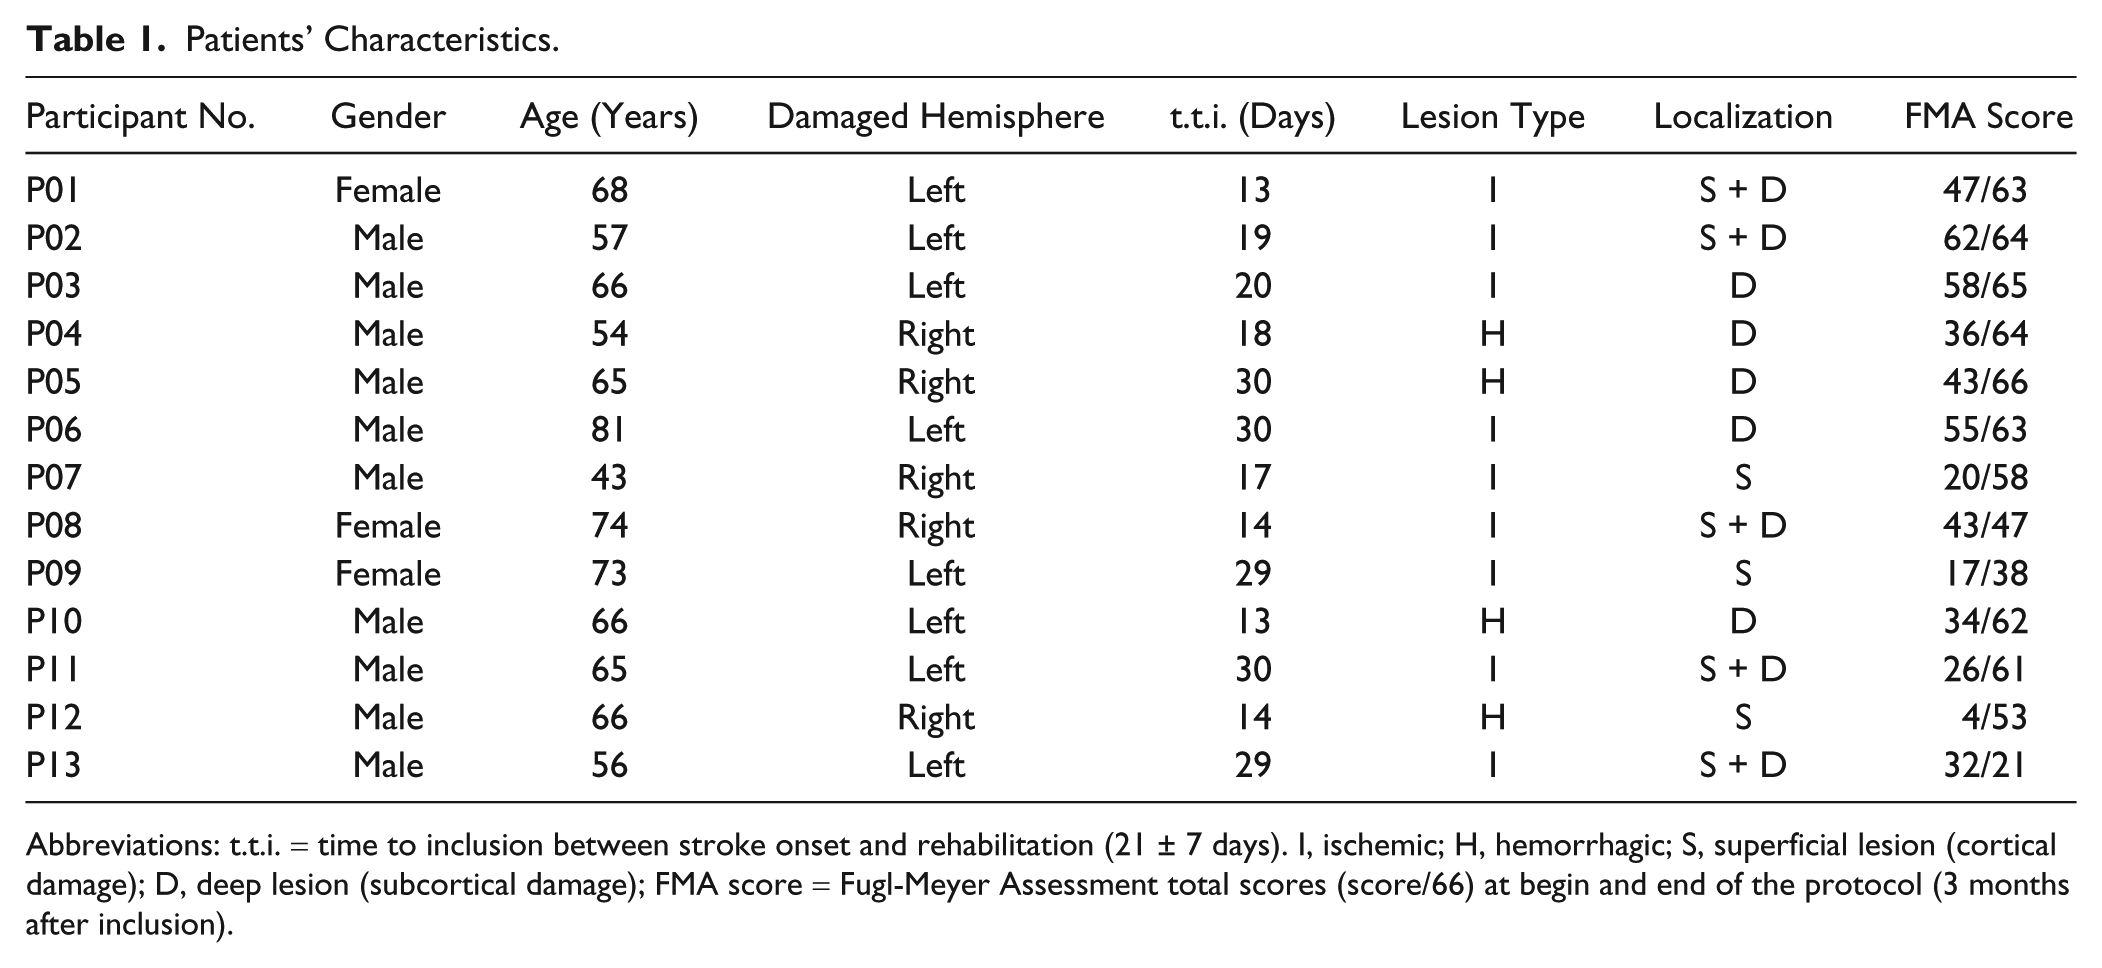
Abbreviations: t.t.i. = time to inclusion between stroke onset and rehabilitation (21 ± 7 days). I, ischemic; H, hemorrhagic; S, superficial lesion (cortical damage); D, deep lesion (subcortical damage); FMA score = Fugl-Meyer Assessment total scores (score/66) at begin and end of the protocol (3 months after inclusion).
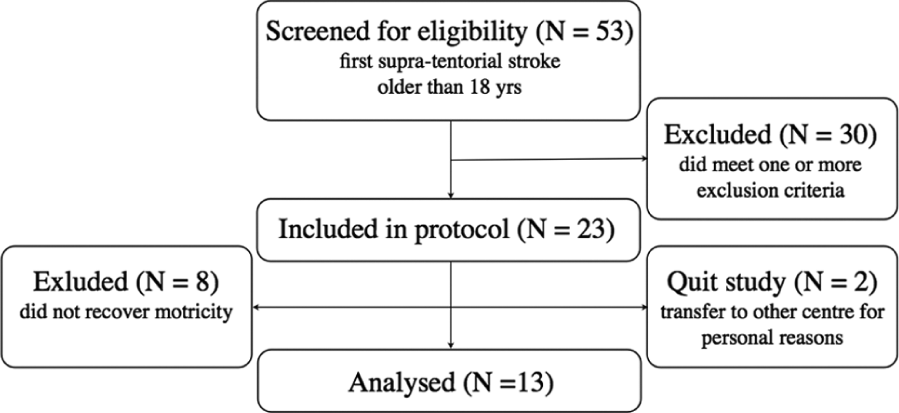
Design and flow of participants through the study.
Procedure
Each participant was evaluated once a week for a period of 6 weeks and at a 3-month follow-up test. Patients’ motor capabilities were assessed with the upper extremity FMA. 4 Controls were only evaluated once.
Kinematic analysis was based on the performance of a reach-to-grasp task. Participants had to grasp a 5-cm polystyrene ball lying on the table placed 20 cm in front of them and bring the ball to a target location 5 cm from the edge of the table (Figure 2). This task was executed 5 times for each limb in fixed order, first with the nonparetic limb, then with the paretic limb. Pace was self-selected, neither speed nor timing was imposed. Participants were seated in front of a table at waist height, so that shoulders remained at rest, elbows were flexed 90°, and hands (palms down) could be placed easily at their respective starting positions. Participants’ trunks were strapped to prevent potential compensating movements.
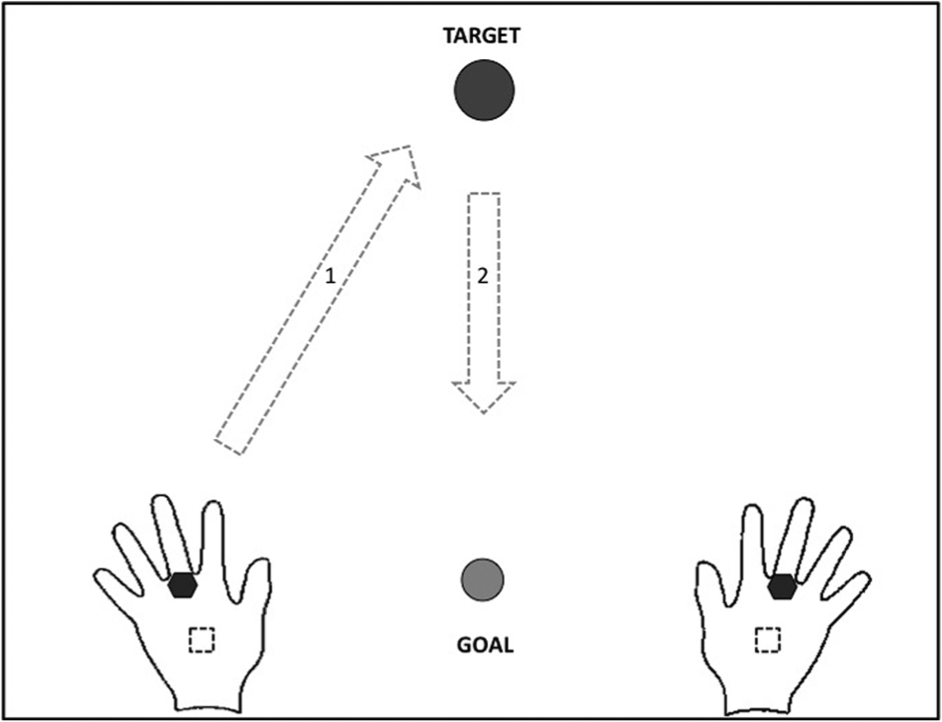
Reach-to-grasp task: Initial hand + sensor (black hexagram) position marked on the table (dotted square), position of the ball (black circle), and trajectory of movement (arrows) with the goal position (gray circle).
Movements were registered using the Fastrack (Polhemus, Colchester, VT, USA), which is composed of a magnetic field source and electromagnetic sensors recording 3-dimensional positions. Sampling frequency was 30 Hz, spatial accuracy was ±1 mm, and data were low-pass filtered at 6 Hz with a zero-lag Butterworth. Sensors were placed along the main axis of both hands, at the head of the third metacarpal.
Kinematic Analysis
Kinematic variables were selected, based on their representation of movement performance and quality.1,3,8,10,14,20,31 During the reaching phase of the movement (a) movement time (MT), (b) peak hand velocity (Vmax), (c) time of maximum velocity (%Vmax), (d) trajectory length (TL), (e) trajectory directness (CurvI), (f) number of velocity peaks (NVP), and (g) movement irregularity (MI) were calculated. Onset and end of movements were defined using a velocity threshold of 0.025 m/s and were visually controlled afterward.
Movement time is a quantitative variable often used in clinical tests. For example, the Box and Block Test evaluates the number of blocks put in a box in a fixed time period. 22 Movement time is closely related to peak velocity, whereas the timing of peak velocity provides insight into movement construction. In healthy people, maximum velocity is reached during the final part of the first half of total movement time, indicating an efficient movement with few corrections in the deceleration phase toward the target. 23 Reaching movements by stroke patients are characterized by a longer movement time and lower maximum velocity peak earlier in the first half of the movement followed by a long deceleration phase.1,24 Velocity profiles are assumed to reflect effectiveness of motor control. 25
Trajectory length is another commonly used variable 26 and is reflected by the accumulated sum of the distance between each consecutive data point in space. Synkinesia (ie, abnormal motor schemas) is frequently observed after brain damage and may increase trajectory length. Over rehabilitation, the trajectory becomes straighter, resulting in a decrease in the curvature index (ie, the ratio between actual hand path and the straight line between beginning and end-point), reflecting trajectory directness.
Finally, it has been shown that pointing movements tend to be highly irregular after stroke20,24 and become more smooth over recovery, whereby the submovements become more blended, fewer, and larger. 27 Smoothness can be assessed using several metrics.14,20,27 The most sensitive way is to integrate the jerk (ie, third time-derivative of position) over the duration of the movement, but the simplest method is to count the number of velocity peaks within the movement. Concerning the latter, the fewer peaks, the fewer submovements, the less irregular the overall movement. Alternatively, measures of movement irregularity can be based on the overall velocity characteristics of the movement. The ratio between peak and mean speed, which is the inverse of the smoothness metrics used by Bosecker et al, 14 measures movement irregularity.
Statistical Analysis
After normal distribution was validated with the Shapiro–Wilks test, a mixed model with random coefficient analysis was performed. The discriminative validity of the kinematics (predictor) was evaluated against the total FMA score (dependent variable) over time (adjusting factor) and patients (random factor). Kinematic values were based on the average of the 5 repeated trials.
In addition, repeated-measures analysis of variance with group (GROUP: stroke, control) as a between factor and side of movement (SIDE: paretic, nonparetic), and week (WEEK: W0, W1, W2, W3, W4, W5, W6, M3) as within-group factors were performed to evaluate the significance of poststroke change in movement quality over time in comparison with the control group. All participants but 2 randomly missed at least 1 evaluation session, rendering a total number of 27 missing data points. These were corrected using linear interpolation between adjacent sessions, participant by participant. 28 Interaction effects were analyzed by a Bonferroni post hoc test.
Results
Link Between Clinical and Kinematic Outcomes
The FMA score for the upper limb increased when the NVP of the paretic hand decreased (NVP β = −2.49, 95% confidence interval [CI] = [−4.83, −0.25], P = .042). The FMA score also increased over time (WEEK β = 0.086, 95% CI = [0.04, 1.68], P = 0.044). Thus, a total of 62.5% of the variability of the FMA score for the upper limb could be estimated by

No significant relationship was found between the FMA score and the other kinematic variables. The results of the mixed model analysis are summarized in Table 2.
Mixed Model: Random Coefficient Analysis Between Total FMA Scores and Kinematics. a
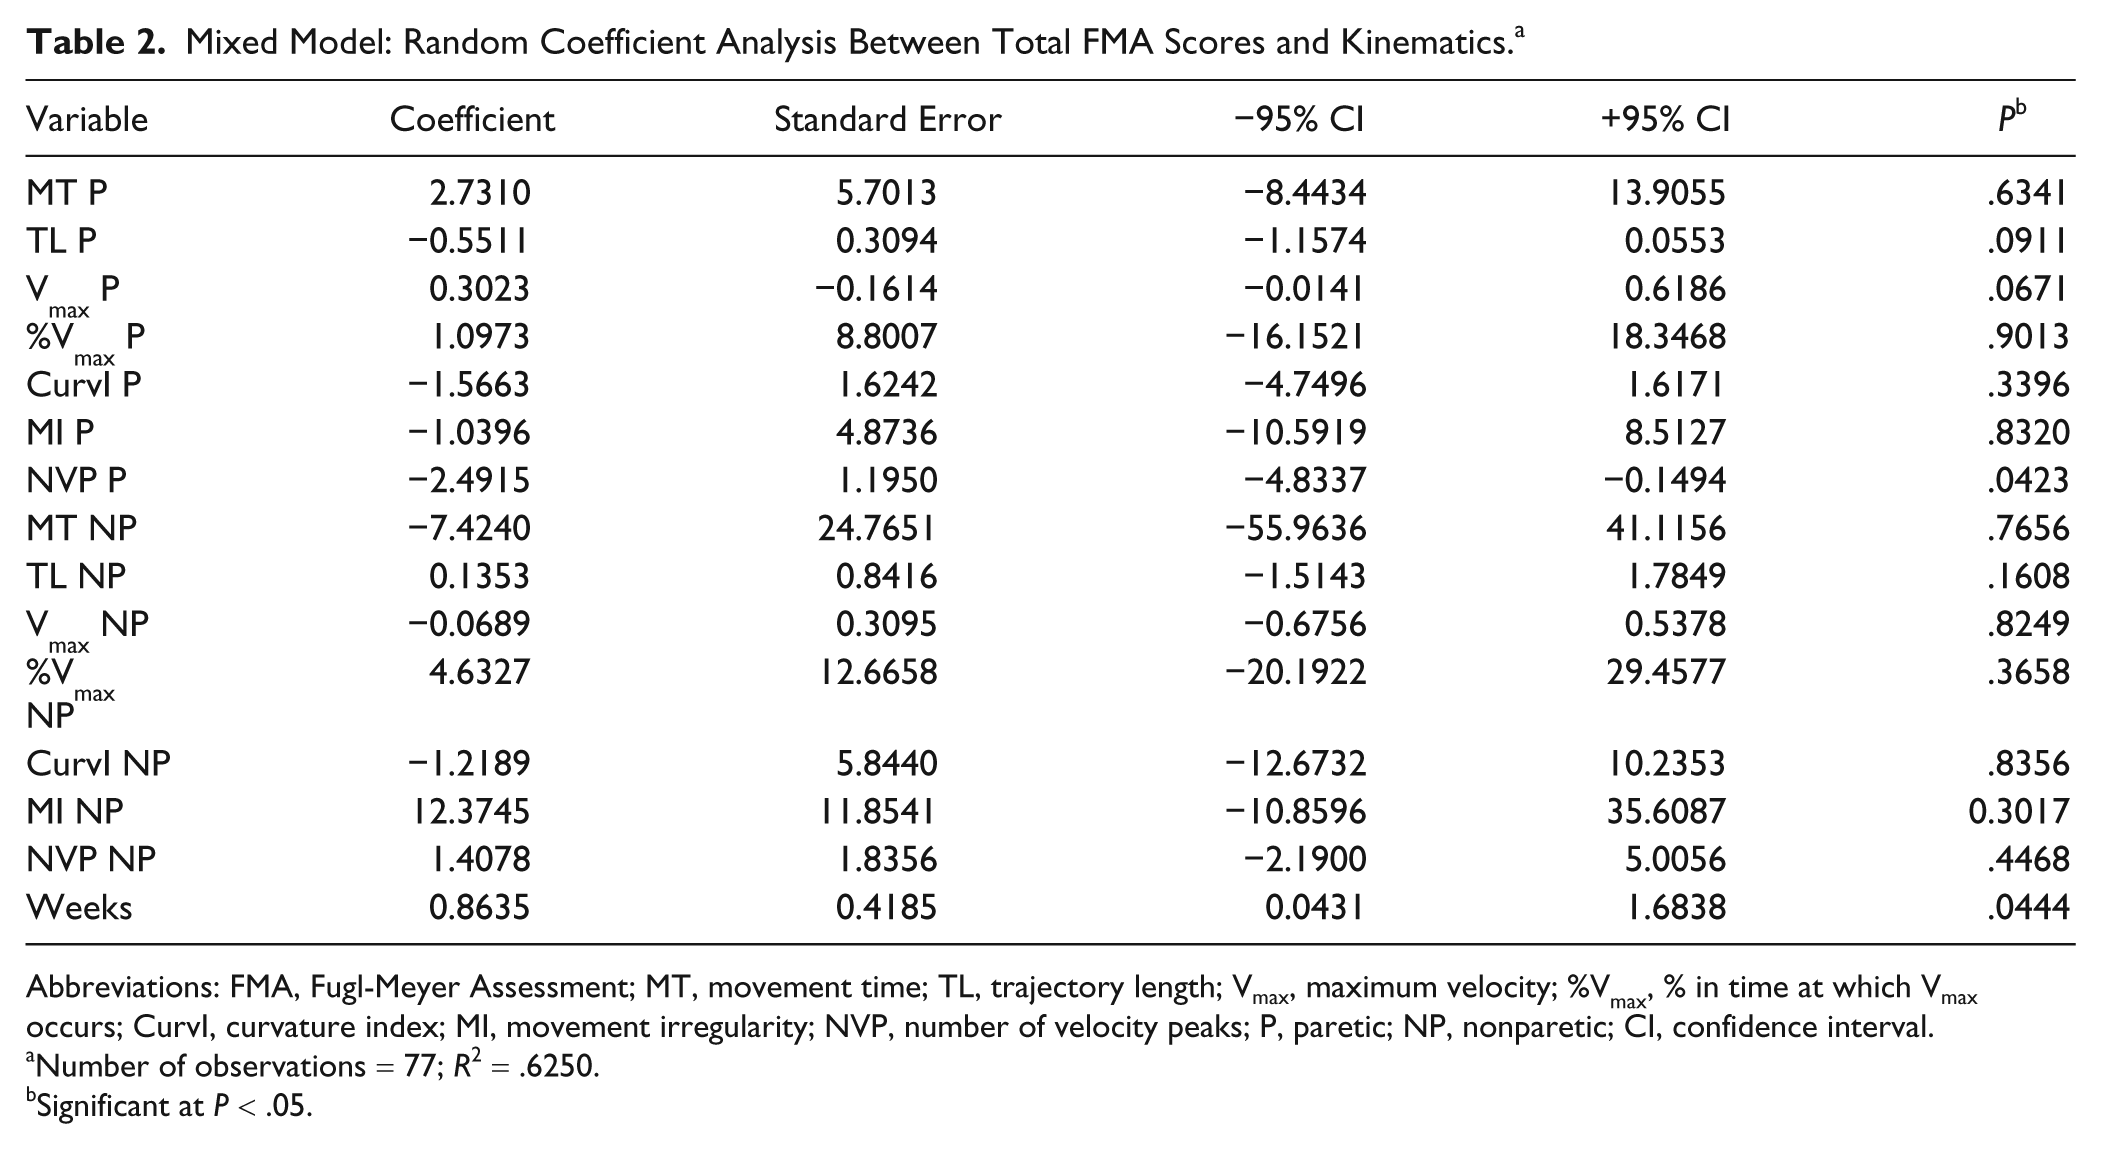
Abbreviations: FMA, Fugl-Meyer Assessment; MT, movement time; TL, trajectory length; Vmax, maximum velocity; %Vmax, % in time at which Vmax occurs; CurvI, curvature index; MI, movement irregularity; NVP, number of velocity peaks; P, paretic; NP, nonparetic; CI, confidence interval.
Number of observations = 77; R2 = .6250.
Significant at P < .05.
Recovery Profile Over Time
Looking at each kinematic variable in relation to the factors GROUP, SIDE, and WEEK it was found that MT differed significantly between patients and controls, F(1, 24) = 4.840, P = .038, which was also true for TL, F(1, 24) = 30.710, P = .000. However, as the starting point differed slightly between patients because of individual physical constraints, mean velocity (Vmean) was additionally calculated. Vmean differed significantly between groups, F(1, 24) = 25.953, P = .000. Modified by a 3-way-interaction of SIDE versus WEEK versus GROUP, Vmean F(1, 24) = 2.541, P = .020, it was found that at every point in time except at follow-up, the paretic hand moved slower (24.66 cm/s) than the nonparetic hand (32.5 cm/s). Vmean of the nonparetic hand in its turn was significantly lower than Vmean of controls (42.61 cm/s; P = .008).
Accordingly, maximum velocity differed significantly between groups, F(1, 24) = 13.056, P = .001. This was modified by two 2-way interactions of SIDE versus GROUP and WEEK versus GROUP, indicating that stroke participants reached a lower Vmax with their paretic hand (48.9 cm/s) than with their nonparetic hand (58.63 cm/s), whereby the latter did not differ from the Vmax reached by controls (67.97 cm/s). The moment in time at which Vmax was reached did not differ between groups, F(1, 24) = 0.442, P = .513). However, within the stroke group %Vmax was reached significantly earlier in time for the paretic hand, at 42% of total movement time, compared with the nonparetic hand, which reached its Vmax at 47% of total movement time, SIDE versus GROUP F(1, 24) = 4.371, P = .047).
Not only did stroke patients move more slowly, they also followed a less direct trajectory to reach the target, as reflected by an increased CurvI for the paretic hand (1.85) compared with both their nonparetic hand (1.49) and controls (1.53)—interaction SIDE versus GROUP F(1, 24) = 6.998, P = .014, which was especially true for the first weeks of evaluation—tended 3-way interaction SIDE versus WEEK versus GROUP F(1,24) = 1.966, P = .062.
Movements of the paretic hand were less smooth than those of both the nonparetic hand and controls on both micro (NVP) and macro levels (MI). Movements of the paretic hand were characterized by multiple velocity peaks (mean NVP = 3.41), which was true at each point in time compared to the nonparetic hand (1.40 peaks), and only for the first 3 weeks of evaluation compared with the control hand (1.24 peaks). NVP variability of the nonparetic hand decreased strongly over recovery from 0.48 to 0.26, a level even lower than that of controls (0.35)—SIDE versus WEEK versus GROUP interaction F(1, 24) = 3.716, P = .001. This low level of NVP variability explained the continuous difference in NVP between the paretic and the nonparetic hand, even when the mean NVP of controls was lower than that of the nonparetic hand. Looking at the macro level of MI, a difference was found between the paretic hand (2.09) and the rest, as well as between the nonparetic hand of stroke patients (1.93) and controls (1.74)—interaction SIDE versus GROUP F(1, 24) = 12.69, P = .002. This has to, however, be seen in the light of a 3-way interaction, showing that this overall difference was based on the first 3 weeks of evaluation, F(1, 24) = 2.283, P = .030. An overview of the 3 most discriminating variables, together with the progression of the FMA score over time, can be found in Figure 3.
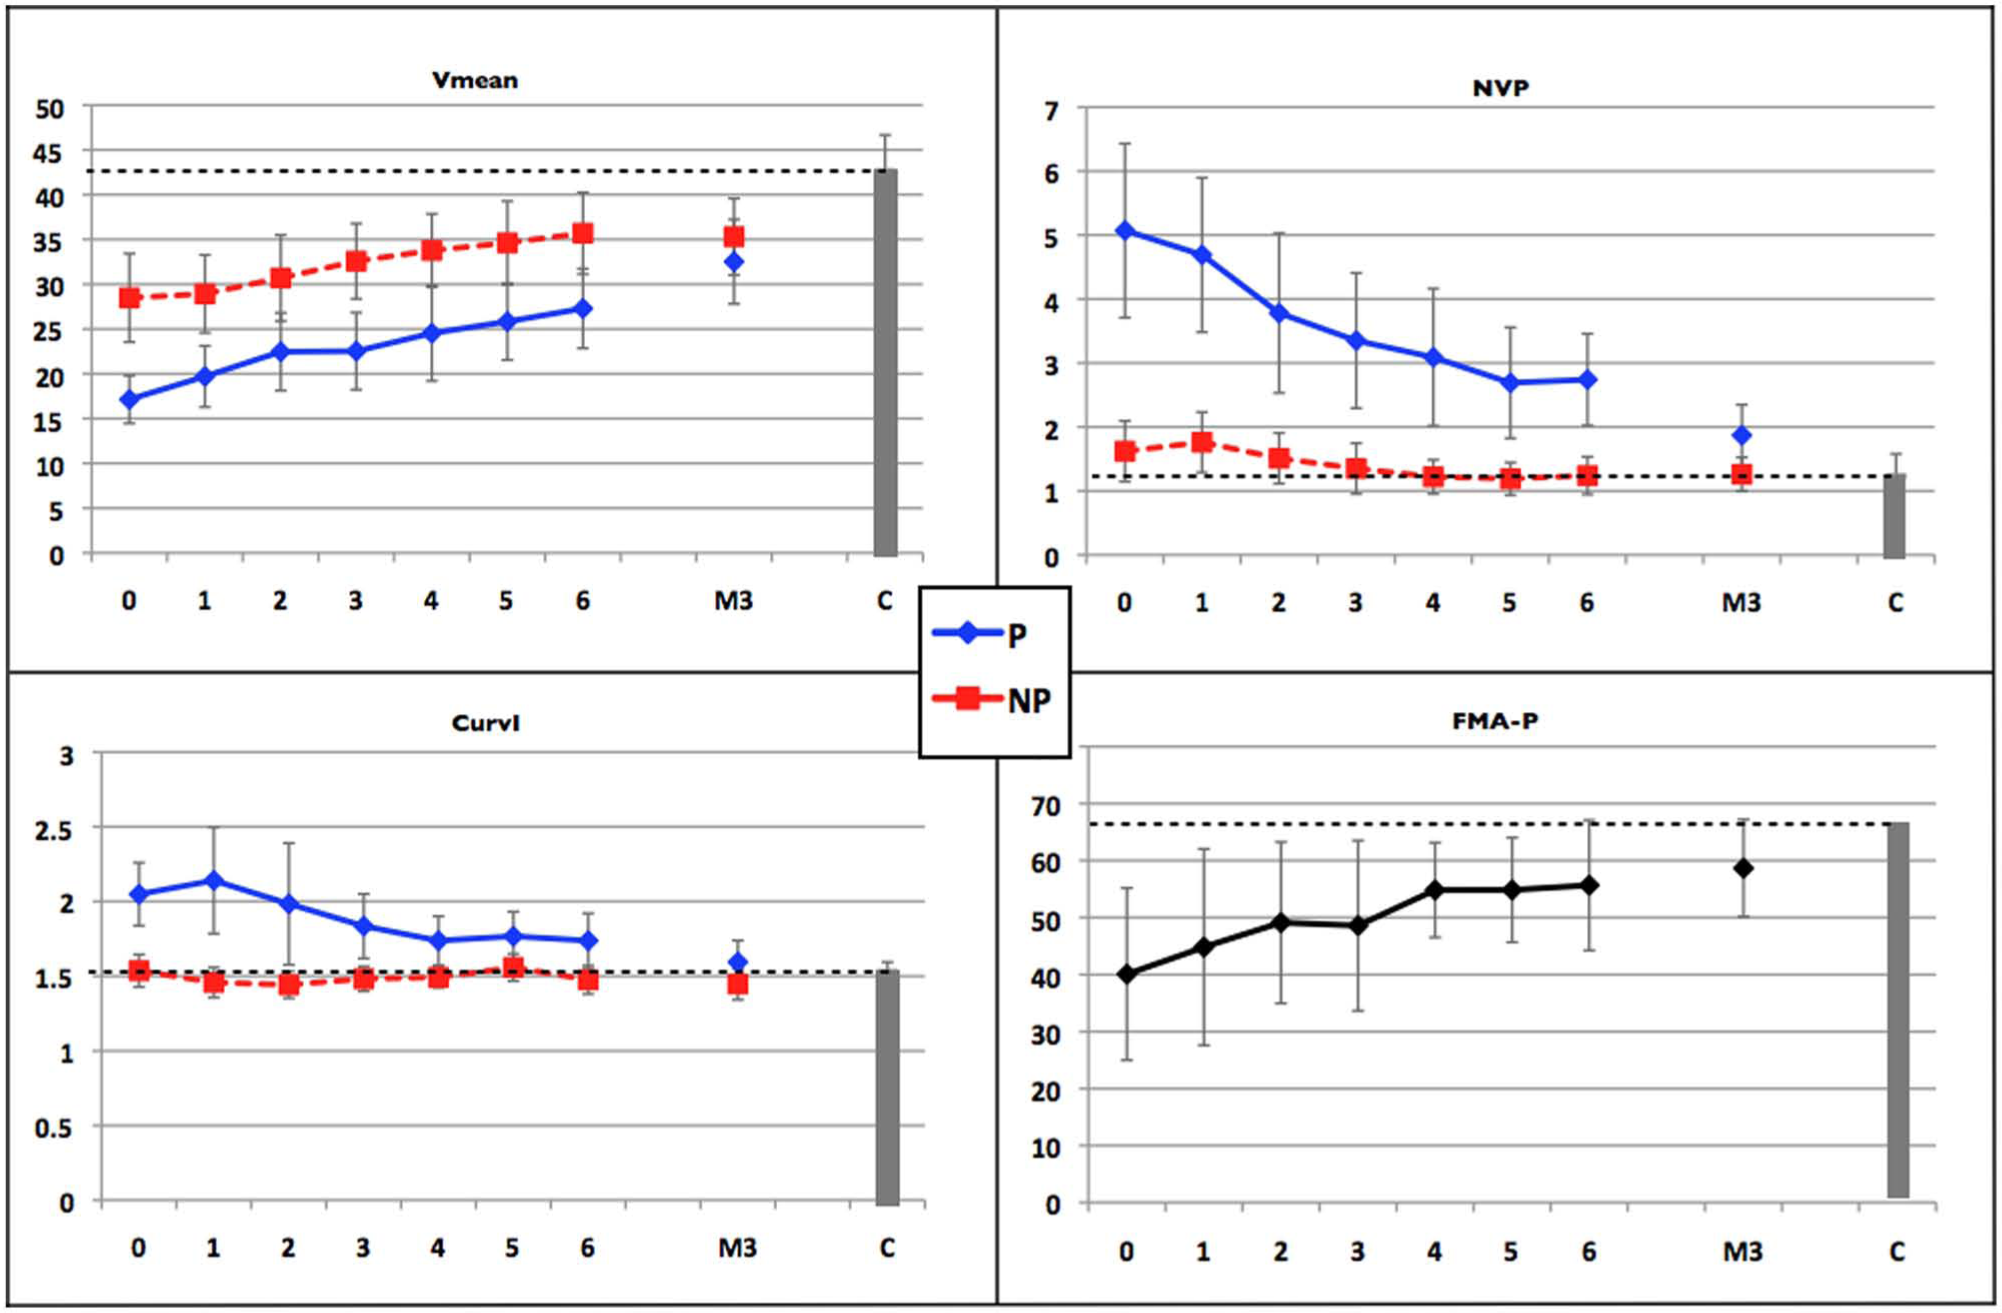
Change in kinematics over time (week 0 to week 6 and at 3 months M3, mean value + standard deviation) is presented for the paretic hand (P) and the nonparetic hand (NP) against the baseline control score (C, gray bar + dashed line). Change in FMA score of the paretic hand (FMA-P), is represented in the right lower panel.
Discussion
The present study showed a clear link between the clinical FMA score and kinematic assessment of upper limb motor recovery in patients poststroke over the first 3 months of rehabilitation: The number of velocity peaks of the paretic hand and the time after inclusion explained 62.3% of the FMA score. The kinematic analysis revealed that participants poststroke moved their paretic hand at a slower pace and less fluently along an indirect trajectory, whereby the maximum velocity peak was lower and occurred earlier in time compared with the nonparetic hand and with controls, in particular during the first 3 weeks of upper limb rehabilitation. Over time, characteristics of both the paretic hand and the nonparetic hand became closer to those of controls.
The first important result of the present study is that the FMA score is linearly predicted by a combination of NPV and WEEK, as illustrated by equation (1). The fact that motor performance improves with increasing smoothness is not surprising. Nor is the fact that motor performance increases over time especially early poststroke, when spontaneous recovery and rehabilitation interact strongly. A recent study by Alt Murphy et al 29 showed that NVP was 1 of the 3 variables differentiating between stroke patients and healthy controls while executing a functional task (eg, grabbing a glass). Furthermore, in a recent observational study, smoothness and directness were identified as key features describing paretic movement control. 30 With the FMA score being a measure of motor performance, the NVP of movement smoothness and WEEK of treatment duration, equation (1) can thus be defined as a 2-fold relation linking motor performance with, both movement smoothness and rehabilitation duration. Smoothness of the reach-to-grasp movement is the most relevant variable depicting motor performance of the upper limb after stroke, being modified by time and rehabilitation poststroke.
However, smoothness was not the only kinematic variable discriminating between motor control of paretic versus nonparetic sides and stroke patients versus healthy controls. As seen in this study, kinematics provides a simple way to analyze evolution of recovery on multiple levels of motor control: velocity, directness, and trajectory length to smoothness. They are sensitive to small changes and influenced neither by the ceiling effect nor by subjective observation. Also, the low execution costs of the reaching task can facilitate daily follow-up in clinical settings, especially when using rehabilitative robotic devices and/or interactive video gaming, which provide simple means to record kinematics during exercises. 14 Detailed and frequent standardized follow-up of many stroke patients may contribute to the identification of markers of motor recovery. 15 These markers may help the therapist to select the correct therapy at the right time for each individual patient, to adapt rehabilitative games automatically, and may facilitate surveillance of telerehabilitation. Being able to adapt the therapy to the patient without additional evaluation sessions may increase the efficacy of therapy in light of both benefits and costs for both patient and therapist.
Even though the relevance of kinematic analysis seems evident, the question of its true significance is yet to be answered. As stated by Nowak, 1 “it is unclear how the particular deficits in the kinematics of grasping movements develop over time from stroke and if these deficits are directly related to the underlying pathology or represent compensatory strategies of the motor system.” The current work provides more insight into the first part of this statement. As previously described, the kinematic profile of stroke patients grew closer toward a healthy profile over rehabilitation leading to approximately straight hand paths with smooth bell-shaped velocity profile.21,27 This is the hallmark of optimization, reflecting effectiveness of motor control, particularly for overlearned skills such as pointing or grasping. 31
Effective motor control in healthy people involves the contralateral activation of numerous brain areas, including the primary motor cortex (M1), the supplementary motor area (SMA), and the premotor cortex with simultaneous inhibition of these areas in the ipsilateral hemisphere. 32 After stroke, changes in motor network topology are found. Although underlying neuronal mechanisms are only partially understood, recent connectivity studies showed a decrease in the intrinsic neural coupling between both ipsilesional M1 and SMA, and in the interhemispheric coupling between both SMAs. Furthermore, an inhibitory influence of the contralesional hemisphere was observed during finger flexion/extension, whereby the amount of inhibitional influence on ipsilesional M1 was correlated to the degree of motor impairment. 33 Early poststroke, the contralesional hemisphere is strongly activated during paretic hand movements, followed by an enhanced bihemispheric control over recovery. Enhanced bihemispheric recruitment may remain, even when clinical scales indicate good recovery of motor capacity 34 and may also explain the differences observed in the control of the nonparetic limb.
However, people poststroke do not only suffer a deficit of descending motor commands, 35 they also suffer a deficit in the acuity of ascending afferents that limits motor control based on somatosensory feedback. 36 This combined deficit in command and feedback signals translates into a higher noise level in motor control, which results in higher motor output variability and lower information throughput of the sensorimotor system. To move with accuracy, people poststroke seem to have no choice but to switch to a mode of control based on the concatenation of discrete submovements. 12 Thus, the observed kinematic changes may indicate a new optimal control strategy in the face of the evident deficits in both descending and ascending signals, requiring less information transfer between the controller and the system being controlled. 37 Future research, combining functional and effective connectivity studies with simultaneous movement registration, could possibly provide more insight into this link between controlling strategies, cerebral plasticity, and kinematics.
The current study was, however, marked by some limitations. For kinematic analysis to be used to its full potential, movement data need to be acquired in a principled and standardized manner. The reaching task in this study was selected because of its paradigmatic position in goal directed upper limb movements. 23 Reaching characteristics are well documented in a healthy population 38 and are known to provide information about poststroke recovery.1,3,8,10,14,20 Based on this knowledge, kinematics related to movement fluency were selected, 21 including velocity kinematics to evaluate global ease of movement and smoothness measures to analyze progressive blending of submovements. 27 A subsequent criteria applied was the direct relation between a kinematic variable and clinical knowledge to facilitate interpretation of outcome numbers. Ease of understanding is important, as the future target users are the patients and caregivers at the rehabilitation centers. However, even though the selection was carefully made, our analysis may be incomplete and more pertinent kinematic measures (or combinations of measures) may exist.
Most patients missed at least one evaluation session, which is often the case in clinical experimental settings. However, under the hypothesis that missing data were randomly distributed and, because of the repeated-measures design of the study, it was possible to reconstruct missing data using linear interpolation between subsequent evaluation sessions. 28
Time after stroke at inclusion varied across patients (21 ± 7 days). During the first weeks poststroke, spontaneous recovery processes play an important role in motor recovery, influencing recovery in a nonlinear way. 39 Spontaneous recovery refers to various processes from restitution of the ischemic penumbra to unmasking of latent synapses that occur to a different account in each patient. To control the effects of spontaneous recovery, it would have been desirable to align the onset of stroke with the onset of the study, but practical limitations prevented this. As a consequence, it is certain that spontaneous recovery influenced the performance of the patients. However, we carefully controlled the timing and the amount of rehabilitation, to emphasize the effect of general treatment. At inclusion, none of the participants had received any upper limb rehabilitation and the amount of training was standardized during the study. Yet the intermingling of the effects of spontaneous recovery and rehabilitation should be kept in mind when interpreting results.
In summary, kinematic analysis of reach-to-grasp movements is relevant in evaluating upper limb recovery early poststroke. The number of velocity peaks, measuring smoothness, correlates well with the FMA scores, measuring motor performance. Kinematics provides, however, the additional possibility of evaluating motor capacity and quality in an objective and easy way. Regular kinematic evaluations may provide essential information on recovery processes and thereby contribute to the current challenges faced in stroke rehabilitation: identifying markers of recovery and defining which therapy should be given to whom at which moment in time.
Footnotes
Acknowledgements
The authors would like to thank C. Demattei for his contribution to the statistics and K. Hughes and L. Lagerqvist for improving the readability of the article.
Authors’ Note
Liesjet van Dokkum and Isabelle Hauret contributed equally to this work.
Declaration of Conflicting Interests
The author(s) declared no potential conflicts of interest with respect to the research, authorship, and/or publication of this article.
Funding
The author(s) disclosed receipt of the following financial support for the research, authorship, and/or publication of this article:
This study was supported by Nîmes University Hospital (EudraCT: 2009-A00872-55), the European SKILLS project (FP6 IST 035005), and MoJOS (092930679).