
Abstract
Background. Kinematic movement analysis is increasingly used as an outcome measure in evaluation of upper extremity function after stroke. Little is known, however, about what observed longitudinal changes in kinematics mean in the context of an individual’s functioning. In this study, the responsiveness and expected change in kinematic measures associated with clinically meaningful improvement in the upper extremity were evaluated. Methods. Kinematic movement analysis of a drinking task and Action Research Arm Test (ARAT) were performed early (9 days poststroke) and at 3 months after stroke in 51 subjects. The receiver-operating characteristic curve and linear regression analyses were used to evaluate responsiveness of kinematic parameters. Results. Movement time, smoothness, and trunk displacement discriminated those subjects demonstrating clinically meaningful improvements. Significant associations of 31% to 36% were found between the change in ARAT and kinematic measures. A real clinical improvement in kinematics lies in the range of 2.5 to 5 seconds, 3 to 7 units, and 2 to 5 cm in movement time, smoothness, and trunk displacement, respectively. Conclusions. All kinematic measures reported in this study are responsive measures for capturing improvements in the upper extremity during the first 3 months after stroke. Approximate estimates for the expected change in kinematics associated with clinically meaningful improvement in upper extremity activity capacity illustrate the usefulness of the linear regression analysis for assessing responsiveness. This knowledge facilitates the selection of kinematic measures for clinical and movement analysis research as well as for technology-based devices.
Keywords
Introduction
Impaired upper extremity function has been reported for approximately 70% of stroke survivors on admission 1 and for 40% at 3 months. 2 Recovery follows a nonlinear pattern, and the main improvement occurs within the first months after stroke. 3
Evaluation of a patient’s recovery, functional improvement, or the efficacy of a treatment requires valid, reliable, and responsive outcome measures during all stages of stroke rehabilitation. 4 Most outcome measures used to assess the upper extremity are observational rating scales and rely on subjective standardized assessments rather than objective quantitative measurements. Kinematic analysis of upper extremity movement has been increasingly employed in stroke subjects,5-8 to study motor recovery 9 or to evaluate the effects of therapeutic interventions.10-13
Reaching and reach-to-grasp tasks are commonly studied, and measures of movement time, smoothness, and compensatory movement patterns are frequently reported. However, reliability, responsiveness, and clinical relevance of kinematic measures are not well studied. Movement time, smoothness, and trunk displacement in the reach-to grasp task have been reported to be stable and reliable measures of motor performance in persons with stroke and cerebral palsy.14,15 To our knowledge, responsiveness of kinematic measures in upper extremity tasks has only been addressed in 2 studies.13,16 In both, the internal responsiveness estimates, such as effect size and standardized response mean (SRM), were used to investigate the change in kinematics. Estimates of internal responsiveness have been criticized, because they reflect primarily the variability and magnitude of the change rather than the responsiveness or longitudinal validity of the change.17-19
Methods such as receiver-operating characteristics (ROC) curve and regression analysis, which use an external criterion to detect change, may be more appropriate in determining the responsiveness of a measure.17,19,20 Patient-reported global rating scales have been used in many studies as external criterion but are criticized since the reporting is subjective, retrospective, and often general.19,20 An established clinical outcome with known amount of change, indicating a clinically important change, has been recommended to be used as external criterion. 17 Among upper extremity outcomes measures, the Action Research Arm Test (ARAT) is one of the most frequently used clinical assessments, for which the clinically meaningful change have been established to be approximately 10% of the total range of the scale. 21 The 10% limit has been reported for similar outcome measures in different domains.21,22 Using this test, we evaluated the responsiveness of movement performance kinematics during a drinking task in the subacute phase after stroke and estimated the qualitative meaning of a change that can be considered to be clinically meaningful.
Methods
Subjects
The sample was extracted from the Stroke Arm Longitudinal Study at the Gothenburg University (SALGOT). 23 The study was approved by the regional ethics committee, and written informed consent was obtained from all subjects. Inclusion criteria were first ever stroke, impaired upper extremity function at day 3 poststroke (<57 points on ARAT), and age 18 or older. Exclusion criteria were other upper-extremity condition or severe multi-impairment or diminished physical condition prior to the stroke that limits the functional use of the affected arm, life expectancy less than 12 months due to other illness (cardiac disease, malignancy), and not Swedish speaking. All tests were performed by 2 experienced physical therapists, after a joint training period prior to the study, according to the SALGOT study protocol. 23 All subjects followed standard rehabilitation planning and procedures. Data from the SALGOT cohort were screened and all subjects who could perform the kinematic movement analysis of the drinking task during the first 4 weeks (baseline) and as well at 3 months poststroke (follow-up) were included in the current study.
A total of 51 subjects were divided into 2 subgroups based on the change in upper extremity function measured with ARAT between baseline and follow-up. The subjects who showed less than 6 points improvements on the ARAT (<10% of the total score) comprised subgroup 1, and the subjects demonstrating improvements equal or more than 6 points (>10%) comprised subgroup 2. Thus, subgroup 2 included only subjects who demonstrated a real clinical improvement in upper extremity function based on the change in ARAT. 21 The demographic data and clinical characteristics at baseline for the 2 subgroups are displayed in Table 1.
Demographics and Clinical Characteristics at Baseline and Received Rehabilitation During First 3 Months After Stroke (N = 51).
Abbreviations: ARAT, Action Research Arm Test; FMA-UE, Fugl-Meyer Assessment Upper Extremity; MAS, Modified Ashworth Scale.
Data are presented as mean ± standard deviation or n.
Kinematic Movement Analysis
A standardized drinking task with good test–retest reliability was used in this study.5,24 The drinking task incorporated reaching, grasping, lifting the glass, taking a drink, and returning to the initial position.5,24 The glass, with100 mL water, was placed 30 cm from the table edge in the midline of the body (approximately 80% of arm’s length). The subjects were sitting in a height adjustable chair with their back against the chair back; the upper arm in neutral adducted position with approximately 90° flexion at elbow; the palm of the hand resting on the table. The drinking task was performed without any constraint at a comfortable self-paced speed. The mean of 3 middle trials of 5 on the affected arm were used.
Three-dimensional motion analysis was performed with a 5-camera optoelectronic ProReflex Motion Capture System (MCU240 Hz, Qualisys AB, Goteburg, Sweden). The capture data was transferred to Matlab software (The Mathworks Inc, Natick, Ca) for custom-made analysis and filtered with 6 Hz second-order Butterworth filter in both forward and reverse directions, resulting in a zero-phase distortion and fourth-order filtering. The drinking task was broken down into 5 logical phases: reaching, forward transport to the mouth, drinking, back transport, and returning the hand to the initial position.5,24
Nine retroreflective markers were placed on the tested hand (third metacarpophalangeal joint), wrist (styloid process of ulna), elbow (lateral epicondyle), right and left shoulder (middle part of acromion), thorax (upper part of sternum), and face (notch between eyebrows), and on the glass (upper and lower edges). 5 Kinematic variables analyzed in this study were the total movement time (MT), number of movement units (MU), and the trunk displacement (TD). These 3 variables represent the key elements of movement performance and compensatory movement pattern during a drinking task and have also proven to discriminate well between different sensorimotor impairment levels in persons with stroke. 24 Test–retest reliability has been reported to be excellent for the movement time and trunk displacement in a reach-to-grasp task with comfortable speed in stroke subjects (intraclass correlation coefficient [ICC] 0.94; 0.91) 14 as well as for the movement smoothness (ICC 0.88) in a reach-to-grasp task in children with cerebral palsy. 15
Total movement time was calculated for entire drinking task. The onset and offset of movement was defined as the time when the tangential velocity of the hand marker exceeded or was less than 2% of the maximum velocity in the reaching respective returning phase. 5 Movement smoothness was quantified by computing the number of movement units during reaching, forward transport, back transport, and returning phase. One movement unit comprises acceleration, a predominant velocity peak, and deceleration. It was defined as a difference between a local minimum and next maximum velocity value that exceeded the amplitude limit of 20 mm/s on the hand marker velocity profile; the time between 2 subsequent peaks had to be at least 150 ms. In healthy subjects, the minimum number of MU during the drinking task is 4, at least 1 unit per movement phase. Compensatory trunk displacement was computed as the maximal displacement of the thorax marker in sagittal plane from the initial position.5,24 A complete description of the data analysis and raw data handling has been reported earlier.5,24,25
Clinical Assessments
The upper extremity activity capacity was evaluated using the ARAT. 26 The ARAT uses 4-point ordinal scoring on 19 items divided into 4 hierarchical subtests: grasp, grip, pinch, and gross movement. The maximum total score of 57 indicates normal performance.26,27 ARAT has been shown to have good validity, excellent inter- and intrarater reliability,22,26,28 and high responsiveness to spontaneous and therapy-related gains after stroke.21,29
For the background clinical characteristics, the Fugl-Meyer Assessment for Upper Extremity (FMA) including the nonmotor domains of sensation and pain during passive joint motions were scored. 30 The increased muscle tone in elbow and wrist joint was assessed with Modified Ashworth Scale (MAS). 31
Statistical Analysis
Statistical analyses were performed using SPSS (Statistical Packages for Social Sciences, 16.0). Paired t test along with the partial η2 effect size statistics were calculated for both subgroups.
As a first step, responsiveness to external change 19 was evaluated for the group of 51 subjects with contrast between subgroups. Both the independent sample t test and the ROC curve analysis were employed. In ROC curve analysis, the area under the curve (AUC) was used to expresses probability of the kinematic variables to correctly classify subjects between the subgroups. A test value of 1.0 indicates a perfect classification, and a value higher than .70 can be considered to be acceptable. 17 The ROC curves were examined to determine cutoff values for the change in kinematic variables at which the probability to correctly classify subjects under the respective group was highest. The sensitivity and specificity for these cutoffs were calculated. The upper 95% limit of agreement (LOA) was calculated for the subgroup 1, which corresponds with 95% specificity on the ROC curve. 32
Simple linear regression analysis was then used to determine the amount of variance in the change of the kinematic measures that was associated with the change in the ARAT score in subgroup 2. The unstandardized coefficient B was employed to determine the amount of change in kinematic measure (dependent variable) that was associated with a unit change in ARAT (independent variable). Multiple linear regression analysis was employed to control for the possible effect of age, gender, person’s height, and baseline level of the kinematic measures. Preliminary analyses were conducted for the regression analyses to ensure no violation of the assumptions of normality, linearity, multicollinearity, and homoscedasticity.
Results
Tangential velocity profiles from the drinking task at baseline and 3 months poststroke are displayed in Figures 1 and 2. These graphs represent a typical subject from subgroups 1 and 2, respectively. The velocity profiles are more segmented and the number of movement units is larger along with longer total movement time at baseline early after stroke. The specific problem areas as well as the areas where the improvements have occurred can be identified and visualized. For example, in both graphs, improvements can be observed in the beginning of the forward transport phase when the subject is grasping the glass and.
Tangential velocity profiles of hand marker, number of movement units (smoothness), and movement time during the drinking task representing a typical subject from subgroup 1 (no real clinical improvement) at baseline (day 9) and at 3 months poststroke. At 3 months, the movement time was decreased (from 9 to 6 seconds), smoothness (number of movement units) was improved (from 8 to 5), and Action Research Arm Test (ARAT) score improved from 55 to 57. Note that the scaling is different on x- and y-axes.
Tangential velocity profiles of hand marker, number of movement units (smoothness), and movement time during the drinking task representing a typical subject from subgroup 2 (real clinical improvement) at baseline (day 9) and at 3 months poststroke. At 3 months, the movement time was decreased (from 16 to 8 seconds), smoothness (number of movement units) was improved (from 19 to 9), and Action Research Arm Test (ARAT) score improved from 49 to 56. Note that the scaling is different on x- and y-axes.
The mean change in kinematic measures between baseline and follow-up are displayed in Table 2. Both groups showed improvements in kinematic variables, but the change, as expected, was much larger in subgroup 2. Statistically significant change with relatively large effect size was also present for movement time and smoothness in subgroup 1. This finding implies that movement time and smoothness are more sensitive to changes than the measure of trunk displacement. The mean difference between the subgroups was 5.6 seconds (SD = 1.8; P = .007) for movement time, 9.1 units (SD = 2.6; P = .003) for smoothness, and 3.4 cm (SD = 0.9; P = .003) for trunk displacement.
Change in Kinematic Measures From Baseline to 3 Months Follow-Up (Mean ± SD).
Abbreviations: CI, confidence interval; MT, movement time; MU, movement units (during 4 movement phases meaning that the minimum number of units is 4); TD, trunk displacement.
ROC curve analysis and AUC statistics demonstrated that kinematic variables could discriminate between subjects in groups 1 and 2 (Table 3). Measurement of movement smoothness demonstrated the highest AUC (0.84) and sensitivity/specificity. The most optimal cutoff values obtained for the kinematic measures are displayed in Table 3. The sensitivity and specificity for the cutoffs, apart from the sensitivity of trunk displacement, was at least 0.70. The upper limit of 95% agreement (LOA) for the movement time, smoothness, and trunk displacement in subgroup 1 was 4.2 seconds, 6.3 units, and 4.7 cm, respectively. These limits correspond to the 95% specificity on the ROC curve.
Receiver Operating Characteristics Curve Analysis for the Change in Kinematic Measures (N = 51).
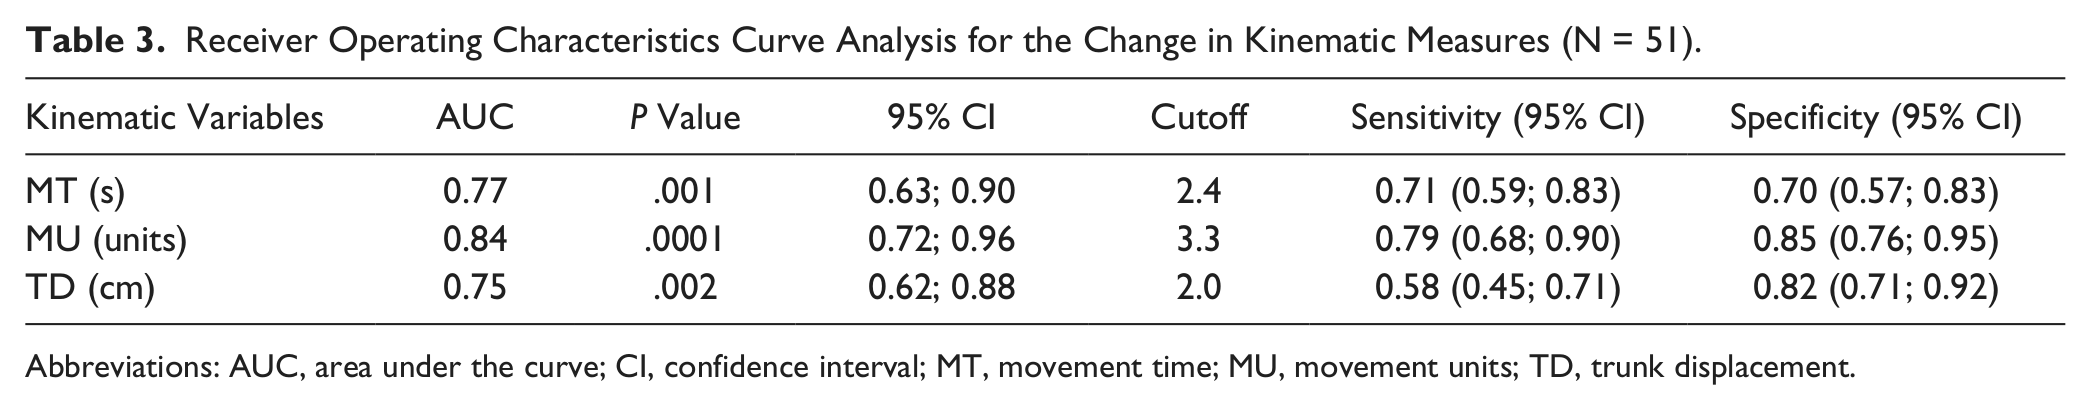
Abbreviations: AUC, area under the curve; CI, confidence interval; MT, movement time; MU, movement units; TD, trunk displacement.
Univariate linear regression analysis revealed that improvement in upper extremity function could explain 31% to 36% of the variance in the kinematic measures (Table 4). The unstandardized coefficient B, reported in Table 4, indicates, on average, the expected change in kinematic variable associated with 1 unit change in ARAT score. This coefficient becomes particularly useful when the results from regression analysis are interpreted. For example, a 1-point increase in ARAT score, on average, corresponds to a 0.86 second decrease in movement time. Thus, while it is assumed that a 6-point improvement in ARAT score indicates a clinically meaningful change, the corresponding improvement in movement time in the drinking task would be approximately 5 seconds (last column in Table 4). Similarly, an approximate 7-unit decrease in smoothness and an approximate 3-cm decrease in trunk displacement were associated with a clinically meaningful change in upper extremity function. These estimates, indicating a clinically meaningful change, can be compared with the mean change observed in subgroups 1 and 2 (Table 2). As expected, the improvements in subgroup 2 were larger and in subgroup 1 smaller than the calculated estimates.
Univariate Linear Regression Analysis Between the Change in Kinematic Measures (Dependent Variable) and ARAT Scores (Independent Variable) (n = 24).
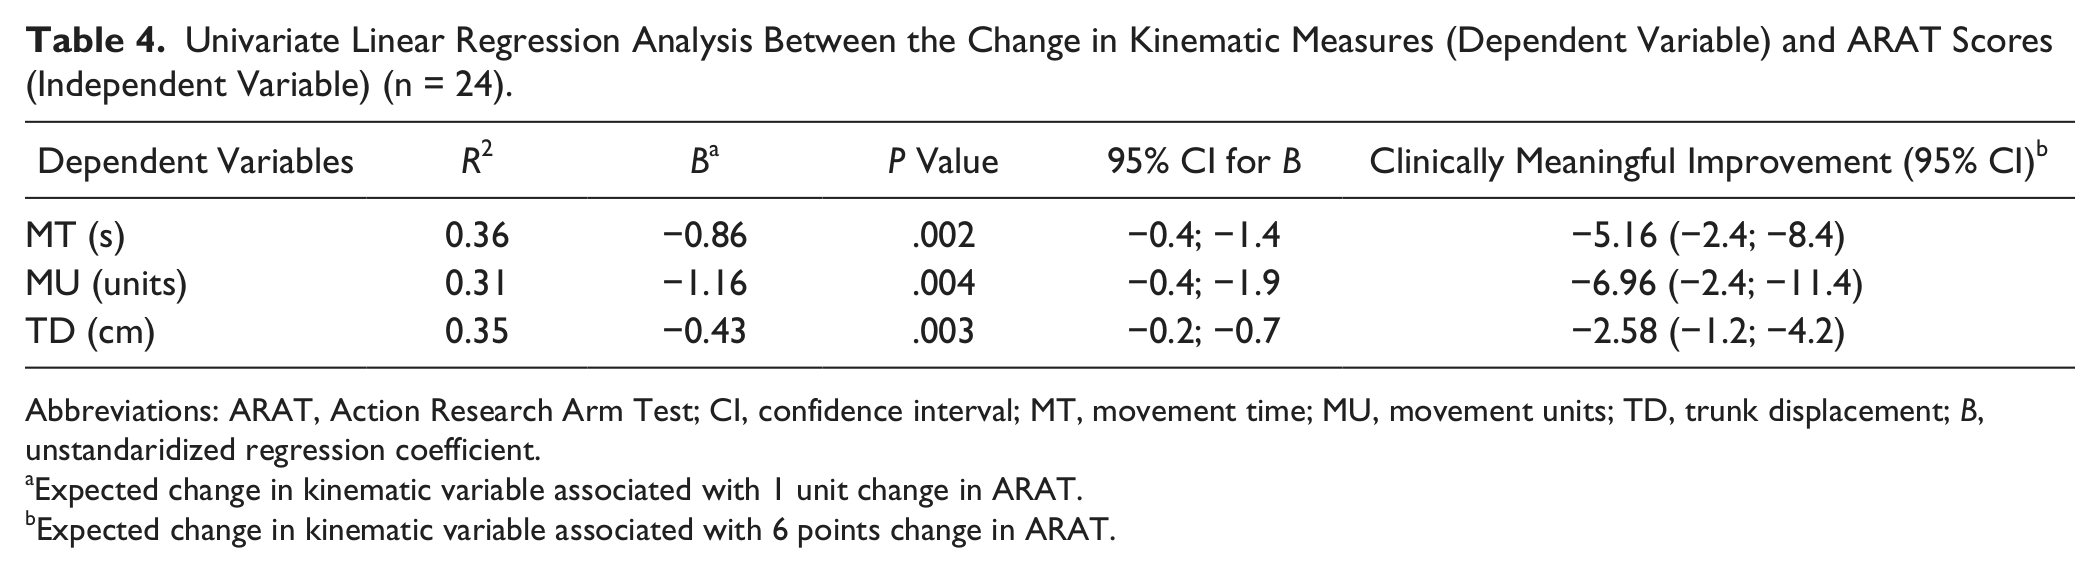
Abbreviations: ARAT, Action Research Arm Test; CI, confidence interval; MT, movement time; MU, movement units; TD, trunk displacement; B, unstandaridized regression coefficient.
Expected change in kinematic variable associated with 1 unit change in ARAT.
Expected change in kinematic variable associated with 6 points change in ARAT.
Multiple linear regression analysis confirmed that age, gender, height, and baseline level of the kinematic measures did not influence the effect of ARAT on kinematic measures. ARAT was the only significant independent variable in the model when the controlling variables were included and the unstandaridized regression coefficients (B) of the ARAT were comparable with coefficients (B) in the simple regressions.
Discussion
Our findings demonstrate that kinematic measures of movement time, smoothness, and trunk displacement are responsive measures for capturing improvements in upper extremity function during the first 3 months after stroke. Responsiveness was determined in relation to corresponding changes in upper extremity activity capacity, assessed with the ARAT. The ROC curve and linear regression analyses provided a new dimension to the evaluation of responsiveness in kinematic measures and offered interpretable estimates that are closely associated with the concept of clinically meaningful improvement. In addition, movement time and smoothness could detect smaller changes and demonstrated a higher sensitivity to identify subjects with clinically meaningful improvements compared to trunk displacement.
Our findings from linear regression analysis provide new and valuable information about the amount of change in kinematic measures associated with a certain amount of change in upper extremity function. The regression coefficient (B) can effectively be used to determine the absolute change in kinematics that corresponds to a certain clinical change. For example, a decrease in movement time by 5 seconds during the drinking task is associated with 6 points improvement in ARAT score. Similarly, the decrease in number of movement units by 7 would indicate a clinically meaningful improvement in upper extremity function. These results illustrate the usefulness of the linear regression analysis for assessing responsiveness and provide a more comprehensive understanding of the relationship between the change in an external criterion and a measure under study.
In addition to the regression analysis, the findings from ROC curve analysis may be clinically useful. All 3 kinematic measures—examined in this study—showed good discriminative capacity. All estimated cutoffs indicating a clinically meaningful improvement showed good sensitivity and specificity, except the sensitivity for the trunk displacement. A probable explanation for this could be that a relatively high number of subjects in subgroup 2, despite their decreased upper extremity function, did not need to use the trunk displacement compensation strategy to complete the drinking task. Our findings from ROC curve analysis support that at least the cutoffs for movement time and smoothness can to some extent be applied to indicate a clinically meaningful improvement of an individual subject. 33 For clinical interpretation, preferably, the estimates from different analysis could be combined when improvements in kinematics are evaluated. In other words, a cutoff indicating a real clinical improvement in kinematics would be expected to lie in the range of 2.5 to 5 seconds, 3 to 7 units, and 2 to 5 cm in movement time, smoothness, and trunk displacement, respectively.
To our knowledge, no previous studies employed a regression analysis to assess the responsiveness of the kinematic measures in upper extremity after stroke. However, few studies have evaluated the responsiveness of kinematic measures using the internal responsiveness statistics, such as effect size or SRM. In these studies, the responsiveness was reported to be high for the movement duration and smoothness in reaching and in hand-to-mouth tasks in stroke subjects.13,16 It must be noted that SRM and effect size reflects primarily the magnitude of change in standard deviations rather than the responsiveness or longitudinal validity of the change scores.17-19 At the same time, in the literature, it has been suggested that when properly used together with specific hypothesis of expected change between groups or measures, the effect size estimates can be used to estimate responsiveness of a measure. 17 The results from these 2 studies give us an indication that among others, the kinematic measures of movement time and smoothness, in particular, have shown the ability to detect a change after an intervention. These results are in concurrence with our findings, where the movement time and smoothness measure demonstrated a high discriminative capacity and were significantly associated with improvements in upper extremity activity capacity.
Another central issue, besides responsiveness, is the interpretation of the change in a measure. This knowledge is particularly important for the new or lesser known measures or when the meaning of the change scores is not immediately clear. 17 There are 2 previous reliability studies were the minimal detectable change (MDC) has been reported for the kinematic measures. In one of these studies, relatively small MDC values were reported for most tested variables during reach-to-grasp tasks in stroke subjects. 14 The trunk displacement was the only variable in their study that showed higher MDC value, but as the authors noted, the scale of this measure was larger compared to other variables. In the second reliability study, 4 different reaching conditions were reported together, which makes comparison with our study difficult, but as the authors reported, measurement errors were larger for fast speed and high target conditions. 34 Two main conclusions can be drawn from these 2 reliability studies with reference to our results. First, a relatively large absolute change would be required for the trunk displacement measure to indicate a real change. 14 Second, the reaching task with comfortable speed and height may produce smaller measurement errors and subsequent smaller MDC values. 34
The concept of MDC is closely related to measurement error and the reliability of measurement. In clinical research and practice, however, clinically important or meaningful changes in a measure are equally important. There is no consensus on the best method to determine the clinical importance of the change, but the use of an external criterion that defines what patients or clinicians consider as an important improvement has been recommended.17,19,33 In the current study, the responsiveness of kinematic variables was estimated using an external criterion by which the improvement in upper extremity capacity was assessed to be real and clinically meaningful. 21 This means that the results from this study should always be reflected by changes in upper extremity activity capacity assessed with ARAT. The ARAT was selected to serve as an external criterion in this study partly because it has been widely deployed21,22,29 and has an appreciable association with kinematic measures, 25 which is a requirement for an external criterion. 33
For the ARAT, the minimal clinically important difference (MCID), based on patient perceived ratings of change early after stroke, has been reported to be between 12 and 17 points. 29 These MCID estimates, as stated by the authors, 29 should however be interpreted with caution, due to the small sample size. Thus, further studies are needed to establish MCID estimates on ARAT. In this study, we calculated a clinically meaningful change in kinematics corresponding to a 6-point change on ARAT, 21 but any preferred estimate on ARAT could be used to calculate a corresponding change in kinematics using the coefficient B provided in the Table 4.
In neurorehabilitation and motor control research, a distinction can be made between true motor recovery and compensation. 35 It has been suggested that quantitative movement analysis could be used to allow this kind of differentiation. 36 With regard to the kinematics evaluated in this study, we could speculate that trunk displacement reflects primarily the component of compensation, movement smoothness the recovery, and movement time both compensation and recovery. In a clinical perspective, it would be useful to be able to distinguish in which component the change has occurred when treatment effects are evaluated or when rehabilitation interventions are planned. This hypothesis, however, remains to be proved in further studies.
In the current study, the minimum requirement for inclusion was the ability to perform drinking task using the paretic arm. This requirement sets the limit for the generalization of the results. Similarly, the results from the regression analysis are valid for subjects with comparable upper extremity function, that is, subjects with ARAT scores less than 52 points. This means that estimates from the regression analyses cannot directly be applied to the people with already high upper extremity function or almost normal movement performance.
Translation of knowledge from kinematic analysis into clinically interpretable measures in upper extremity tasks has so far been modest. This study contributes to a better understanding of the longitudinal changes in the upper extremity kinematic measures in relation to the changes in an individual’s clinical function. This combined knowledge facilitates both clinical and movement analysis research and can be valuable in the area of bioengineering when the assessment methods for new technology-based devices are developed.
Conclusion
Our results demonstrate that movement time, smoothness, and trunk displacement are responsive measures for capturing improvements in upper extremity function during the first 3 months after stroke. Our results illustrate the potential of the ROC curve and linear regression analysis for assessing responsiveness in kinematic measures and provide clinically interpretable and useful estimates for the expected change in a kinematic measure that is associated with clinically meaningful improvement in upper extremity activity capacity.
Footnotes
Acknowledgements
We thank all participants; colleagues Hanna Persson, Anna Danielsson, and Eva-Lena Bustrén for practical and conceptual help; and Anna Ekman and Kjell Pettesson for statistical consultations.
Declaration of Conflicting Interests
The author(s) declared no potential conflicts of interest with respect to the research, authorship, and/or publication of this article.
Funding
The author(s) disclosed receipt of the following financial support for the research, authorship, and/or publication of this article: This work was supported by the Norrbacka-Eugenia Foundation; the Local Research and Development Board for Gothenburg and Södra Bohuslän; the Foundation of the Swedish National Stroke Association; the Swedish Research Council (VR 2011-2718); Promobilia; an unconditional grant from Allergan; Hjalmar Svensson’s Research Foundation; Greta and Einar Askers Foundation; Reneé Eanders Foundation; Rune and Ulla Amlövs Foundation; and John and Brit Wennerströms Foundation.