
Abstract
Background
Current approaches to characterizing deficits in upper limb movements after stroke typically focus either on changes in a functional measure, for example, how well a patient can complete a task, or changes in impairment, for example, isolated measurements of joint range of motion. However, there can be notable dissociations between static measures of impairment versus those of function.
Objective
We develop a method to measure upper limb joint angles during performance of a functional task and use measurements to characterize joint impairment in the context of a functional task.
Methods
We developed a sensorized glove that can precisely measure select finger, hand, and arm joints while participants complete a functional reach-to-grasp task involving manipulation of a sensorized object.
Results
We first characterized the accuracy and precision of the glove’s joint angle measurements. We then measured joint angles in neurologically intact participants (n = 4 participants, 8 limbs) to define the expected distribution of joint angle variation during task execution. These distributions were used to normalize finger, hand, and arm joint angles in stroke participants (n = 6) as they performed the task. We present a participant-specific visualization of functional joint angle variance which illustrated that stroke participants with nearly identical clinical scores exhibited unique patterns of joint angle variation.
Conclusions
Overall, measuring individual joint angles in the context of a functional task may inform whether changes in functional scores over recovery or rehabilitation are driven by changes in impairment or the development of compensatory strategies, and provide a quantified path toward personalized rehabilitative therapy.
Introduction
Stroke rehabilitation outcome measures can be broadly grouped into measures of impairment or measures of function.1,2 For example, functional clinical scales such as the Action Research Arm Test (ARAT) or the Wolf Motor Function Test measure how well a participant completes a complex upper limb task. Improvements in such functional scales may be due to changes in limb impairment or due to the development of compensatory strategies, making it difficult to use functional scales to study the neural underpinnings of recovery or rehabilitation following brain injury or stroke. Many have proposed measuring kinematics of the upper limb during functional tasks to objectively characterize changes in limb control over time.3,4 A particular focus has been on calculating movement smoothness, speed, and efficiency of the limb’s endpoint for reaching and reach-to-grasp movements. 1 However, this type of analysis collapses the high-dimensional hand and arm kinematics into a single endpoint that is similarly susceptible to influence from both behavioral recovery and compensation.
In this pilot study, we aimed to characterize joint angle variance in participants with stroke during the performance of a functional task. Video-based approaches are becoming increasingly common for tracking kinematics, 5 however, along with other optical approaches, they suffer when a direct line of sight of the tracked limb is occluded, as is common during hand manipulation and object-interaction tasks. To overcome this, we developed a glove containing very precise electromagnetic orientation sensors similar to previous approaches used in animals. 6 We first characterized the precision and accuracy of the sensors in measuring select joint angles of the fingers, hand, and arm, and then measured joint angles of neurologically intact and stroke participants as they completed multiple trials of a functional reach-to-grasp task (Figure 1).
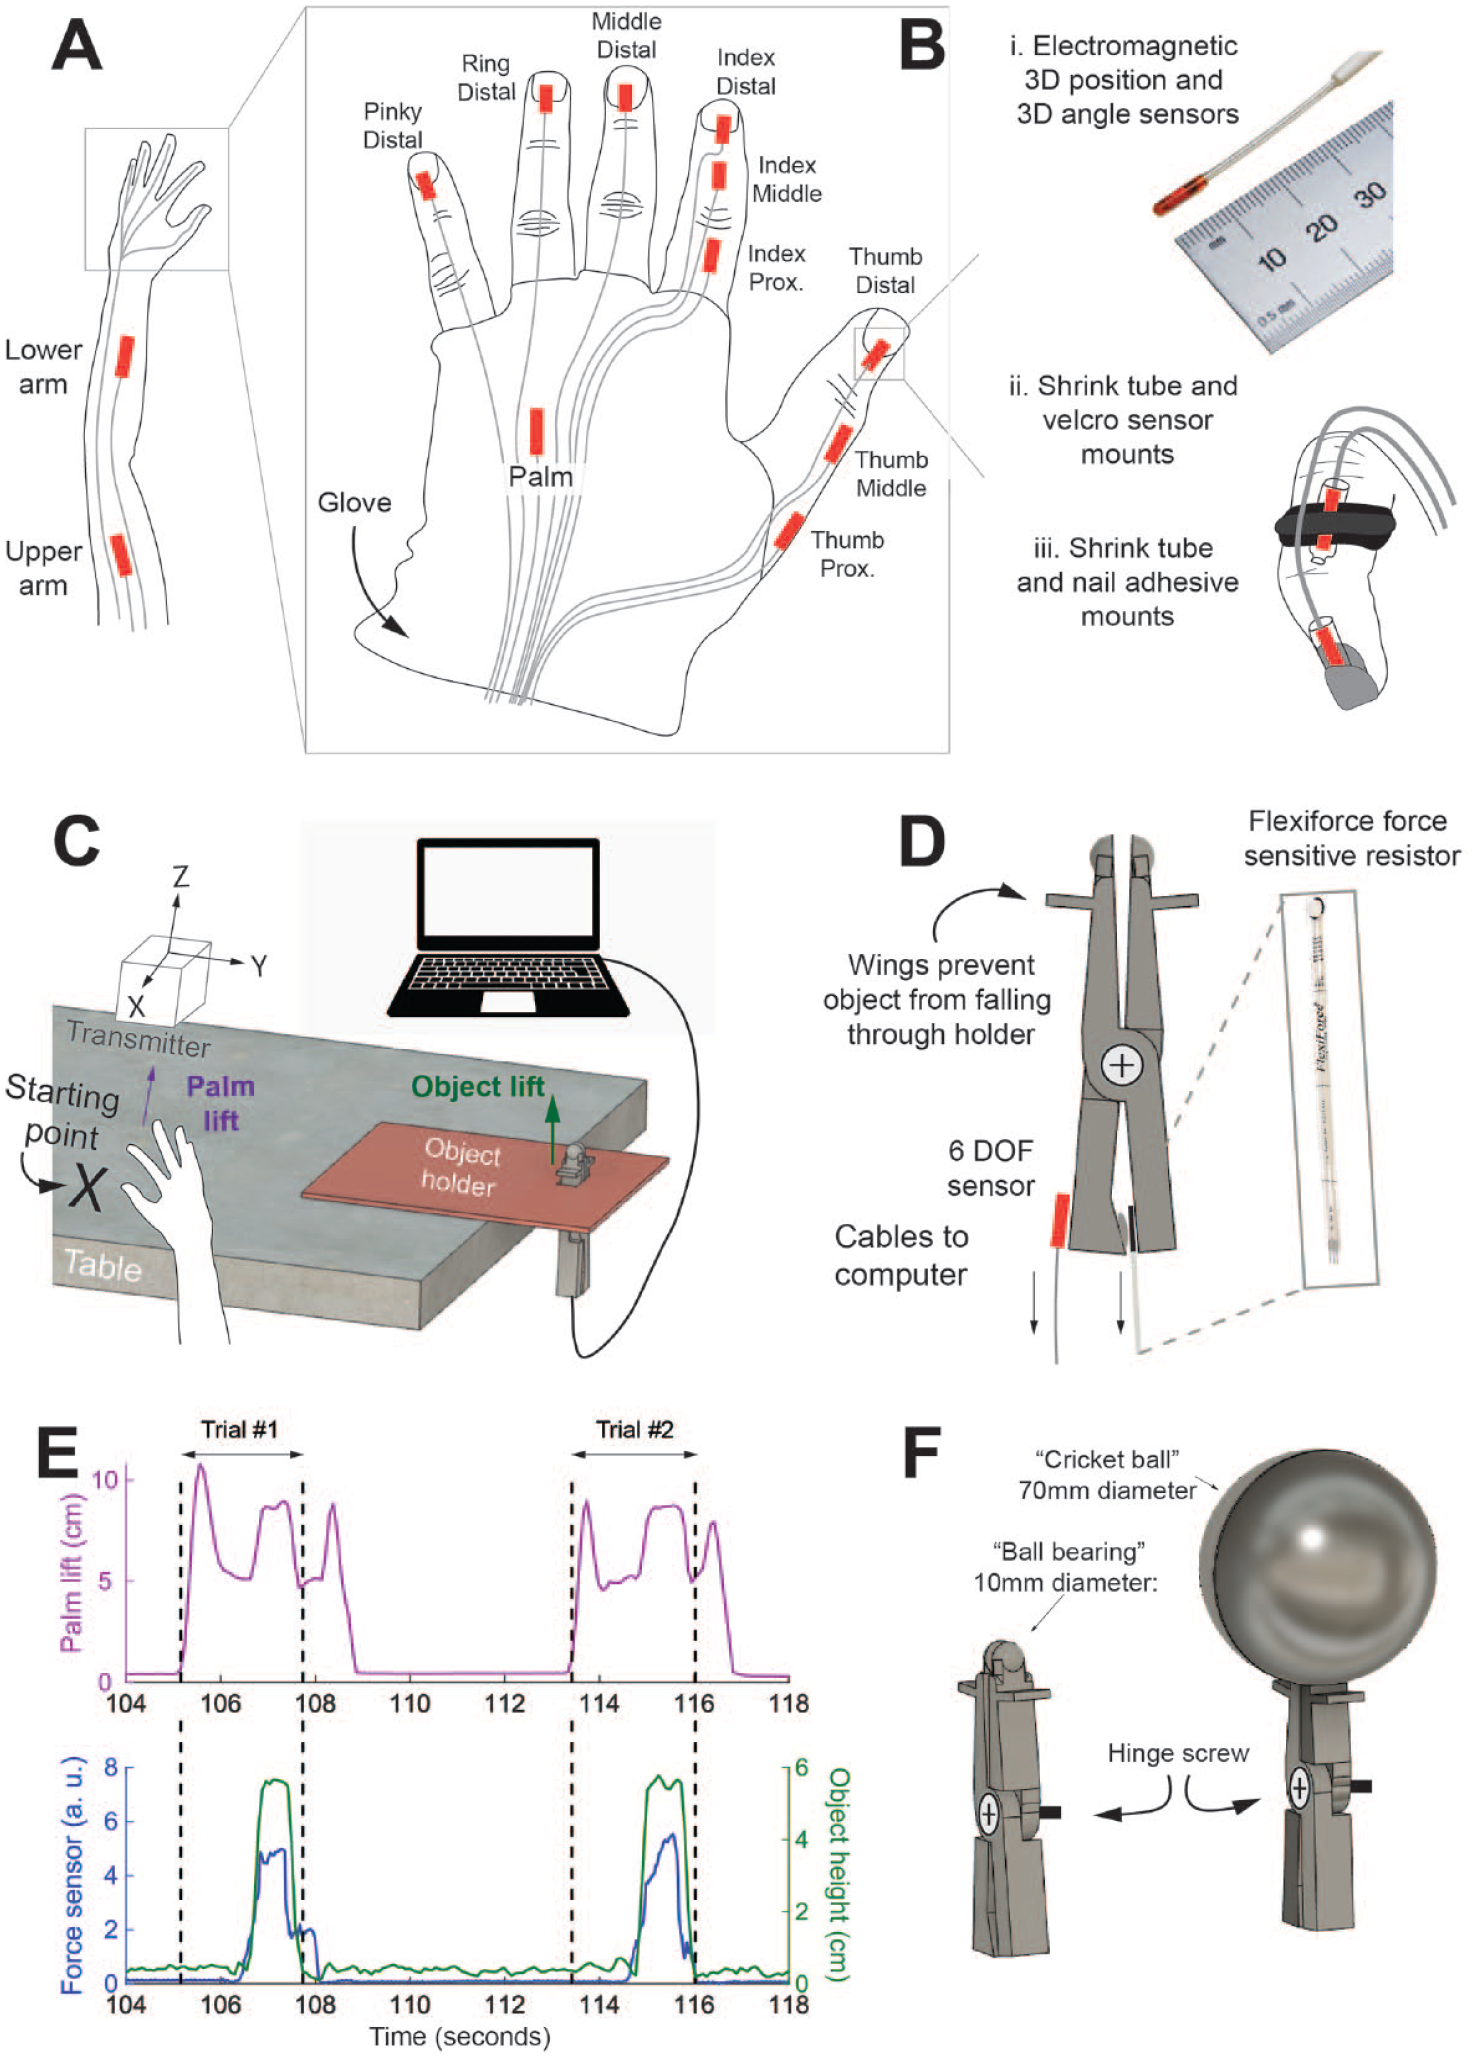
Sensorized glove used to track arm and hand joint angle kinematics during a functional reach-to-grasp task. (A) Twelve electromagnetic 6 degree-of-freedom sensors used to track upper limb and hand kinematics. (B) i) Sensors are Model 180 sensors from Northern Digital Inc. (NDI) and track 3 degree-of-freedom position and 3 degree-of-freedom angular orientation. ii) Sensors are attached to the middle and proximal phalanges using custom-made velcro and plastic shrink tube mounts iii) Sensors are attached to the distal phalange using nail adhesive and shrink tubing. (C) Sensorized object setup includes sensor transmitter, object holder that overhangs a table, object device suspended in the holder allowing sensor cables to reach microcontroller or computer. (D) Mechanical properties of the object include wings to prevent the object from falling through the holder and sensors attached to object base. Pieces of the object are held together by a hinge screw, allowing for grasping forces applied to the object to be transmitted to the force sensitive resistor at the bottom of the device. The device also has an NDI sensor attached at the base to track object position. (E) Raw sensor data from a representative reach-to-grasp trial. Top, purple trace measures movement of hand lifting off the table (axis pictured in C as purple arrow). Bottom, green trace measures height of object (axis in C as green arrow). Blue trace measures pinch force in arbitrary units. Horizontal black arrows indicate segments used for data analysis (start of reach to immediately after object is replaced to initial height). (F) A 3D CAD model of the object used in the study (left) and another design for the object that could be used to assess function in more impaired stroke participants (right). Designs are made to reflect the ball bearing or cricket ball from the ARAT, respectively.
We developed individualized visualizations of arm and hand joint angle variance during performance of the functional task (Figures 2 and 3). Overall, we propose that our kinematics-monitoring approach and joint angle variance visualization might be used to monitor changes in joint control during functional tasks over recovery or rehabilitation.
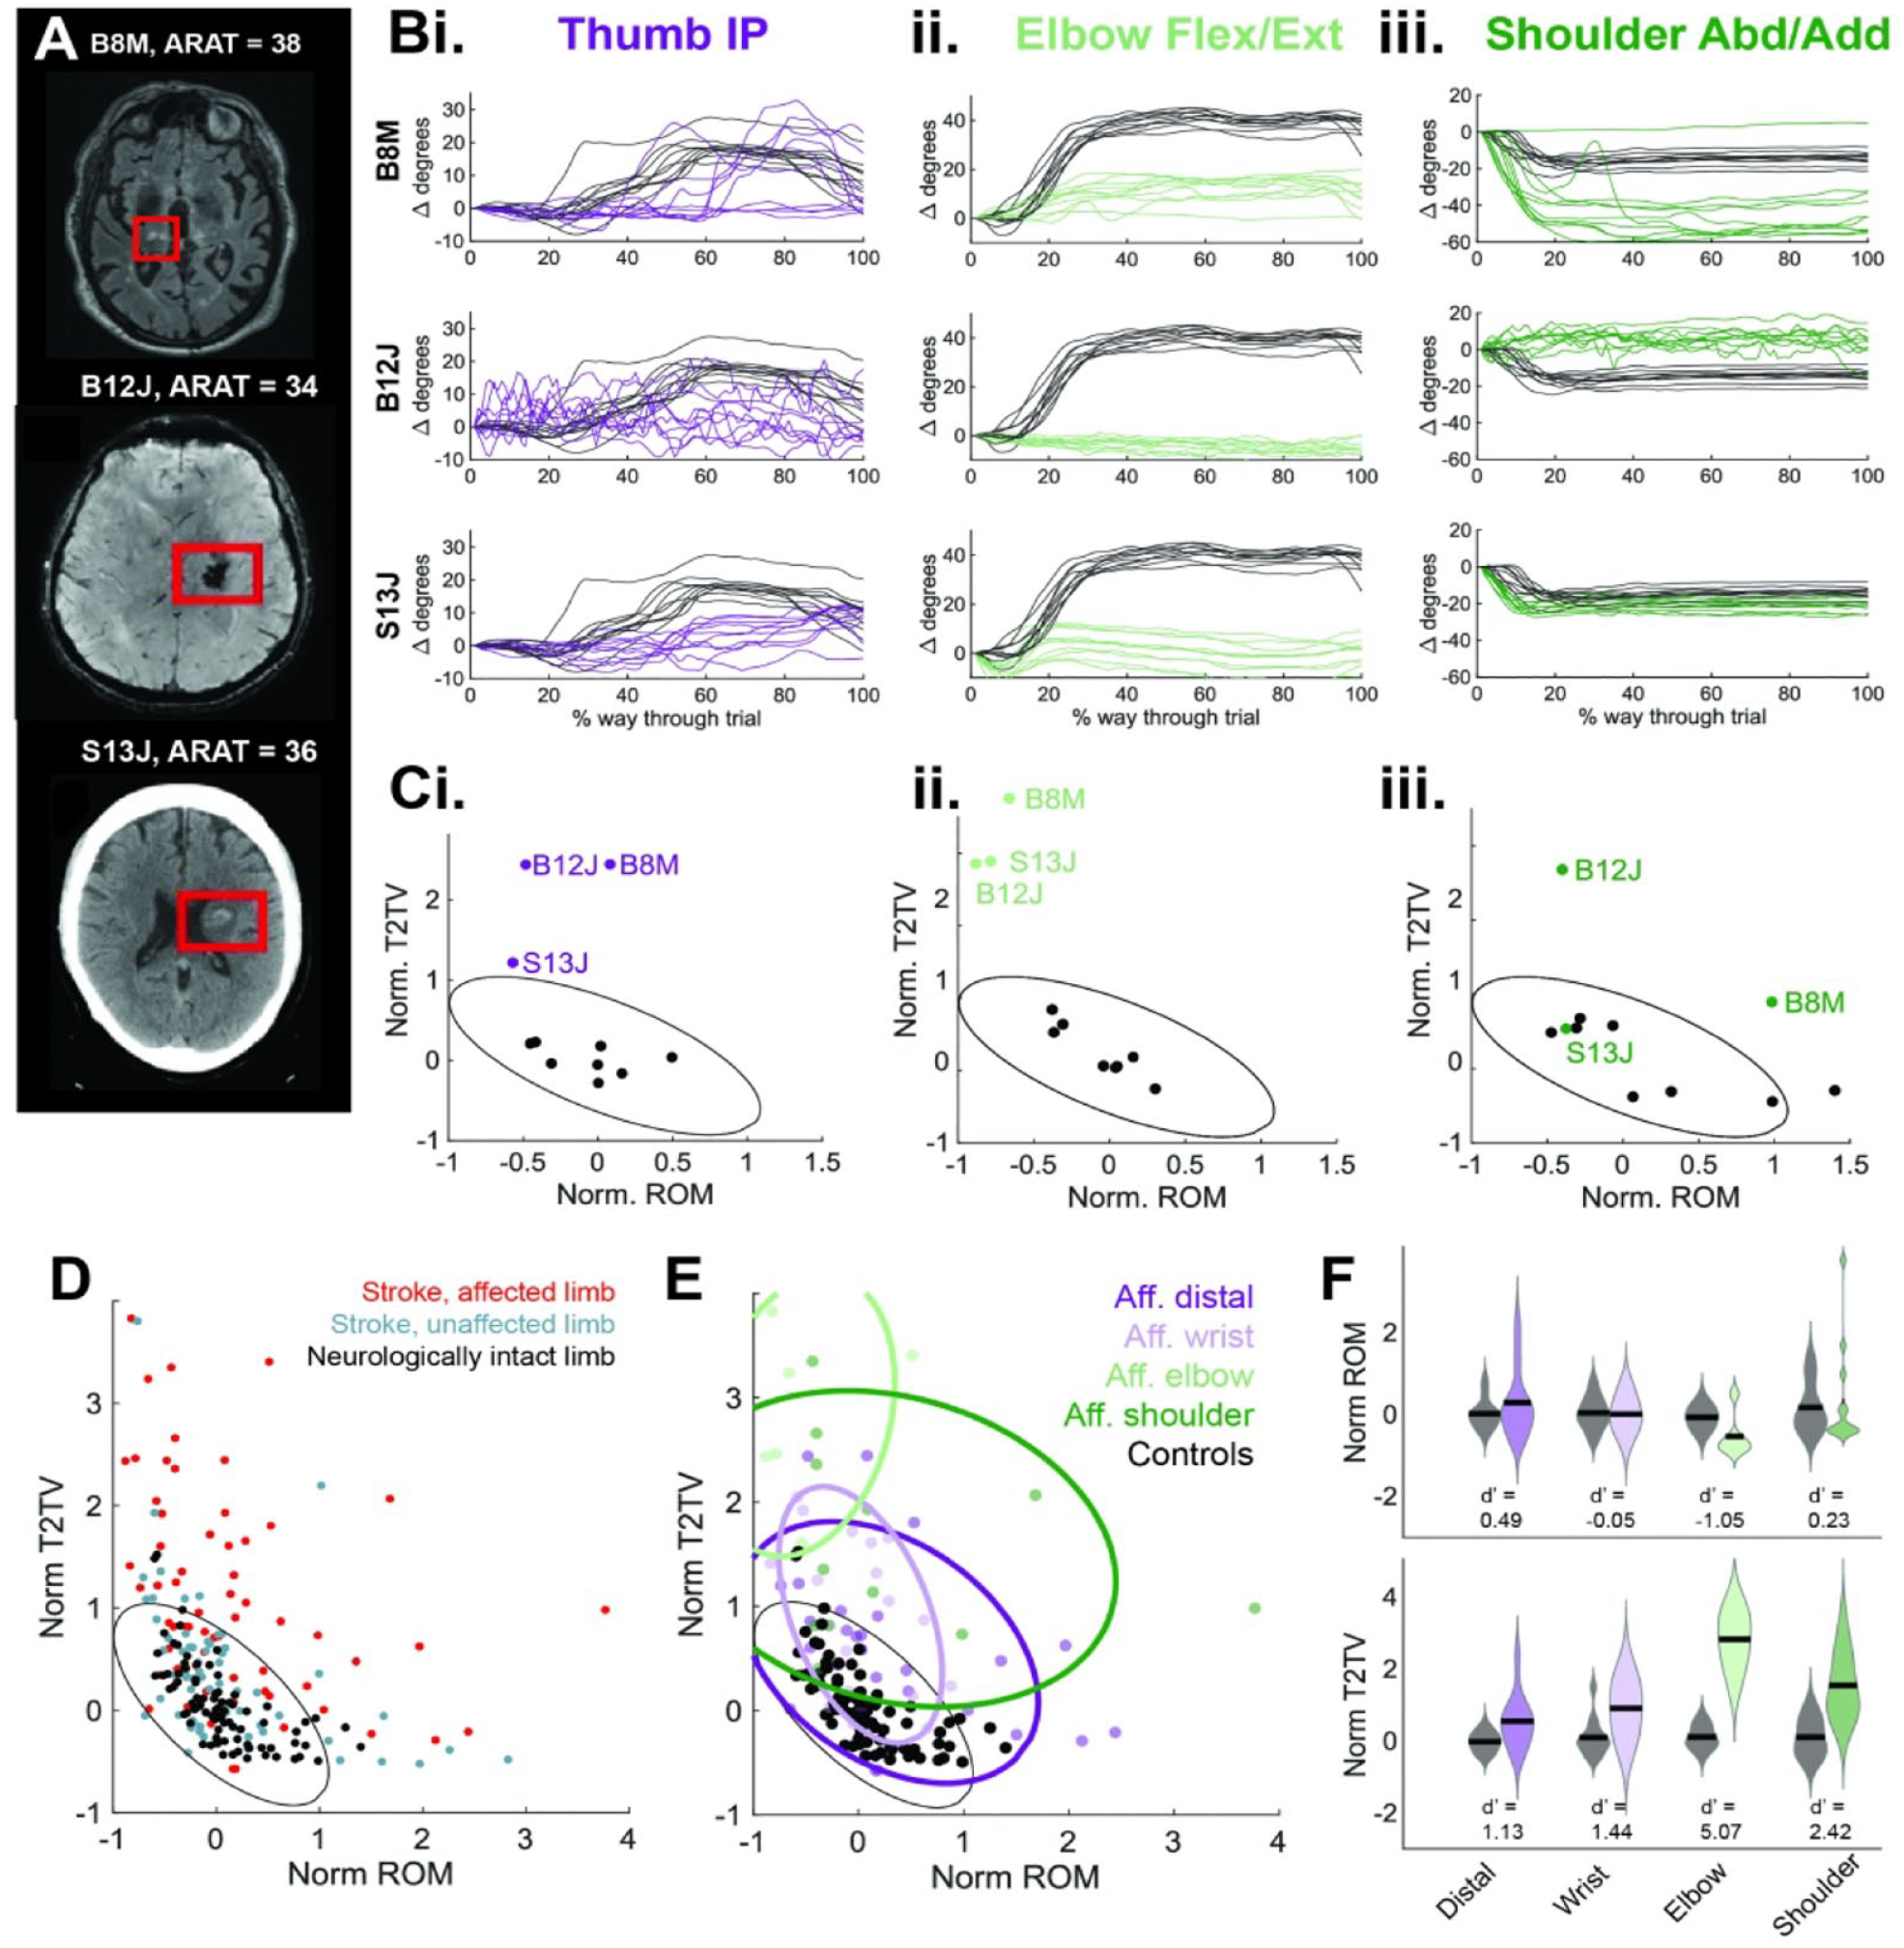
Measured joint angle variance across stroke participants. (A) Top: T2 FLAIR MRI showing right hemisphere subcortical stroke for participant B8M (left upper limb affected), middle: SWAN image showing left hemisphere subcortical stroke for participant B12J (right upper limb affected), and bottom: CT image showing left hemisphere subcortical stroke/hemorrhage for participant S13J (right upper limb affected). In all images, the right side of the image corresponds to the participant’s left hemisphere. (Bi-iii): affected limb joint angle trajectories from ten trials for (i) thumb IP in purple, (ii) Elbow Flex/Ext in light green, and (iii) shoulder Abd/Add in dark green. A representative neurologically intact participant’s joint angles illustrated in black. To highlight changes in joint angle, all trajectories are translated to start at 0°. (C) Normalized ROM versus normalized T2TV illustrated for (i) thumb IP, (ii) elbow Flex/Ext, and (iii) shoulder Abd/Add. Black dots are from neurologically intact participants (n = 8 limbs), color dots are from affected stroke participant limbs illustrated in (A), and ellipse is calculated as 95th percentile of data distribution from all normalized ROM and normalized T2TV (as in (D)). (D) Distribution of all joint angles from neurologically intact participants (black), unaffected limb of stroke participants (blue), and affected limb of stroke participants (red). Black ellipse is 95th percentile of neurologically intact data. (E). Distribution of all joint angles from neurologically intact participants (black) and affected limb of stroke participants (colored by joint category). Black ellipse is 95th percentile of neurologically intact data, colored ellipses are 75th percentile of joint category data from the affected limb of stroke participants. (F) Distribution of normalized ROM (top) and normalized T2TV (bottom) in affected limb of stroke participants (colored distributions) and neurologically intact participants (gray distributions) divided into joint categories. d′ metric is reported below each pair of distributions.
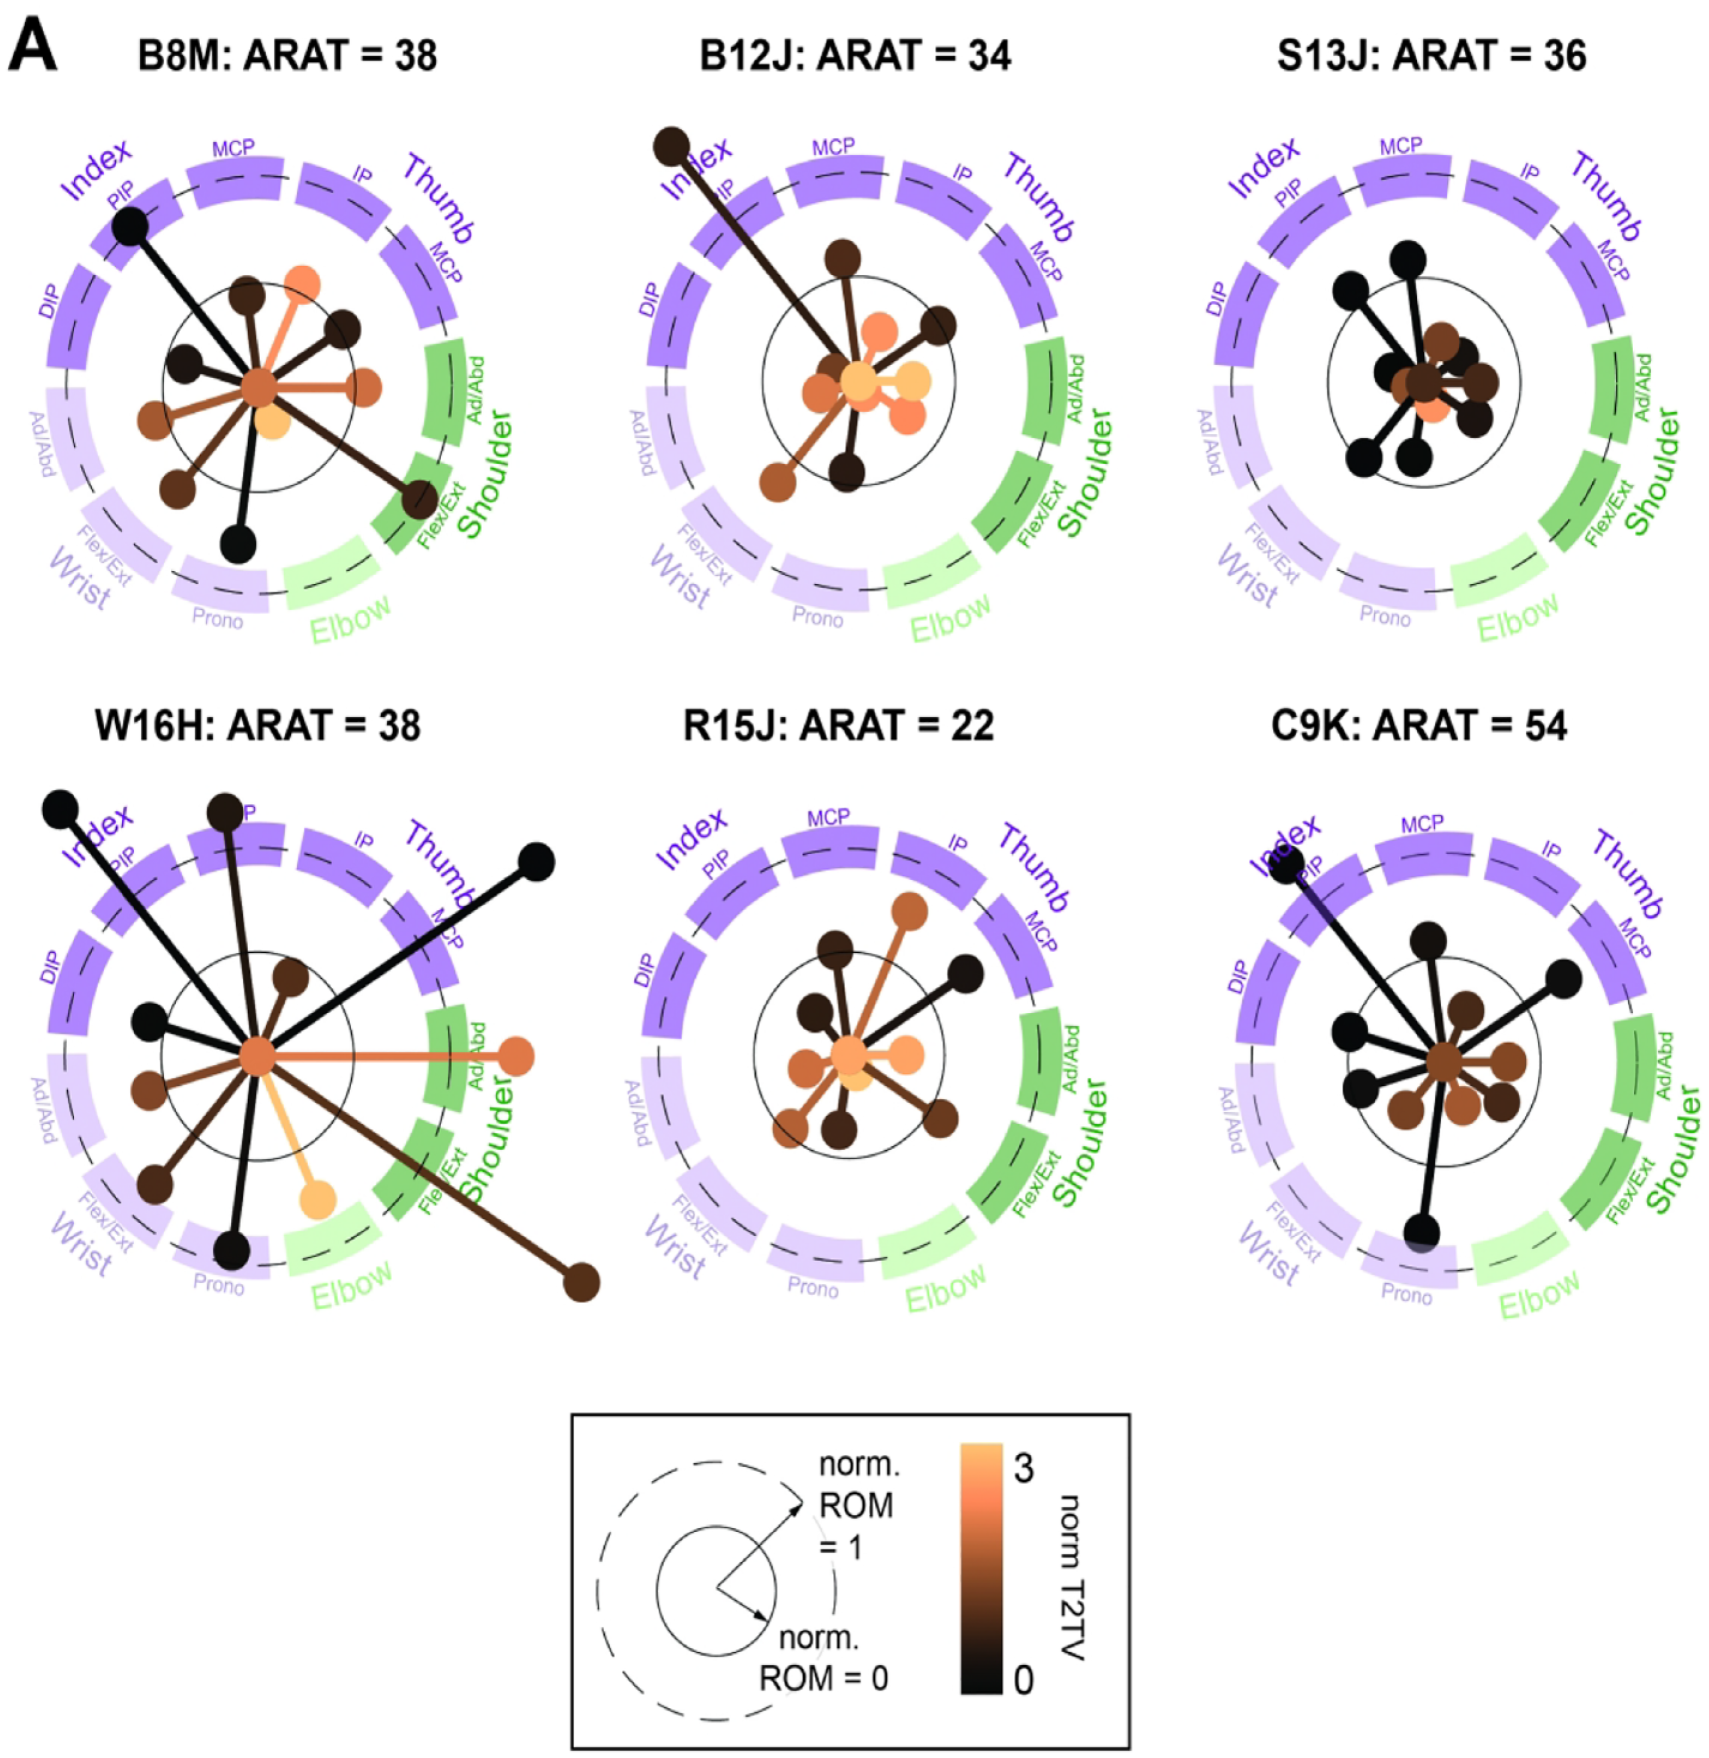
Visualizing stroke participant joint angle variability during a functional task. (A) Individual joints are represented by an individual line and marker. Distal, wrist, elbow, and shoulder joints are grouped (illustrated by dark purple, light purple, light green, and dark green arcs). Individual joint lines reflect normalized ROM (longer line corresponds to larger normalized ROM). Specifically, a line length that reaches the inner plotted circle (solid line) corresponds to a norm ROM of 0, or a value matching the neurologically intact participant median. A longer line length that reaches the dashed outer circle corresponds to an ROM of 1. Line color reflects T2TV. More copper color corresponds to high T2TV. We note that participant C9K has the highest ARAT score (54), and exhibits joint angle variation values with lower norm T2TV (dark colors) and norm ROM mostly close to 0.
Methods
Clinical Evaluation
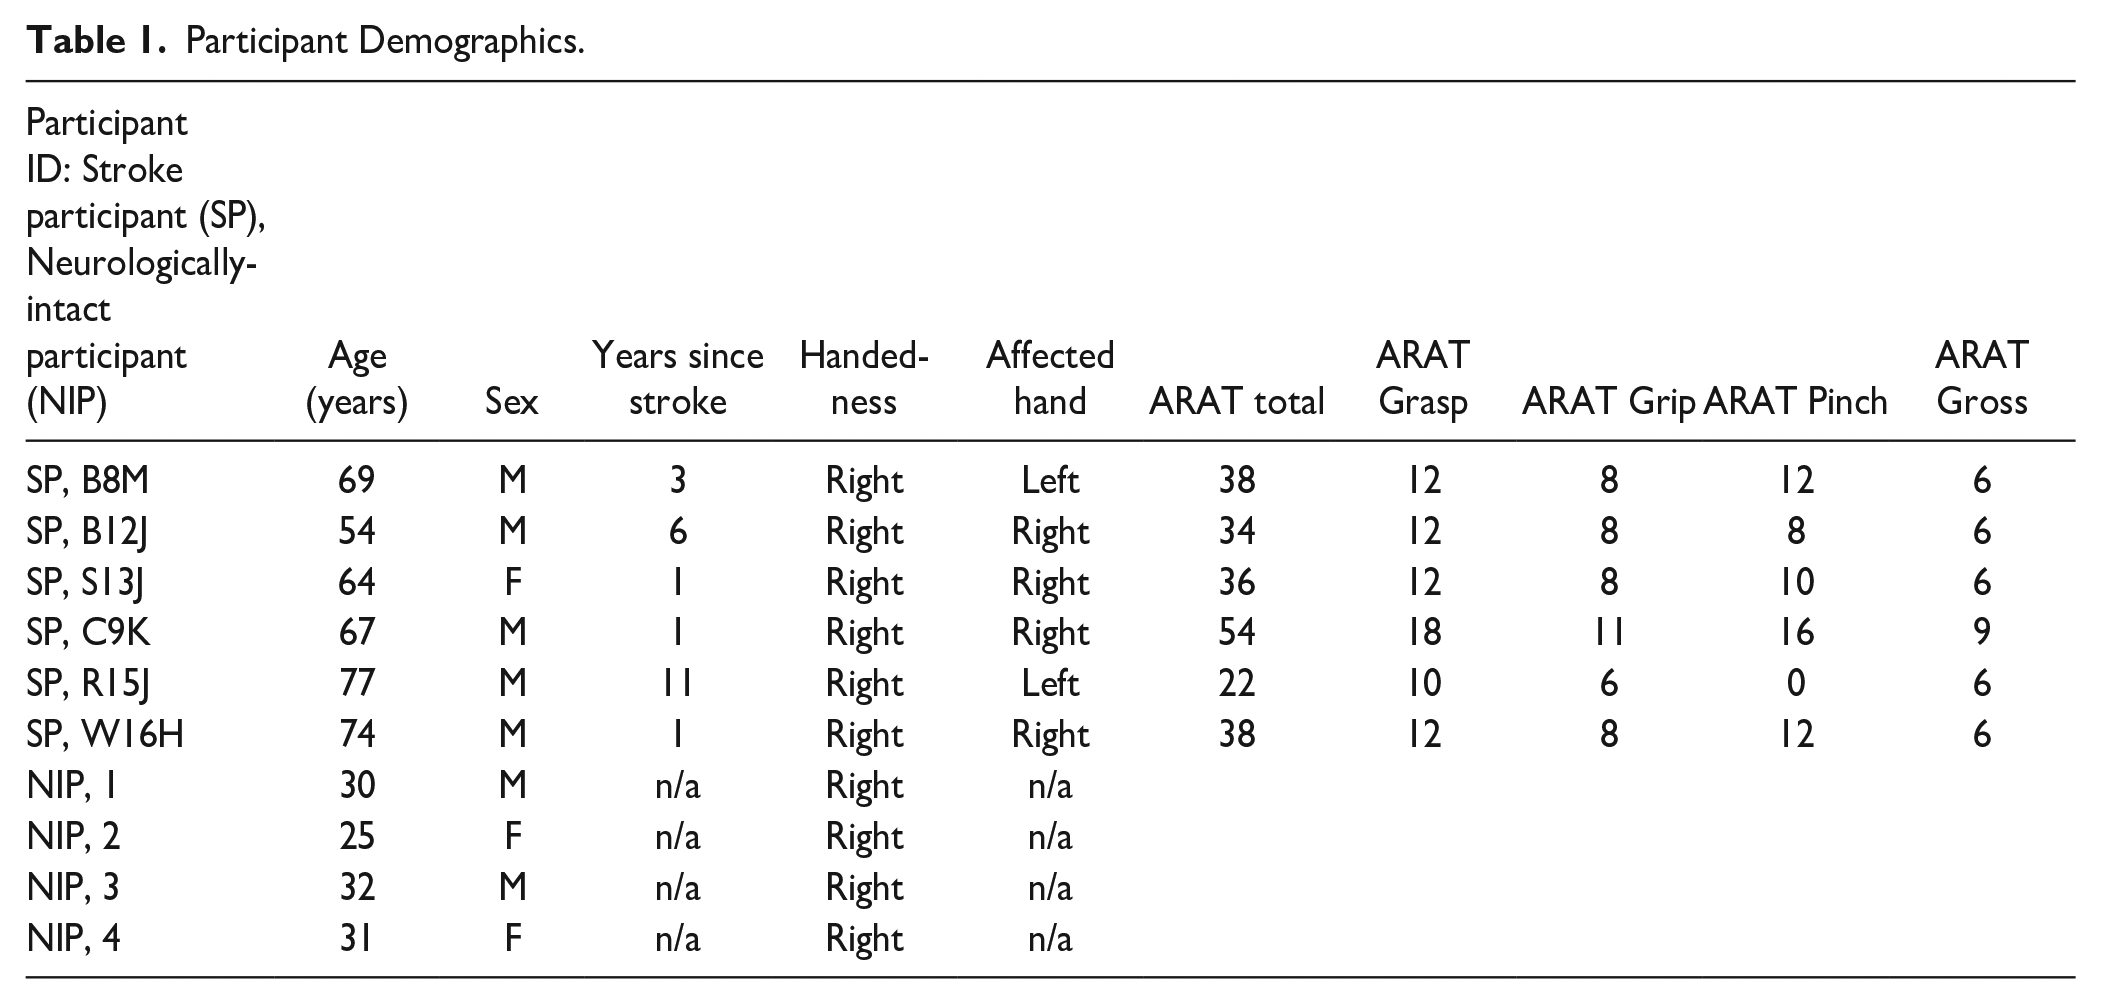
This research was conducted in accordance with and approval of the University of California San Francisco Institutional Review Board (IRB). All research participants provided informed consent to participate in the study. Participants with prior stroke were recruited as part of a stroke rehabilitation study (https://clinicaltrials.gov/ct2/show/NCT03148106). Stroke participants (n = 6, mean age = 67.5 years old) completed the sensorized object task with the sensorized glove on an initial familiarization day or on an intervention day. Neurologically intact participants (n = 4, mean age = 29.5 years old) were recruited as part of a separate research study (UCSF IRB number: 16-19737).
Stroke Participant Inclusion/Exclusion Criteria
Inclusion criteria: Participants between 18 and 80 years old, history of an acquired brain injury resulting in residual hemiparesis or other motor deficits of the arm/hand equal to or more than 6 months prior to enrollment; capacity to adhere with the schedule determined in the protocol. Exclusion criteria: currently pregnant; uncontrolled medical conditions; significant cognitive impairment on the Montreal Cognitive Assessment (MoCA ≤23); ≤10° of active index finger range of motion assessed at the MCP; significant hand joint deformity (clinically includes osteoarthritis and rheumatoid arthritis as potential causes); severe active alcohol or drug abuse; significant depression (PHQ-9 ≥ 15); baseline spasticity score (MAS) >3 for any joint tested (wrist and metacarpophalangeal joint flexion and extension); apraxia screen of Tulia (AST) <5; absent light touch, proprioception, pinprick, and vibration sensation on the modified Nottingham Sensory Assessment (NSA); no upper limb strength against gravity; severe aphasia; an implanted pacemaker.
Sensorized Glove and Armbands
Twelve electromagnetic sensors (Model 180, Northern Digital), capable of measuring 6 degrees of freedom (3D position and 3D orientation), were placed on participants as they conducted a functional reach-to-grasp task (Figure 1A). Sensors were attached either directly to the skin (distal phalange), attached with armbands (lower and upper arm sensors), or embedded in a wearable glove (all other sensors). Glove design was inspired by a previous study. 6 Sensors were attached to the glove using custom-made velcro and plastic shrink tube mounts. Importantly, the glove and armbands enabled almost all sensors (except those on the distal phalanx) to be “pre-loaded” and “pre-routed” through their respective glove cable management systems to improve time efficiency with participants. The glove also provided strain relief for the cables that was critical to ensuring that the sensors did not shift with respect to the hand/arm while participants were completing the functional task. Sensors were attached to the distal phalange using nail adhesive and shrink tubing (Figure 1B). In 1 stroke participant (R15J), the distal phalange sensor on the index finger was scraped against the table and sensorized object holder multiple times during task execution, displacing the sensor. We therefore did not use data from this sensor (and hence did not calculate index DIP bend angle) for this participant’s affected limb.
Sensorized Object Task
A custom 3D-printed object was designed and embedded with a force-sensitive resistor and electromagnetic sensor (Northern Digital; Figure 1C-D; see supplemental Methods).
Conversion From Sensor Angles to Joint Angles
Sensor data was converted to joint angle data. Joints computed were the thumb metacarpophalangeal (MCP), thumb interphalangeal (IP), index finger distal interphalangeal (DIP), index finger proximal interphalangeal (PIP), index MCP, wrist flexion/extension, wrist abduction/adduction, forearm pronation/supination, elbow flexion/extension, shoulder flexion/extension, and shoulder abduction/adduction. See Supplemental Methods for calculations.
Characterization of Joint Angle Accuracy and Precision
To validate joint angle measurements calculated from the glove sensors, 4 neurologically intact participants donned the sensorized glove on their left and right hands and moved their joint angles to pre-defined bend angles (verified using a goniometer). Data was used to estimate accuracy and precision (Supplemental Figure S1).
Analysis of Joint Angles During Reach-to-Grasp Task
Trial Segmentation and Alignment
Stroke and neurologically intact participants were instructed to perform a lateral reach toward the object, grasp and lift the object, place the object down, and then return their hand to the starting location (Figure 1C). Ten trials in a row were completed. All participants (stroke and neurologically intact) performed 10 trials of the task with 1 hand and then 10 trials with their other hand.
Data from the 10 performed trials were segmented from when the palm position sensor registered a vertical movement of the hand moving off the table, “trial start,” to when the object reached back down to its initial height after being lifted to its maximum height, “trial end” (Figure 1E, supp. Methods). Trials were resampled to be 100 samples.
Normalized ROM and T2TV
Two metrics of joint angle variance were calculated for each joint on each trial: range of motion (ROM) and trial-to-trial variability (T2TV). ROM was defined as the standard deviation of the joint angle time series for a given trial and T2TV was defined as mean-squared error between joint angle timeseries for a given trial and the median joint angle timeseries computed over all 10 trials. Each joint angle’s median ROM and median T2TV over trials was selected and then normalized by the median ROM or T2TV over all neurologically intact participants limbs for that joint angle yielding “norm T2TV” and “norm ROM” values for each limb’s joint angle (Supplemental Figure S2A-B).
d′ Metric of Separability
The d-prime (d′) is a metric reflecting separability between 2 distributions of data (Supplemental Methods).
Results
We first characterized the accuracy and precision of the 11 finger, hand, and arm joint angles that were calculated from the sensors on the glove. Neurologically intact participants (n = 4, mean age = 29.5 years old) donned the glove and moved each of their joints to specified bend angles (verified by a goniometer) 3 times per session to measure accuracy and precision of the glove system. Due to the sensorization scheme, some joint angles only measured relative changes in joint angle (specifically forearm sup/prono, shoulder flex/ext, and shoulder abd/add), not absolute joint angle. Thus, we characterized the accuracy of joint angle changes. We note that the metrics of T2TV and ROM used to characterize joint angle variance during the functional task do not depend on measurement of exact joint angle, just accurate and reliable measurements of changes in joint angle. The root mean square error (RMS) in estimating changes in joint angle (accuracy) was 6.91°, (averaged across joints, see Figure S1B for individual joint values). The RMS of within-session repeated measurements (within-session precision) was 3.43° (averaged across joints, see Figure S1C for individual joint values). The across session RMS of repeated measurements (across-session precision) was 5.15° (averaged across joints, see Figure S1C for individual joint values).
We next characterized stroke participant joint angle trajectories during performance of a functional task. See Table 1 for stroke participant demographics (n = 6, mean age = 67.5 years old). We initially focused on 3 stroke participants all with ARAT scores in the 30’s. Neural imaging illustrates the stroke participant lesions (Figure 2A). Examples of stroke participant finger, elbow, and shoulder joint angle kinematics (colored traces) are compared to representative neurologically intact participant kinematics (black traces) during the reach-to-grasp task (Figure 2B).
Participant Demographics.
To better visualize the norm ROM and norm T2TV, we plot these 2 metrics in a 2D state space (Supplemental Figure S2C). We note there is error in the calculated norm T2TV and norm ROM metrics introduced by using the glove’s imperfect accuracy and precision to measure joint angles. Specifically, the average 95% confidence interval of a specific norm ROM value is [−0.28, 0.70], and a specific norm T2TV value is [−0.27, 0.27] (Supplemental Figure S4).
The black ellipse in Figure 2C illustrates the 95th percentile of the distribution of neurologically intact participants’ joint angles and constitutes an estimate of the boundary between joint angles with neurologically typical versus atypical ROM and T2TV. See Table 1 for neurologically typical participant demographics (n = 4, mean age = 29.5 years old).
The stroke participants in Figure 2A-C exhibit different patterns of joint angle impairment despite having similar ARAT scores. For the thumb IP joint angle, all participants exhibit atypically high T2TV, though B12J and B8M more than S13J (Figure 2Ci). For elbow flex/ext., all 3 participants exhibit atypically high T2TV and low ROM (Figure 2Cii). Finally for shoulder abd/add., participant B8M exhibits atypically high ROM and T2TV, whereas B12J again exhibits high T2TV. Despite these participants having similar ARAT scores, they have quite different patterns of hand and arm joint angle variance across their upper limb.
Throughout the stroke participant group, many joint angles from the affected limb fall outside the ellipse and are characterized as “atypical” (39/65) whereas less than half of that number of joint angles from the unaffected limb are characterized as “atypical” (18/66), (Figure 2D).
When categorizing stroke participant joint angles in norm ROM versus norm T2TV state space by joint group (ie, “distal”—thumb and index joint angles, “wrist”—wrist and forearm joint angles, “elbow”—elbow flex/ext joint angle, and “shoulder”—shoulder joint angles; Supplemental Figure S1A), we find differences between stroke versus neurologically intact participants. We do not present statistics due to our small sample size, however we do report a d-prime (d′) metric reflecting the separability between the stroke and neurologically intact participant distributions. Distributions are composed of norm ROM and norm T2TV datapoints shown in Figure 2D pooled over participants and joints within each joint group. Notably, the d′ of the elbow norm ROM exhibits a d′ of less than −1 indicating the stroke participant distribution has a lower norm ROM that is well separated from the neurologically intact participant distribution. In addition, all joint categories have norm T2TV d′ values >1 indicating stroke participant distributions have higher, well separated, norm T2TV than neurologically intact participant distributions (Figure 2EF).
Our main observation is that stroke participants exhibit unique patterns of joint angle variation that are revealed with our sensorized glove (Figure 3A, Supplemental Figure S3). We visualize participant-specific maps of joint angle variation by plotting a line and marker for each joint angle such that the length of the line corresponds to the norm ROM, and the color of the line corresponds to norm T2TV. Of the 6 stroke participants, we note that the 4 with ARAT scores in the 30’s highlight the very different types of hand, wrist, elbow, and shoulder joint control (Figure 3, Supplemental Figure S3). These differences in joint control are not reflected in these participants’ nearly identical ARAT scores and sub-scores (Table 1).
Discussion
We present a glove sensorized with electromagnetic sensors designed to capture joint angle kinematics during functional tasks. This measurement approach does not suffer from sensor occlusion that is problematic with the use of optical approaches when monitoring kinematics during object manipulation tasks. 5 Therefore, we were able to analyze kinematic data during object contact and manipulation phases of the task, not just during pre-shaping prior to object contact. 7 Further, sensors on the hand and object also helped us to segment trials in a high degree-of-freedom, unstructured task by detecting movement onset, manipulation onset, and manipulation offset.
We validated the ability of the glove to measure joint angle differences accurately and precisely, with RMS values comparable to other data gloves presented in the literature,8,9 though exact comparison is difficult since different studies use different systems for validation (eg, goniometer vs optical Vicon systems). The accuracy error we report largely comes from hysteresis that prevents the glove’s measured joint angles from accurately measuring angles at the extremes of the range of motion (Supplemental Figure S1B). This is likely due to stiff sensor wires that impede bending through the full range of motion. Future iterations of this glove system could utilize more flexible wiring, improved wiring strain relief, or even wireless sensors to improve bend angle accuracy. Future systems could also incorporate further calibration procedures to account for slight variations in how sensors are placed on the hand (Supplemental Figure S5). Finally, skeletal measurements and biomechanical modeling could also be used to denoise joint angle measurements and better estimate the state of the hand. 10
We then use the glove to capture stroke and neurologically intact participant joint angle kinematics during a functional task. Notably, we characterized joint angle-specific variance during a functional task. We used 2 measures of joint angle variability during the task (ROM and T2TV). The main observation we find is that participants with similar functional clinical ARAT scores exhibited different patterns of joint angle variation. We note that future work could collect a large database of neurologically intact participants spanning different ages, which would enable better modeling of typical joint angle variation during functional tasks and would improve assessments of “typical” and “atypical” joint angle variation in stroke participants.
This approach of developing an individualized map of joint angle variation during a functional task could be used to quantify improvements in joint angle extent (increases in ROM), consistency (reductions in T2TV), while also measuring the development of compensatory movements (higher than expected ROM), 11 a key goal of measuring kinematics1,4 and a challenge in the analysis of functional clinical scores. 2 These measurements could also be used to quantify the development of abnormal movement synergies over the course of recovery,12 -14 and to analyze changes in fine motor control involving object interactions 15 by comparing the object’s pinch force sensor with hand kinematics. 16 Measurements in a large group of recovering stroke participants could also reveal distinct patterns of joint recovery following stroke, 17 potentially enabling stratification of participants into different classes for rehabilitation.
Overall, this study reveals personalized patterns of joint angle variation during a functional task, revealed by tracking joint angle kinematics. This approach offers a way forward to assess changes in joint angle impairment and compensation during functional tasks and may allow for better understanding of the neural underpinnings of changes in limb control following brain injury or stroke. Further, this analysis framework can also be implemented in preclinical animal studies of rehabilitation. 18 This would enable a common framework for assessing how new interventions change behavior, thereby improving the robustness of translational approaches. 19
Supplemental Material
sj-docx-1-nnr-10.1177_15459683231179173 – Supplemental material for Measuring Arm and Hand Joint Kinematics to Estimate Impairment During a Functional Reach and Grasp Task after Stroke
Supplemental material, sj-docx-1-nnr-10.1177_15459683231179173 for Measuring Arm and Hand Joint Kinematics to Estimate Impairment During a Functional Reach and Grasp Task after Stroke by Preeya Khanna, Tomas Oppenheim, Adelyn Tu-Chan, Gary Abrams and Karunesh Ganguly in Neurorehabilitation and Neural Repair
Footnotes
Acknowledgements
We also thank Jaskanwaljeet Kaur and Dawnia Brody for assistance with data collection and Jenny Trieu for assistance in glove development.
Declaration of Conflicting Interests
The author(s) declared no potential conflicts of interest with respect to the research, authorship, and/or publication of this article.
Funding
The author(s) disclosed receipt of the following financial support for the research, authorship, and/or publication of this article: Research reported in this publication was supported by the National Institute of Mental Health of the National Institutes of Health under Award Number R01MH111871 (Brain Initiative) and the Weill Institute for Neuroscience at UCSF.
Supplementary material for this article is available on the Neurorehabilitation & Neural Repair website along with the online version of this article.
References
Supplementary Material
Please find the following supplemental material available below.
For Open Access articles published under a Creative Commons License, all supplemental material carries the same license as the article it is associated with.
For non-Open Access articles published, all supplemental material carries a non-exclusive license, and permission requests for re-use of supplemental material or any part of supplemental material shall be sent directly to the copyright owner as specified in the copyright notice associated with the article.