
Abstract
Background. Vision Restoration Therapy (VRT) aims to improve visual field function by systematically training regions of residual vision associated with the activity of suboptimal firing neurons within the occipital cortex. Transcranial direct current stimulation (tDCS) has been shown to modulate cortical excitability. Objective. Assess the possible efficacy of tDCS combined with VRT. Methods. The authors conducted a randomized, double-blind, demonstration-of-concept pilot study where participants were assigned to either VRT and tDCS or VRT and sham. The anode was placed over the occipital pole to target both affected and unaffected lobes. One hour training sessions were carried out 3 times per week for 3 months in a laboratory. Outcome measures included objective and subjective changes in visual field, recording of visual fixation performance, and vision-related activities of daily living (ADLs) and quality of life (QOL). Results. Although 12 participants were enrolled, only 8 could be analyzed. The VRT and tDCS group demonstrated significantly greater expansion in visual field and improvement on ADLs compared with the VRT and sham group. Contrary to expectations, subjective perception of visual field change was greater in the VRT and sham group. QOL did not change for either group. The observed changes in visual field were unrelated to compensatory eye movements, as shown with fixation monitoring. Conclusions. The combination of occipital cortical tDCS with visual field rehabilitation appears to enhance visual functional outcomes compared with visual rehabilitation alone. TDCS may enhance inherent mechanisms of plasticity associated with training.
Keywords
Introduction
Noninvasive cortical stimulation techniques such as transcranial direct current stimulation (tDCS) are increasingly gaining use in neurorehabilitation. By modulating cortical excitability, tDCS can potentially “steer” the activity of surviving neural networks to enhance inherent neuroplastic mechanisms associated with functional recovery.1-3
Studies in stroke motor rehabilitation suggest that combining motor cortical stimulation with rehabilitative training may augment recovery compared with movement rehabilitation alone.4-6 It remains unknown, however, if visual cortical tDCS may improve functional outcomes and alter cortical adaptations in unilateral visual field loss with hemianopia. 7 Limited therapeutic options exist, 8 and investigators have developed computer-based approaches for visual rehabilitative training.9-13 One approach, called Vision Restoration Therapy (VRT; Novavision Inc, Boca Raton, Florida), trains individuals to detect repeated flashing light stimuli presented within an area of residual vision bordering the blind and the intact visual fields.9,10 This region, referred to as the “transition zone,” has been functionally characterized as an area of suboptimal visual perception and physiologically purported to correspond to partially surviving neurons associated with damaged visual areas.14,15 Preliminary evidence suggests that systematic training of the transition zone with VRT may lead to synaptic and network-level changes within surviving perilesional and associated intact visual areas that ultimately manifest as improved visual function.10,16,17 Indeed, a series of studies have shown that VRT training (typically lasting 6 months; 2 half-hour sessions twice a day, 6 days a week) leads to an expansion of the visual field border by an average of 5°.9,18
Analogous to reports regarding stroke motor rehabilitation, we hypothesized that tDCS (specifically, anodal tDCS to upregulate cortical excitability19,20), delivered to intact and surviving ipsilesional occipital cortices, concurrent with VRT would enhance visual rehabilitative outcomes compared with VRT alone. To pursue this question, we conducted a stage-2 development-of-concept, 21 randomized controlled, double-blind pilot trial.
Methods
Participants
Patients with unilateral postchiasmal visual field loss following stroke or brain damage, who were in the chronic phase of recovery (>3 months postlesion) were enrolled. A total of 150 potential participants were screened (Figure 1). Exclusion criteria included any ocular visual pathology or contraindication to noninvasive brain stimulation 22 and tDCS. 23 Specific criteria drawn from safety guidelines pertaining to the use of noninvasive cortical stimulation include (1) the presence of any metallic, mechanical, or magnetic implant in the head or implantable device (eg, cardiac pacemaker); (2) prior history of seizure or familial history of seizure disorder in a first-degree relative, and (3) chronic use of neuroactive medication (eg, neurostimulants, anticonvulsants, or antidepressants).
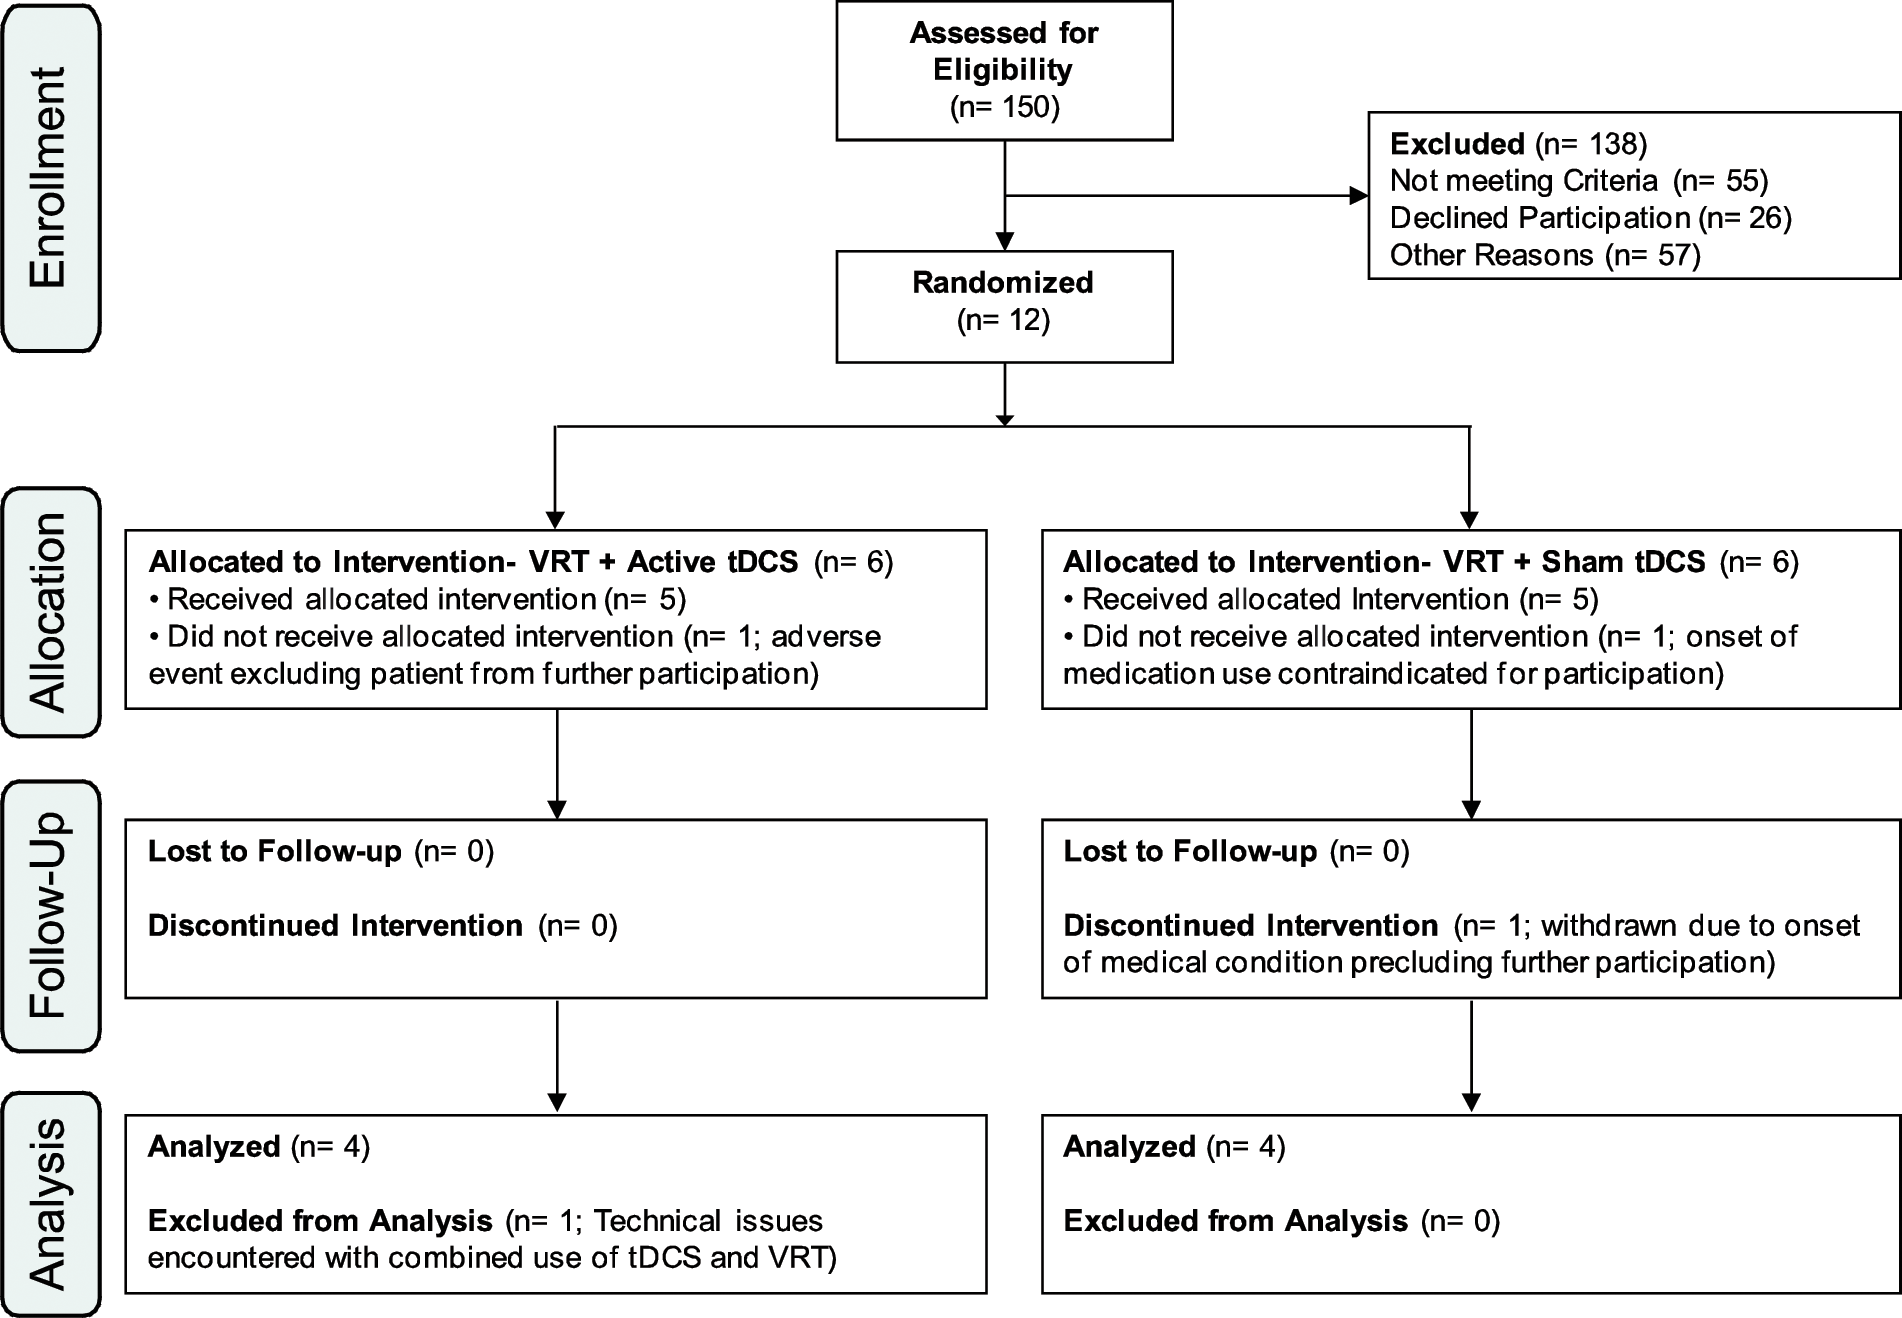
CONSORT flow diagram showing patient disposition throughout the stage-2 pilot, randomized controlled study. Abbreviations: VRT, Vision Restoration Therapy; tDCS, transcranial direct current stimulation.
Following comprehensive neurological and ophthalmological screening, 12 patients (7 women; mean age ± SE = 59.58 ± 3.47 years) with unilateral postchiasmal visual field loss (hemianopia, 7; quadrantanopia, 5) caused by stroke (n = 10) or surgical trauma (n = 2) were enrolled. The mean time since onset of the condition was 39.83 ± 16.16 months (Table 1).
Clinical Details of Patients
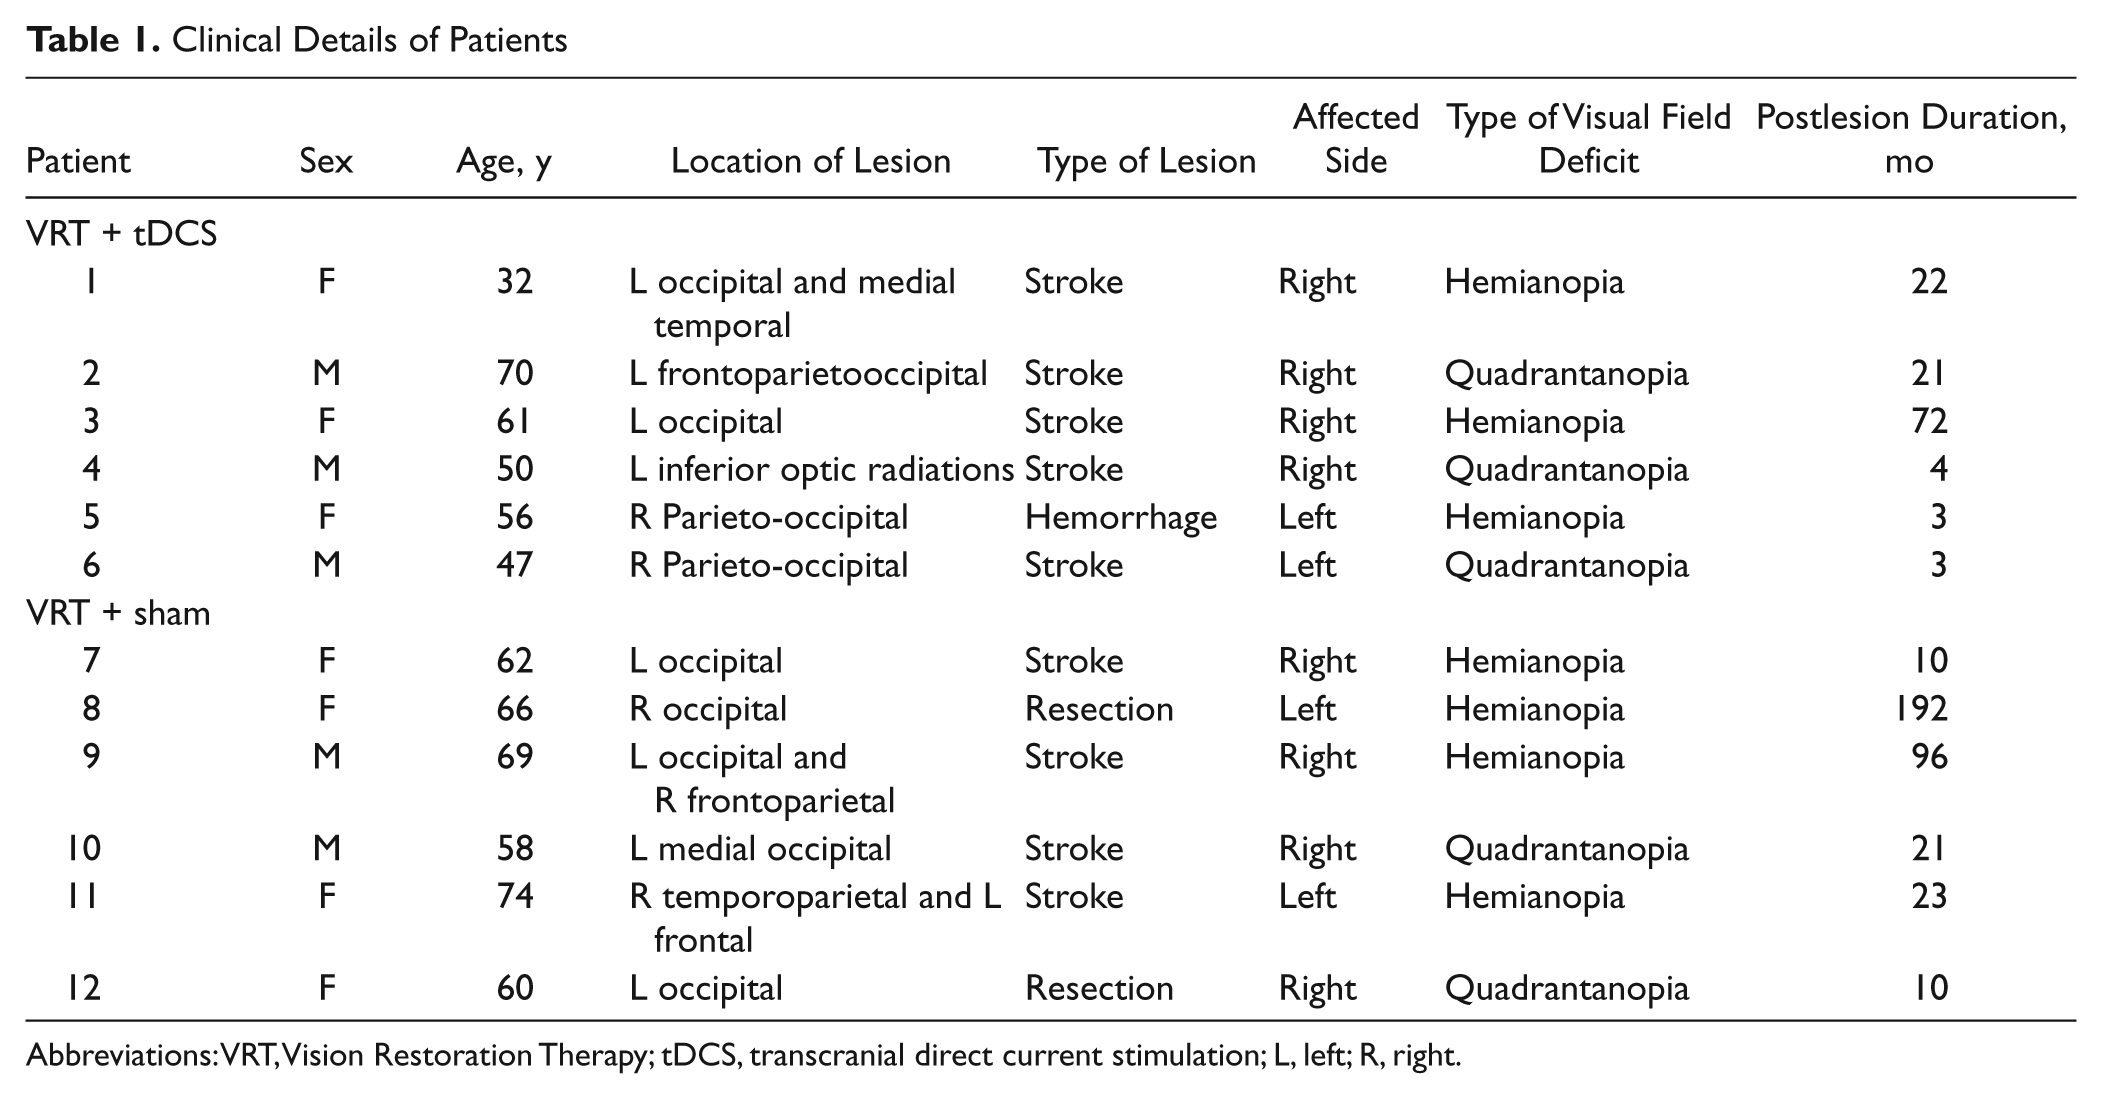
Abbreviations: VRT, Vision Restoration Therapy; tDCS, transcranial direct current stimulation; L, left; R, right.
Participants were randomly assigned using a predetermined enrollment sequence to 1 of 2 arms: VRT with active tDCS (VRT + tDCS) or VRT with sham tDCS (VRT + sham). Because the aim was to explore whether concurrent tDCS could promote visual recovery beyond VRT alone, a placebo visual training group was not included. Participants and investigators analyzing visual field outcomes were blinded to the tDCS mode (active vs sham). All participants provided written informed consent. The study was approved by the Institutional Review Board of the Beth Israel Deaconess Medical Center and was registered with www.clinicaltrials.gov (NCT00921427).
Vision Restoration Therapy
We used a contracted VRT regimen lasting 3 months (2 half-hour sessions, separated by a 30-minute rest interval, for 3 d/wk). Previous criticisms have questioned whether the typical 6-month home-based VRT regimen9,24,25 generates significant visual functional benefits and, furthermore, whether training could be potentially confounded by environmental factors.26-30 By using a contracted regimen, we were able to explore whether tDCS through greater and/or earlier benefits improved clinical utility of VRT and study outcomes in a highly controlled laboratory environment that served to assist in retaining patients throughout the training period.
VRT training has been described in detail elsewhere. 31 Briefly, participants were seated in front of a computer screen at a constant viewing distance and instructed to detect (signaled by a key press) the presence of a flashed light stimulus while maintaining fixation on a central target. Built-in fixation monitoring required patients to respond to a color change of the central fixation target occurring at random intervals. Target stimuli were presented primarily in the region of the transition zone (identified by a prior visual field test; see details on high-resolution perimetry), and the spatial parameters of customized therapy were determined based on weekly progress and results of monthly tests.
Transcranial Direct Current Stimulation
tDCS was applied using two 5 × 7 cm2 saline-soaked sponge electrodes connected to a 9-V battery-driven stimulator (IOMED Inc, Salt Lake City, Utah) delivering a constant current of 2 mA for the entire duration of the training procedure. Following the 10-20 International EEG coordinate system, the anode was placed at the occipital pole (Oz) and the cathode (reference) was positioned at the vertex (Cz). Electrodes were then secured using nonlatex rubber straps, and an identical montage was worn by all patients throughout training. Experimental blinding with respect to active or sham tDCS was implemented according to standard protocol guidelines described previously.23,32
Our choice for applying anodal current to the occipital cortex was guided by previous evidence in healthy individuals. These studies confirmed that this montage modulates occipital cortical excitability bilaterally while producing transient, polarity-specific changes in visual function.19,20
Outcome Measures
The primary outcome was visual field function characterized using high-resolution perimetry (HRP). 14 Similar to VRT, patients were seated in front of a computer screen and instructed to detect (signaled by a key press) the appearance of transient suprathreshold (95 cd/m2) visual stimuli presented throughout the visual field while maintaining fixation on a central target. Stimuli appeared at random intervals and within an area spanning 43° × 32° corresponding to an imaginary grid of 284 cells, each subtending roughly 2° of visual angle. Fixation monitoring was the same as described for VRT above. Only tests demonstrating a fixation accuracy of 95% or greater and a false-positive response rate of 3% or less were used for subsequent analyses (defined a priori). A total of 3 consecutive HRP tests were compiled to generate a composite visual field map based on stimulus detection probability.14,33 HRP-based visual field maps were collected at baseline (pretest) and at the completion of training at 3 months (posttest).
Recovery of visual field function was evaluated by comparing differences in (1) the position of the visual field border and (2) stimulus detection accuracy. The visual field border was defined as the horizontal distance (in degrees) between the central vertical meridian and the medial edge of 2 consecutive blind cells along each row of the imaginary grid. 34 Stimulus detection accuracy was expressed as the percentage of stimuli detected versus total number of targets presented in the affected field.9,34
Secondary outcomes included subjective topographic measure of perceived visual field deficit at pretest and at posttest. Under binocular viewing conditions and from a distance of 40 cm, participants were instructed to fixate on a central target presented on a 9” × 12” sheet of graph paper (similar to an Amsler grid) and indicate the border of their vision. The drawing was then digitized and converted into a dichotomous black and white image. The area of the subjective affected field (in cm2) was then calculated using custom software (Scion, 4.0.2; Frederick, Maryland). 31
To evaluate the effect of the intervention on activities of daily living (ADLs) and quality of life (QOL), 2 validated questionnaires were used: the Veterans Affairs Low Vision-Visual Functional Questionnaire (LV-VFQ) and the Impact of Vision Impairment (IVI) profile. The LV-VFQ assesses an individual’s visual ability to perform ADLs across 4 domains, including reading, mobility, visual motor function, and visual processing, 35 whereas the IVI measures the impact of visual impairments on QOL and participation, including access to information, mobility and independence, and emotional well-being. 36 Responses were rated using a Likert-type scale (with 1 indicating not difficult at all to 4 indicating impossible for the LV-VFQ and 0 indicating not affected to 5 indicating cannot do it at all for the IVI). Both questionnaires were collected at pretest, posttest, and a 6-month follow up interval.
Ancillary Assessments
Previous studies investigating the effect of VRT have raised concerns related to inadequate methods of fixation monitoring27,29,30,37,38 and lack of corroborative evidence of visual field benefit when assessed with more common techniques of clinical perimetry.26,29,39,40 To address these issues, we incorporated the following modifications. First, we incorporated an independent measure of fixation performance during training and HRP testing using a 2-D infrared eye tracking device (sampling frequency of 60 Hz; Applied Science Laboratories, Bedford, Massachusetts). The percentage of time for which fixation was maintained within a central 1° and 2° radius was calculated using specialty eye-tracking software (Eyenal-Fixplot, Applied Science Laboratories). Second, we obtained a parallel measure of visual field performance using a NIDEK MP-1 microperimeter (NIDEK Technologies; Padova, Italy) collected at pretest and at posttest. This device was chosen based on its increasing clinical use and its ability to combine both luminance-based thresholded microperimetry and other built-in features such as retinal fundus–based fixation tracking.41,42 The NIDEK MP-1 testing grid covered a circular area within the central 20°. A luminance-thresholded strategy was used to calculate the mean threshold of detection (in dB) in the affected and intact hemifields. Stimuli locations within the affected hemifield were then categorized as “blind” (0-3 dB), “intact” (greater than cutoff value based on lowest threshold of detection in the intact hemifield), and “transition” (4 dB to cutoff value in decibels). 42 Fixation performance was quantified by the percentage of time for which fixation was maintained within 2° and 4° and defined as “stable” when greater than 75% of time was spent within 2°.41,42
Statistical Analysis
Owing to the relatively small sample size and preliminary nature of the study, we used nonparametric statistics with an α level of significance set at .05. Within-group pairwise comparisons were carried out with the Wilcoxon signed-rank test, whereas between-group analyses used Mann-Whitney U comparisons of posttest minus pretest difference scores. SPSS software was used for statistical analyses (SPSS Inc, v18, Chicago, Illinois).
Results
All participants were able to interact successfully with the computerized VRT system, and no adverse events were associated with combining active/sham tDCS with VRT within the laboratory setting. Two patients each from the VRT + tDCS group (patients 1 and 5; Table 1) and 2 more from the VRT + sham group (patients 11 and 12; Table 1) were excluded from the final analysis (see Figure 1). The final data analysis therefore included 4 participants from each group. Experimental blinding regarding active or sham delivery of tDCS was confirmed during exit interviews.
Within-group comparisons of the visual field border showed that the VRT + tDCS group demonstrated a trend toward a significant shift from baseline to posttest (from 4.11° ± 1.50° to 8.37° ± 2.29°, Wilcoxon signed-rank test = 0, P = .068; see patient 1 in Figure 2A and group results in Figure 3A). The change observed in the VRT + sham group (from 6.33° ± 2.59° to 7.03° ± 2.51°, Wilcoxon signed-rank test = 1, P = .144) was not significant (see patient 2 in Figure 2A and group results in Figure 3A). Overall, the combination of tDCS with VRT led to a significantly greater shift in the visual field border than VRT alone (Mann-Whitney U = 0, P = .021; Figure 3A).
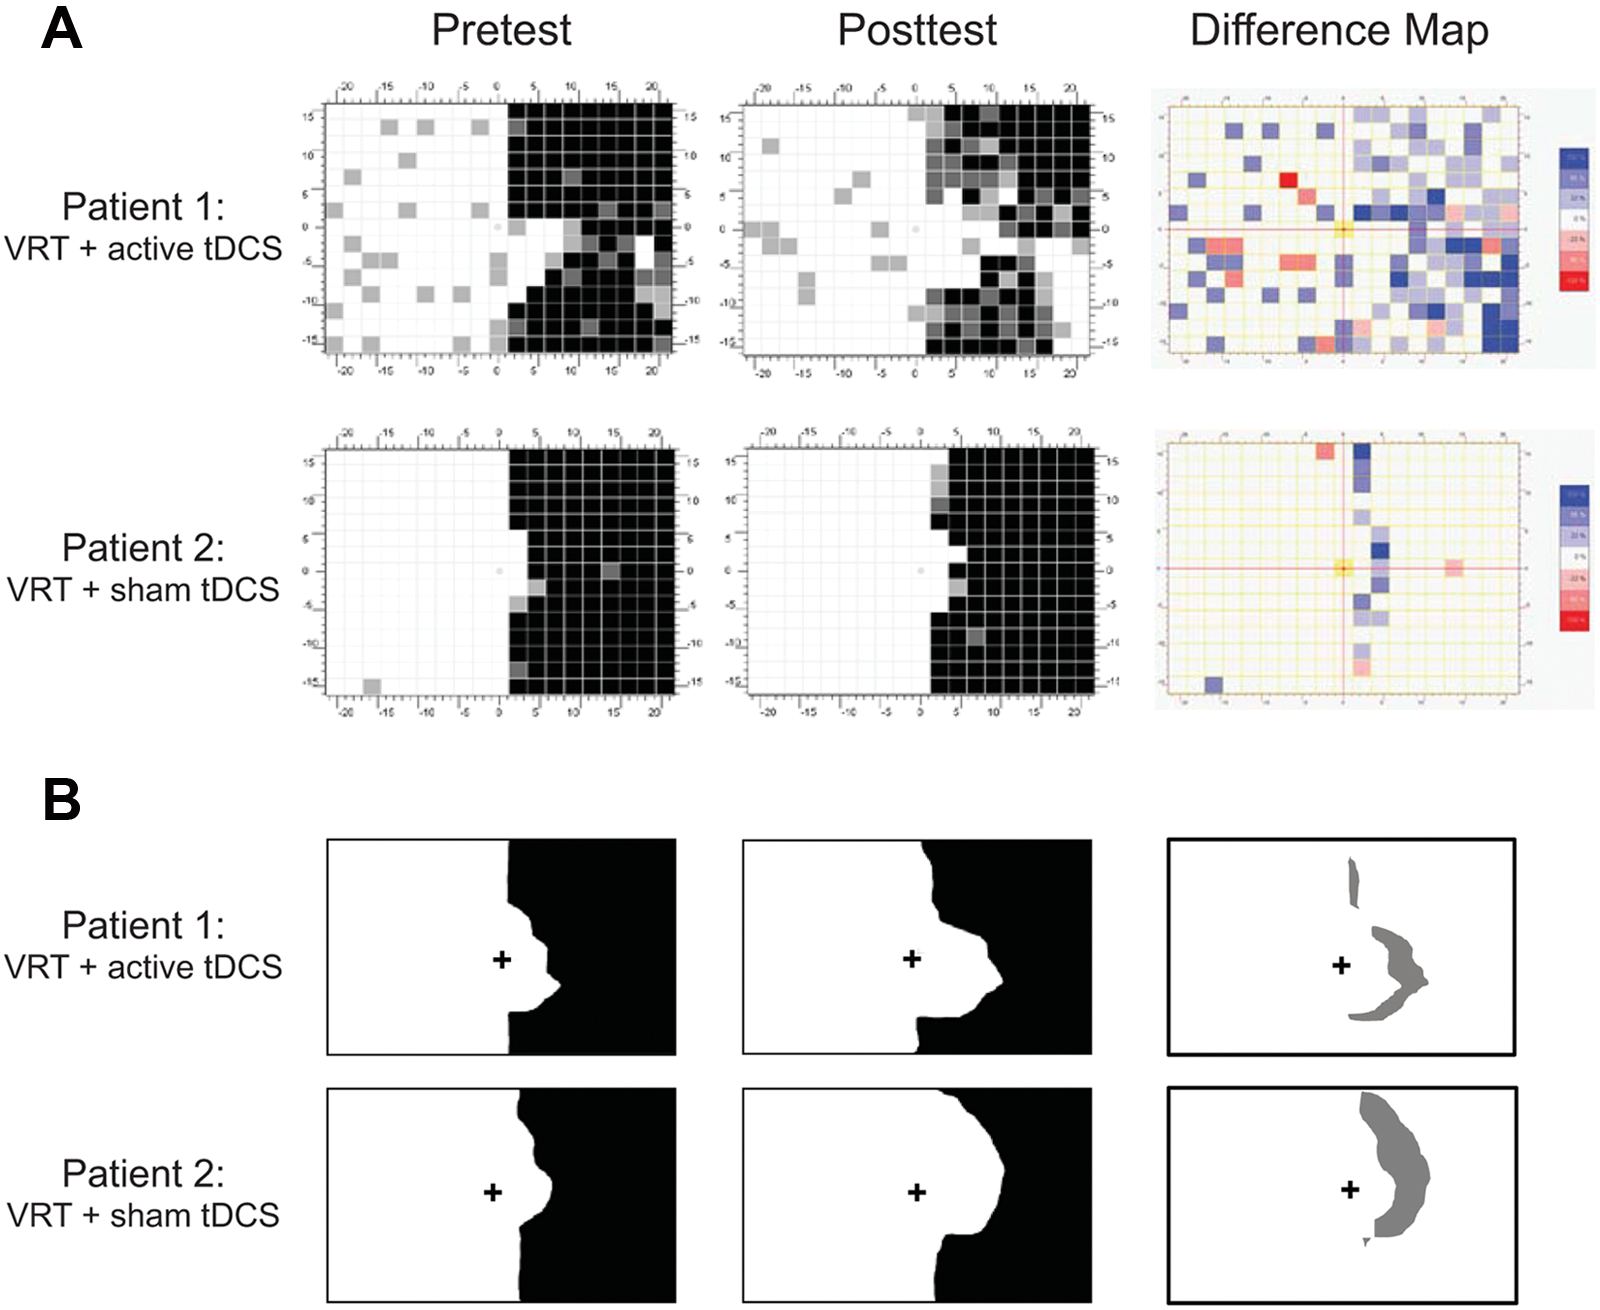
Visual field recovery, representative cases: recovery of visual field assessed by (A) primary outcome, that is, objective visual field assessed with HRP, and (B) secondary outcome, that is, subjective topographic assessment. A representative example from each group is shown. Both patients presented with a dense right hemianopia. (A) From pretest to posttest, patient 1 (corresponding to patient 3 from Table 1) demonstrated a visual field expansion of 3.55° and a 27.29% increase in stimulus detection accuracy in the affected right visual field. Patient 2 (corresponding to patient 7 from Table 1) showed a modest visual field gain of 0.9° and a 3.58% improvement in stimulus detection. The difference maps (right column) represent subtraction images of posttest minus pretest visual field maps for both patients. Regions where the patient failed to detect stimuli at pretest but performed with 100% accuracy at posttest are shown in the darkest shade of blue; lighter shades of blue indicate 33% or 66% improvement in stimulus detection accuracy. Note that the regional changes on difference maps illustrate areas of visual field expansion, whereas the shade of the color (dark vs light) depicts changes in stimulus detection accuracy. Note for patient 1 that the visual field gain appears to be maximal in the inferior peripheral right quadrant, whereas that for patient 2 is evident along the vertical meridian mainly in the superior quadrant. In (B), the subjective perception of the size of the affected visual hemifield (area in black color) is also shown at pretest and posttest for patients 1 and 2. The difference maps (right column) represent subtraction images of posttest minus pretest difference (gray shade) in size of the subjective affected visual field for both patients. Note that patient 2’s perception of recovery (53.74 cm2) is greater than that of patient 1 (24.14 cm2); this difference, although regionally comparable with the area of visual field change noted in difference maps in (A), is opposite in the magnitude of benefit compared with (A). Abbreviations: VRT, Vision Restoration Therapy; tDCS, transcranial direct current stimulation; HRP, high-resolution perimetry.
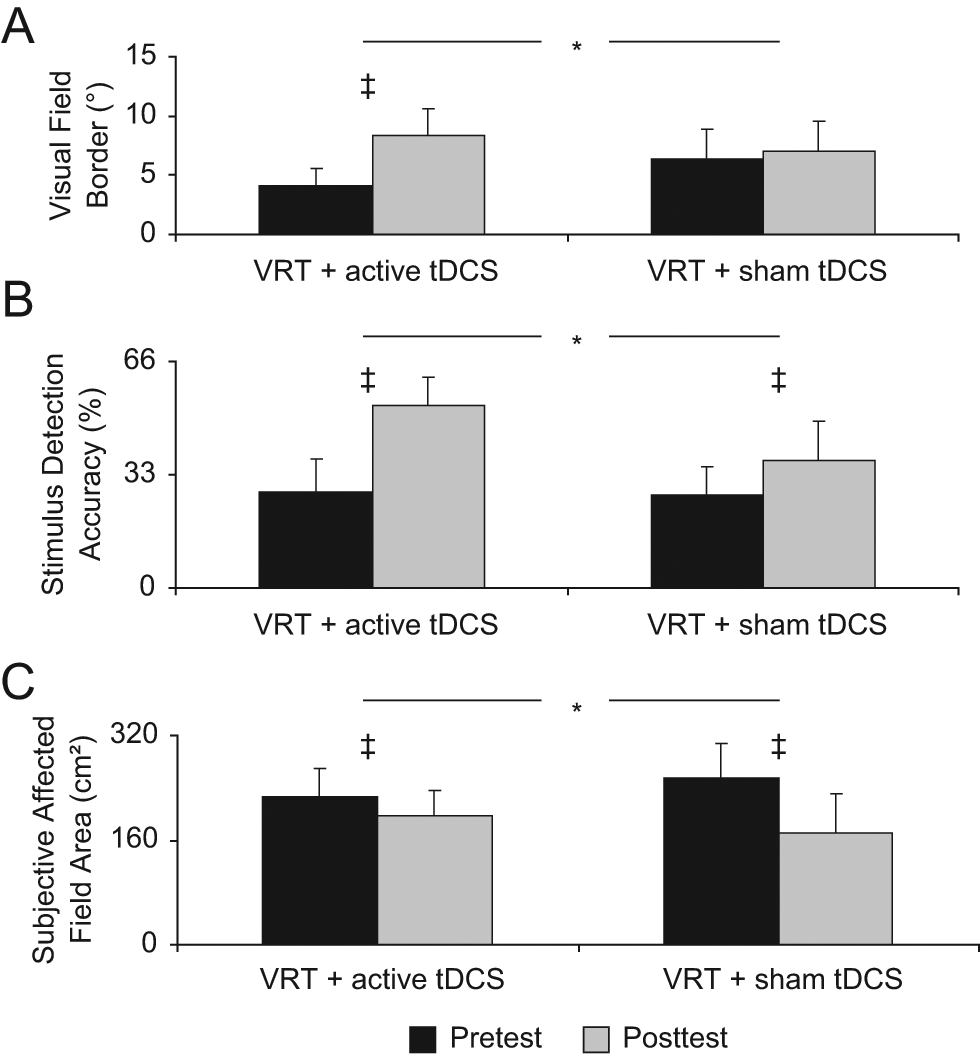
Visual field recovery, within- and between-group results: recovery of primary outcome, objective HRP (A, B), and secondary outcome, subjective topographic assessment (C), of visual field within and between groups. Error bars represent mean (+SE) of pretest to posttest change in (A) position of visual field border, (B) stimulus detection accuracy within the affected visual field, and (C) subjective perception of the size of the affected visual field (note: lower values indicate greater recovery of the subjective visual field area). *P < .05; ‡Trend toward statistical significance; consult text for exact P values. The asterisk symbol combined with a horizontal bar represents between-group differences on posttest minus pretest difference score (analyzed using the Mann-Whitney U test). The symbol (‡) without a horizontal bar represents within-group differences (analyzed using the Wilcoxon signed-rank test) comparing pretest with posttest changes within each group.
In contrast, stimulus detection accuracy within the affected hemifield improved across both groups. An increase in accuracy trended toward significance in both the VRT + tDCS group (from 27.96% ± 9.80% to 52.98% ± 8.21%) as well as the VRT + sham group (27% ± 8.06% to 36.95% ± 11.71%), with both Wilcoxon signed-rank test = 0 and P = .068 (see difference maps for patients 1 and 2 in Figure 2A and group results in Figure 3B). However, the improvement in stimulus detection accuracy was significantly greater in the VRT + tDCS group than in the VRT + sham group (Mann-Whitney U = 1, P = .043; Figure 3B).
Comparing changes in the area of the subjective visual field revealed that all patients perceived a reduction in their visual field deficit following training (see difference maps for patients 1 and 2 in Figure 2B and group results in Figure 3C). Both groups reported a trend toward significant decrease in deficit: VRT + tDCS from 225.60 ± 44.07 to 196.91 ± 38.14 cm2 (Wilcoxon signed-rank test = 0; P = .068) and VRT + sham from 254.30 ± 53.14 to 171.47 ± 59.51 cm2 (Wilcoxon signed-rank test = 0; P = .068). Intriguingly, however, the VRT + sham group reported a greater subjective recovery than the VRT + tDCS group (reduction of 82.83 ± 20.11 versus 28.69 ± 9.88 cm2, respectively; Mann-Whitney U = 1, P = .043; Figure 3C).
Recovery of abilities to perform ADLs was in line with improvements in the primary outcome. Whereas analysis for the composite LV-VFQ score indicated a trend toward significant recovery in the VRT + tDCS group (from 32.25 ± 5.30 to 28.25 ± 5.07; Wilcoxon signed-rank test = 0; P = .068), the change in the VRT + sham group remained nonsignificant (from 28 ± 2.34 to 25.25 ± 1.11; Wilcoxon signed-rank test = 1; P = .285; Figure 4A). Nevertheless, between-group differences comparing the composite LV-VFQ score were nonsignificant (Mann-Whitney U = 5.5; P = .468).
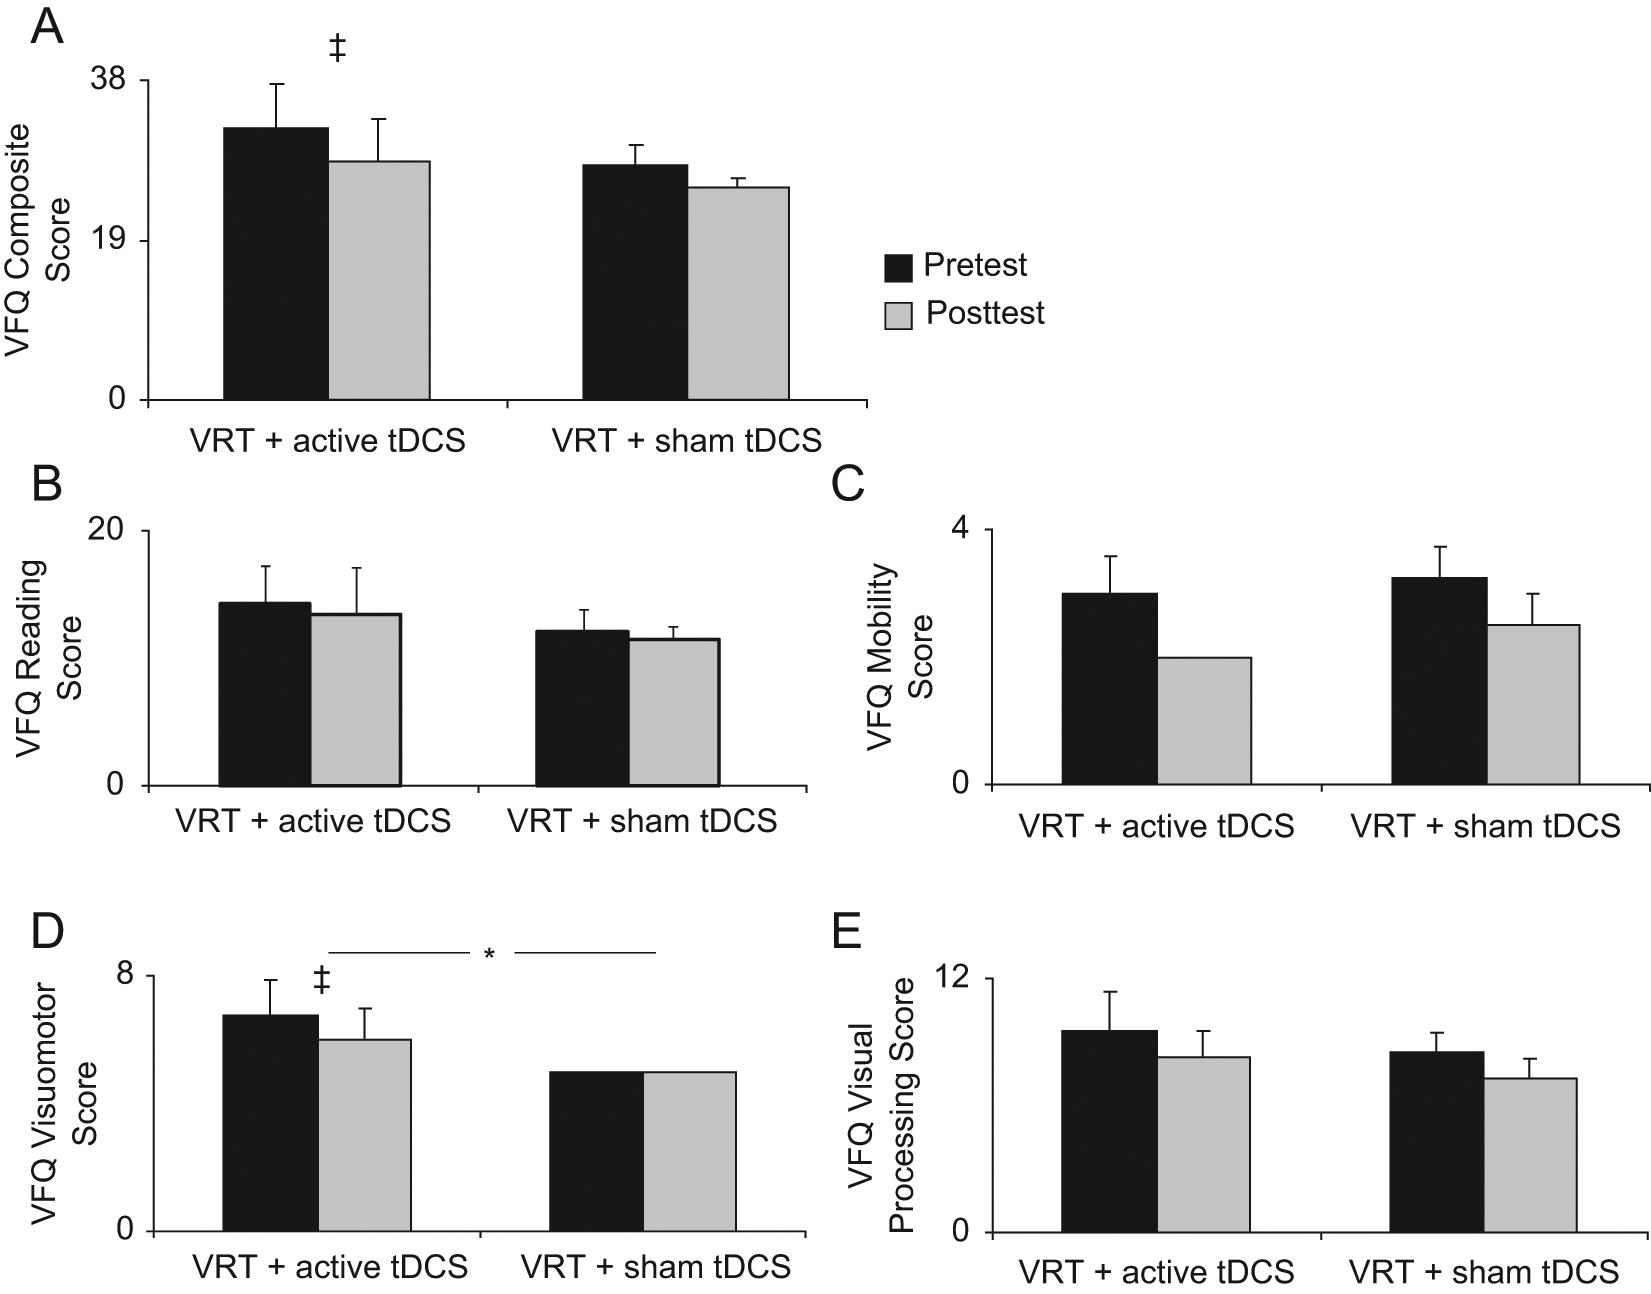
Recovery of visual function: improvement on patient report–based subjective visual functional questionnaire (VFQ) evaluating visual abilities to perform activities of daily living (ADLs). Bars represent mean (+SE) of the scores. Lower values are indicative of less impairment in ADLs. Within- and between-group comparisons show that (A) the composite VFQ scale (Wilcoxon signed-rank test) revealed a trend toward recovery in patients in the VRT + tDCS group (consult text for exact P values); (B) for the Reading subscale, neither group demonstrated a change in performance following training; (C) on the Mobility subscale, no improvement was apparent within either group; (D) the Visuomotor subscale showed a trend toward greater recovery in patients in the VRT + tDCS group. (E) On the Visual processing subscale, effects were significant in neither group. *P < .05; ‡trend toward statistical significance. The asterisk symbol combined with the horizontal bar represents between-group differences (analyzed using the Mann Whitney U test). The symbol (‡) without the horizontal bar represents within-group differences (analyzed using the Wilcoxon signed-rank test) comparing pretest to posttest measures within each group. Abbreviations: VRT, Vision Restoration Therapy; tDCS, transcranial direct current stimulation; SE, standard error.
However, subscale analysis of LV-VFQ revealed significant between-group differences for visuomotor processing scores. Only the VRT + tDCS group perceived a trend toward significant improvement (from 6.75 ± 1.11 to 6 ± 1, Wilcoxon signed-rank test = 0, P = .083), which was greater than that in the VRT + sham group (Mann-Whitney U = 2, P = .04; Figure 4D). The subscale analyses failed to show significant improvement in either group for reading (VRT + tDCS: 13 ± 2.71 to 12.25 ± 3.35; VRT + sham: 11 ± 1.68 to 10.50 ± 0.96; Figure 4B), mobility (VRT + tDCS: 3 ± 0.58 to 2 ± 0; VRT + sham: 3.25 ± 0.48 to 2.5 ± 0.50; Figure 4C), or visual processing (VRT + tDCS: 9.5 ± 1.85 to 8.25 ± 1.31; VRT + sham: 8.5 ± 0.96 to 7.25 ± 0.95; Figure 4E). The impact of visual impairment on QOL and participation in life’s roles (assessed with the IVI) did not change significantly in either within- or between-group comparisons.
Ancillary Assessments
Analysis of the 2D eye tracking data revealed that the percentage of time for which fixation was maintained within a central 1°-radius (with both groups collapsed) significantly improved across patients from 77.87% ± 5.58% to 89.85% ± 2.89% (Wilcoxon signed-rank test = 0; P = .018). Within-group analyses confirmed that only the VRT + tDCS group showed a trend toward improved fixation within 1° (77.88% ±10.37% to 89.81% ± 3.46%; Wilcoxon signed-rank test = 0; P = .068), whereas the change in the VRT + sham group failed to reach significance (77.85% ± 1.90% to 89.90% ± 5.89%; Wilcoxon signed-rank test = 0; P = .109). Both groups maintained fixation within a 2° radius for greater than 95% of the time without any significant change from pretest to posttest (from 96.62% ± 1.97% to 98.59% ± 0.46%; Wilcoxon signed-rank test = 10; P = .499).
Valid assessments of perimetry obtained with the NIDEK-MP-1 were only available for 5 out of 8 patients (Table 1, patients 3, 6, 7, 8, and 10) because of technical difficulties arising from poor image quality 42 and fatigue from long testing times. All demonstrated stable fixation and minimal false-positive responses both at pretest—fixation 2°, 94.6% ± 1.75%; fixation 4°, 99.8% ± 0.2% (false positives, 0)—and at posttest—fixation 2°, 87.8% ± 4.82%; fixation 4°, 98.8% ± 0.73% (false positives, 0.4 ± 0.39). Qualitative comparison of visual fields appeared to be consistent with observations obtained from HRP. Quantitative analysis of data from patients 3 and 6 (VRT + tDCS) and patients 7, 8, and 10 (VRT + sham) showed that in the affected hemifield, the number of stimulus locations associated with the transition zone reduced (pretest, 11.6 ± 4.32; posttest, 4.4 ± 2.2), whereas the number of intact positions increased (pretest, 14.8 ± 2.88; posttest, 22.2 ± 4.29), with the positions in the blind region remaining unchanged (pretest, 17.6 ± 4.76; posttest, 17.4 ± 4.78). Differences in mean threshold of detection did not appear to explain these results. In fact, luminance thresholds were reliable (based on previously established criteria 43 ) and remained unchanged in the central 2° (pretest, 12.4 ± 0.7 dB; posttest, 12.8 ± 1.18 dB) and in the peripheral 8° (pretest, 7.4 ± 1.4 dB; posttest, 8.2 ± 1.65 dB).
Assessment of Visual Function at the 6-Month Follow-up
To investigate the stability of the effects as a result of the intervention, we compared performance on ADLs (LV-VFQ) and impact on QOL and participation in life’s roles (IVI) between posttest and 6-month follow-up (available for 5 out of 8 patients). Improvements appeared to be stable because no significant difference was observed during this follow-up period: compare 29.00 ± 3.58 versus 26.80 ± 2.11 for composite LV-VFQ (Wilcoxon signed-rank test = 4; P = .343) and 23.20 ± 7.83 versus 16.8 ± 4.62 for IVI (Wilcoxon signed-rank test = 2.5; P = .357).
Discussion
Our pilot findings suggest that visual field outcomes following VRT may benefit from concurrent application of occipital cortical tDCS. Furthermore, this effect may extend to functional improvements on ADLs that are retained at least 6 months following completion of training. Intriguingly, the additive effect of tDCS does not appear to correspondingly benefit the subjective perception of visual field recovery. Future investigations should explore the generalizability of these findings with a larger-scale study to establish whether tDCS indeed upregulates occipital cortical mechanisms of plasticity supporting visual rehabilitation and whether it differentially affects objective versus subjective outcomes.
Effect of Combining VRT and tDCS
Participants in the VRT combined with tDCS group demonstrated an average expansion of 4.26° in visual field and 25.02% gain in stimulus detection accuracy, which represented an advantage of 3.56° and 15.02%, respectively, compared with those receiving VRT and sham. It is interesting to note that the changes observed by combining VRT and tDCS were comparable with those noted in previous studies of VRT (average visual field expansion of 5° and 29% improvement in stimulus detection) using a more typical 6-month regimen of daily training.9,34 Our preliminary observation that tDCS may augment benefits of even a contracted 3-month regimen (representing 25% of the usual dose) is indicative of its adjunctive benefit in visual rehabilitation.
The advantage of adjunctive tDCS, however, did not similarly translate to subjective perceptions of visual field change. Patients receiving VRT + sham reported greater improvement even though objective HRP results suggested the contrary. Previous studies of VRT describe a similar disconnect between changes in objective measures and patients’ own subjective impressions of improvement.24,31,39 This apparent mismatch may be explained by differences in the functional relevance ascribed to different regions of the field (eg, perifoveal vs peripheral) and the degree of awareness of the field deficit. 31 It should be noted, however, that the mismatch of subjective and objective findings may also have emerged from methdological factors such as sampling errors related to the relativley small sample size in the study.
Given the potential disconnect between objective and subjective findings, we also assessed the impact of tDCS and VRT on functional surveys of ADLs and QOL. The benefit of combining tDCS with VRT was apparent in the recovery of visual abilities in ADLs, specifically in the domain of visuomotor tasks (such as “using appliance dials”) perhaps because these tasks place less demand on functional reserves compared with reading, information processing, or mobility, as suggested by a recent Rasch analysis study. 35
Despite modest improvement in visual function in ADLs, however, QOL (as assessed with the IVI) did not improve significantly in either group. This may be related to the fact that IVI assesses a person’s experience with restrictions on participation rather than the actual visual impairments, 36 which do not necessarily predict disability. 44 A previous study assessing the effectiveness of VRT did find improvement in several domains related to QOL. 45 Perhaps, discrepancies between the current study and the aforementioned report are related to differences in study design, duration of VRT, and outcome measures used.
Underlying Neurophysiological Mechanisms
There exists evidence that tDCS modulates cortical excitability by altering neuronal efficiency 46 and promoting corticocortical connectivity. 47 In essence, combining bilateral occipital cortical tDCS (targeting damaged and intact occipital areas) with VRT may have enhanced rehabilitative outcomes by increasing the excitability of surviving visual networks, thereby “steering” inherent mechanisms of plasticity such as neurogenesis, 48 synaptic efficacy (eg, long-term potentiation), 49 and cortical remapping. 4
We cannot ascertain which regions and specific mechanisms were implicated in the observed improvements in our study. The use of a bilateral occipital cortical montage of anodal tDCS was guided by prior reports documenting its advantage for visual perception in healthy participants.19,20 At the same time, the electrical field may have been preferentially shunted to perilesional regions in our patients because the cerebral spinal fluid is highly conductive.50,51 Confirming this hypothesis (by using a combination of current modeling and/or neuroimaging methodologies) 52 is likely to help explain the synergistic mechanisms of plasticity underlying the combination of tDCS and rehabilitation as well as candidate regions implicated in these processes.
Study Design Considerations
As a stage 2 (development-of-concept) pilot, 21 the present study allowed us to test enrichment strategies to optimize interventions and introduce refinements for a larger multicenter randomized clinical trial. A key design refinement included control and evaluation of the effect of potential compensatory eye movements. Using continuous, high-resolution gaze tracking (within 0.5°), we showed that improved visual field function was not solely the result of changes in saccadic strategies. In fact, we observed improved fixation performance over time. Our findings corroborate earlier evidence presented by Kasten and coworkers. 53
However, these findings differ from results presented by Trauzettel-Klosinski 38 and Reinhard et al 39 who have argued that superior fundus-based, high-resolution (0.5°) fixation control can negate apparent VRT-related visual field gain. To evaluate this concern, we collected corroborative eye-tracking evidence using a NIDEK MP-1 microperimeter incorporating fundus-based tracking. Despite stable fixation behavior, patients demonstrated evidence of visual field recovery primarily involving transformation of the transition zone into intact visual field locations. A recent MP-1 study has similarly discussed that modest improvements follow VRT without the artifact of inadvertent eye movements. 54 Although we cannot rule out the possibility of confounding eye movements or eccentric fixation, it is important to note that these strategies still implicate cortical plasticity aimed at improving reading or navigation abilities. 55
The most important limitation of this study is the small sample size owing to stringent inclusion/exclusion criteria and the demanding nature of the study protocol. Despite this limitation, the current design fulfills important prerequisites for a pilot, stage 2 development-of-concept study. 24 These include (1) standardization of new therapy, (2) comparison with a task-related active intervention as control, (3) feasibility of blinding, (4) defining outcomes that best complement the intervention (ie, visual performance–based vs quality-of-life assessments), and (5) most important, feasibility of recruiting from a population of interest. Thus, the study cannot offer concrete evidence for efficacy and generalizability but may help in the development of a next-stage multisite randomized clinical trial that will be better powered.
Footnotes
Acknowledgements
The authors would like to thank Sigrid Kenkel, Patricia Schulz, and Michael Crossland for invaluable technical expertise regarding data analysis and Mary Lou Jackson, Nurhan Torun, and Joseph F. Rizzo for assistance in conducting this project.
Declaration of Conflicting Interests
The author(s) declared the following potential conflicts of interest with respect to the research, authorship, and/or publication of this article: APL serves on the scientific and medical advisory board of Novavision VRT Inc.
Funding
This work was supported by an investigator-initiated pilot grant from Novavision VRT Inc and by the National Institutes of Health (K23-EY016131 to LBM).