
Abstract
Background. Despite the availability of various options for movement restoration in stroke patients, there is no effective treatment for patients who show little or no functional recovery of upper limb motor function. Objective. The present study explored the feasibility of real-time functional magnetic resonance imaging brain–computer interface (fMRI-BCI) as a new tool for rehabilitation of this patient population. Methods. Healthy adults and chronic subcortical stroke patients with residual movement were trained for 3 days to regulate the blood oxygenation level dependent (BOLD) response in the ventral premotor cortex (PMv), a secondary motor area with extensive anatomic connections with the primary motor cortex. Effect of learned modulation of the PMv was evaluated with BOLD signal changes across training sessions, transcranial magnetic stimulation (TMS), and a visuomotor task. Results. fMRI-BCI feedback training showed learning with a significantly increasing BOLD signal in the PMv over sessions. Participants’ capability to learn self-regulation was found to depend linearly on intracortical facilitation and correlated negatively with intracortical inhibition measured by TMS prior to feedback training. After training, intracortical inhibition decreased significantly with the volitional increase of the BOLD response in the PMv, indicating a beneficial effect of self-regulation training on motor cortical output. Conclusion. The study provides first evidence for the therapeutic potential of fMRI-BCI in stroke rehabilitation.
Introduction
It has been proposed that neurofeedback training using functional magnetic resonance imaging–based brain–computer interface (fMRI-BCI) may reactivate the motor system for neurological rehabilitation after stroke.1-3 Several studies demonstrated that people can learn to volitionally regulate the blood oxygenation level dependent (BOLD) signal in a circumscribed region of the brain with real-time fMRI (rtfMRI) assisted feedback training and that the acquired control over brain regions leads to behavioral changes.4-6 These results encouraged us to explore the application of fMRI-BCI in chronic stroke patients.
Based on recent animal7,8 and neuroimaging data,9,10 we hypothesized that the properties and functions of the ventral premotor cortex (PMv) make it a promising candidate for promoting functional recovery after stroke. First, the PMv contributes to the control of upper limb and head movements,8,11,12 especially goal-directed hand movements, visuomotor integration, and visuomotor transformations.13-15 Second, changes in the PMv, for example, after an ischemic lesion leading to hemiparesis, result in increased excitability of the affected hemisphere; displacement of motor maps toward the PMv 16 ; and increased cerebral blood flow in this area. 17 Also, functional recovery after stroke depends on the integrity of the PMv: patients with intact PMv show better recovery than patients with damaged PMv. 18
This study had 3 aims. First, we wanted to demonstrate that healthy volunteers and stroke patients could learn to volitionally regulate the activation levels of the PMv with the help of fMRI-BCI. Second, we wanted to investigate whether learned upregulation of BOLD activity in the PMv can increase the interaction between the PMv and the primary motor cortex (M1). It has been proposed that the PMv exerts its main influence on hand motor output through the modulation of the M1. We hypothesized that learned self-regulation of the PMv can improve the interaction with the M1 through the reduction of intracortical inhibition (ICI) and the increase in intracortical facilitation (ICF) as measured by transcranial magnetic stimulation (TMS), 19 using a paired-pulse protocol. 20 In addition, we assessed the effect of self-regulation training on the performance of a visuomotor task using a pinch-force transducer. We hypothesized that acquired control of the PMv through feedback training enhances the performance on the pinch-force task.21-25
Methods
Participants
Two right-handed patients with right hemiparesis of more than 1 year duration participated. One male was aged 63 years with an internal capsule lesion, upper extremity Fugl-Meyer (F-M) score of 55 out of 66 points. Another male, aged 68 years, had a corona radiata lesion, F-M score of 60 out of 66 points. Four right-handed healthy adults (3 males; mean age, 25.3 years) participated. Written informed consent was obtained. The ethics committee of the University of Tübingen approved the study.
Real-Time fMRI-BCI
To anatomically delineate the region of interest (ROI), namely, the PMv, individualized in each participant, a functional localization task involved action observation of a coffee cup in the right hand of the participant moving toward his mouth (Figure 1A). Blocks of 15-second fixation alternated with 30-second blocks of observation of the video. Visual feedback was computed in the Tübingen fMRI-BCI software from the changing BOLD signal extracted from the PMv (ROI 1) and a reference ROI (ROI 2). The reference (control) ROI was used to cancel out nonspecific, global BOLD changes, for example, from head movement and arousal. The reference ROI was chosen as a larger rectangular area relative to the target ROI, in the hemisphere contralateral to the target ROI (Figure 2). The feedback signal was computed as the difference between average BOLD in ROI 1 and ROI 2 and was calculated and normalized to the rest condition, using the following equation (BOLDupreg − BOLDrest)ROI1 − (BOLDupreg − BOLDrest)ROI2, where BOLDreg and BOLDrest constituted the signals during upregulation and rest periods, respectively.
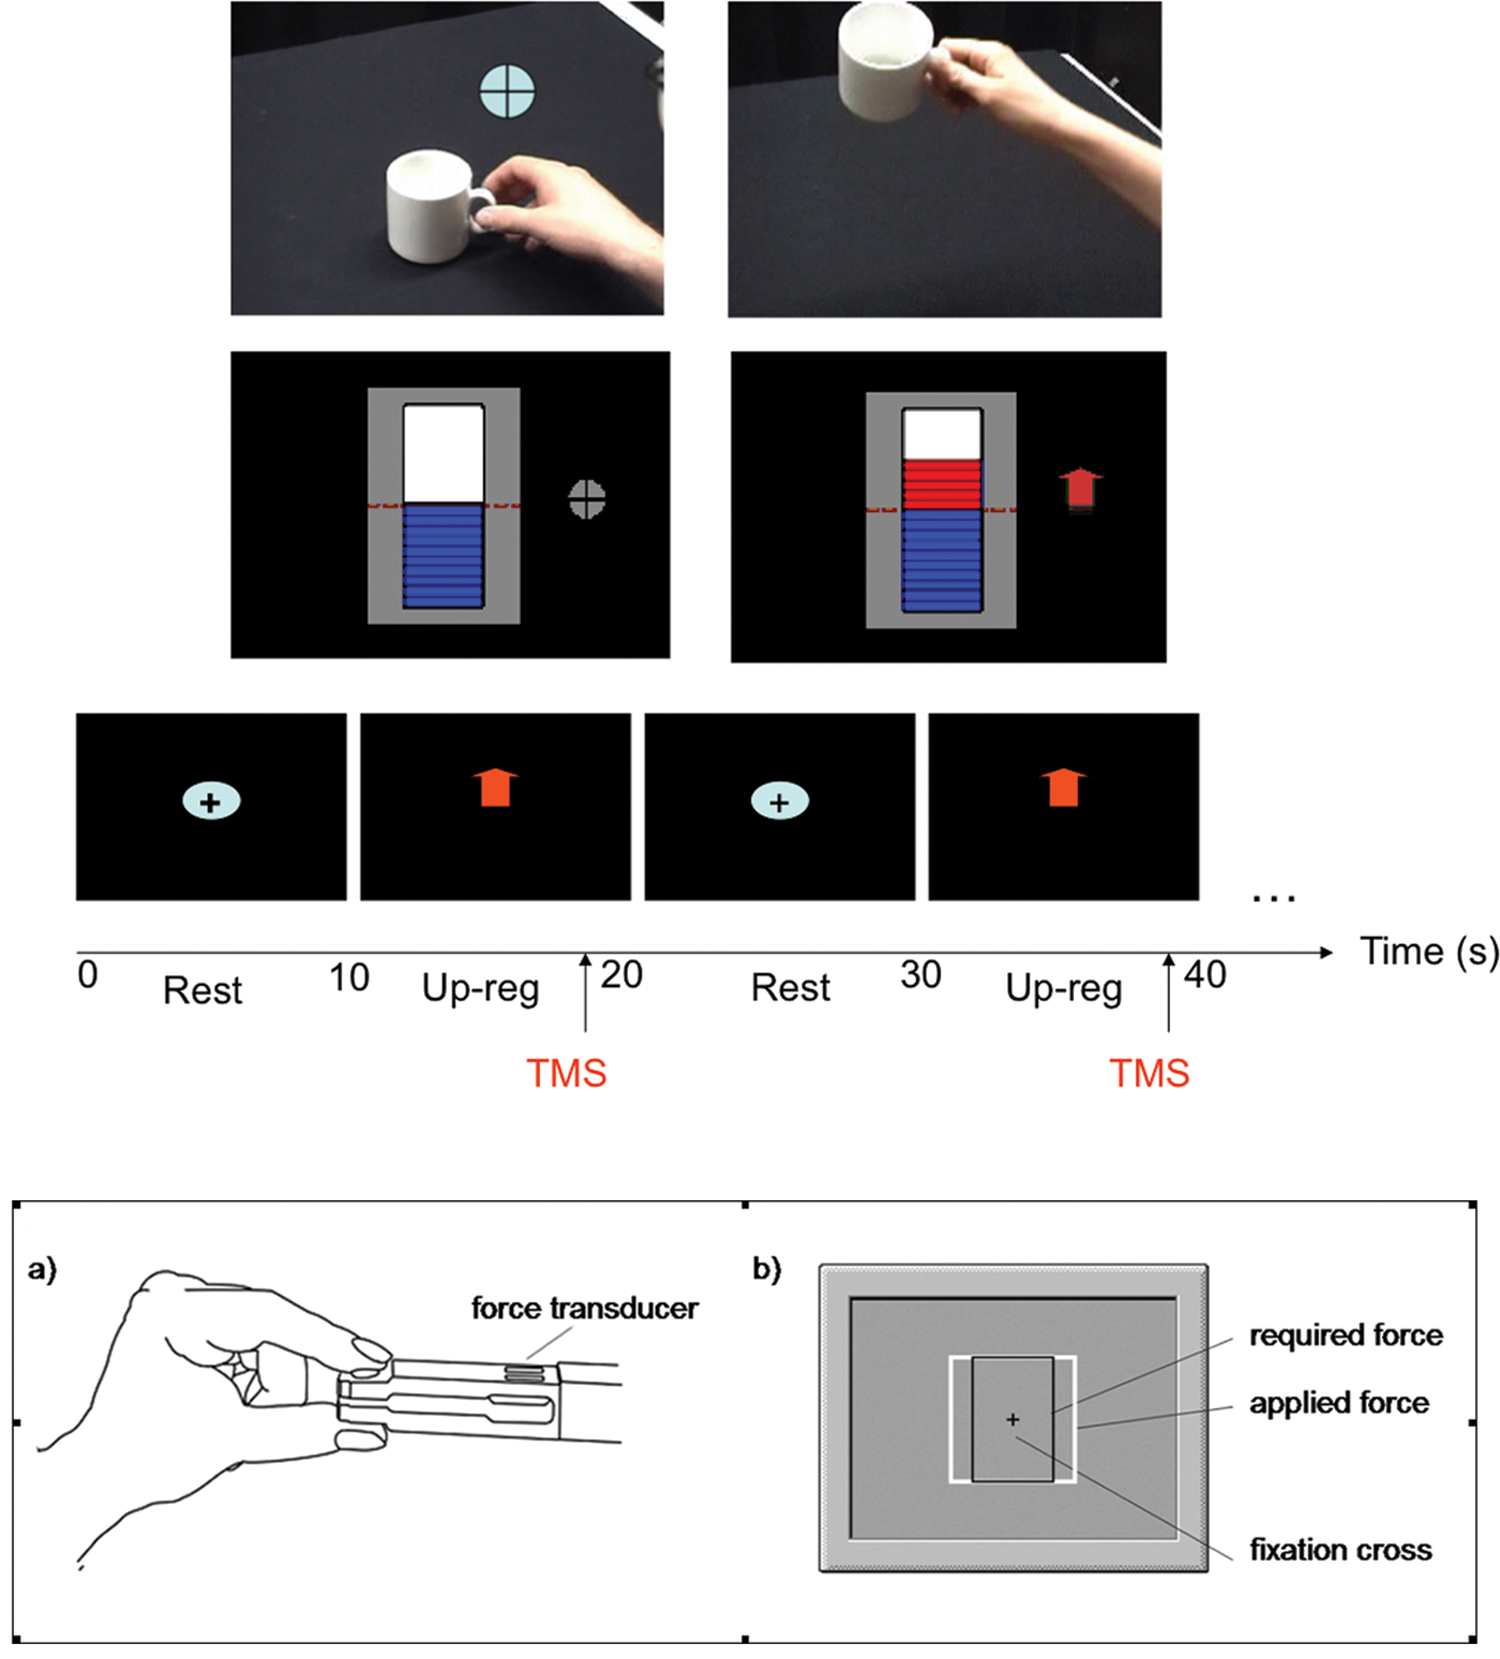
FMRI-BCI feedback methods and TMS protocol employed in the study. (A) Real-time video feedback of first-perspective perspective of a coffee cup. A fixation cross indicated the resting condition (left panel), and the disappearance of the fixation cross signaled the onset of the upregulation block during which period the video was advanced in frames (right panel) proportional to the percent BOLD signal change in the PMv. (B) Real-time thermometer feedback. A fixation cross indicated the resting condition (left panel), and the up-arrow indicated the upregulation condition during which the increase or decrease of the thermometer bars was shown proportional to the percent BOLD signal change in the PMv. Feedback was updated at an interval of 1.5 seconds in both cases. (C) TMS cortical excitability posttest protocol outside the scanner. Rest and upregulation conditions (10 seconds each) were signaled by the fixation cross and the up-arrow, respectively. Twin TMS pulses for measuring ICI and ICF were applied in the upregulation conditions as indicated in the figure. (D) Illustration of the visuomotor tracking task. Abbreviations: fMRI-BCI, functional magnetic resonance imaging brain–computer interface; TMS, transcranial magnetic stimulation; BOLD, blood oxygenation level dependent response; PMv, ventral premotor cortex; ICI, intracortical inhibition; ICF, intracortical facilitation.
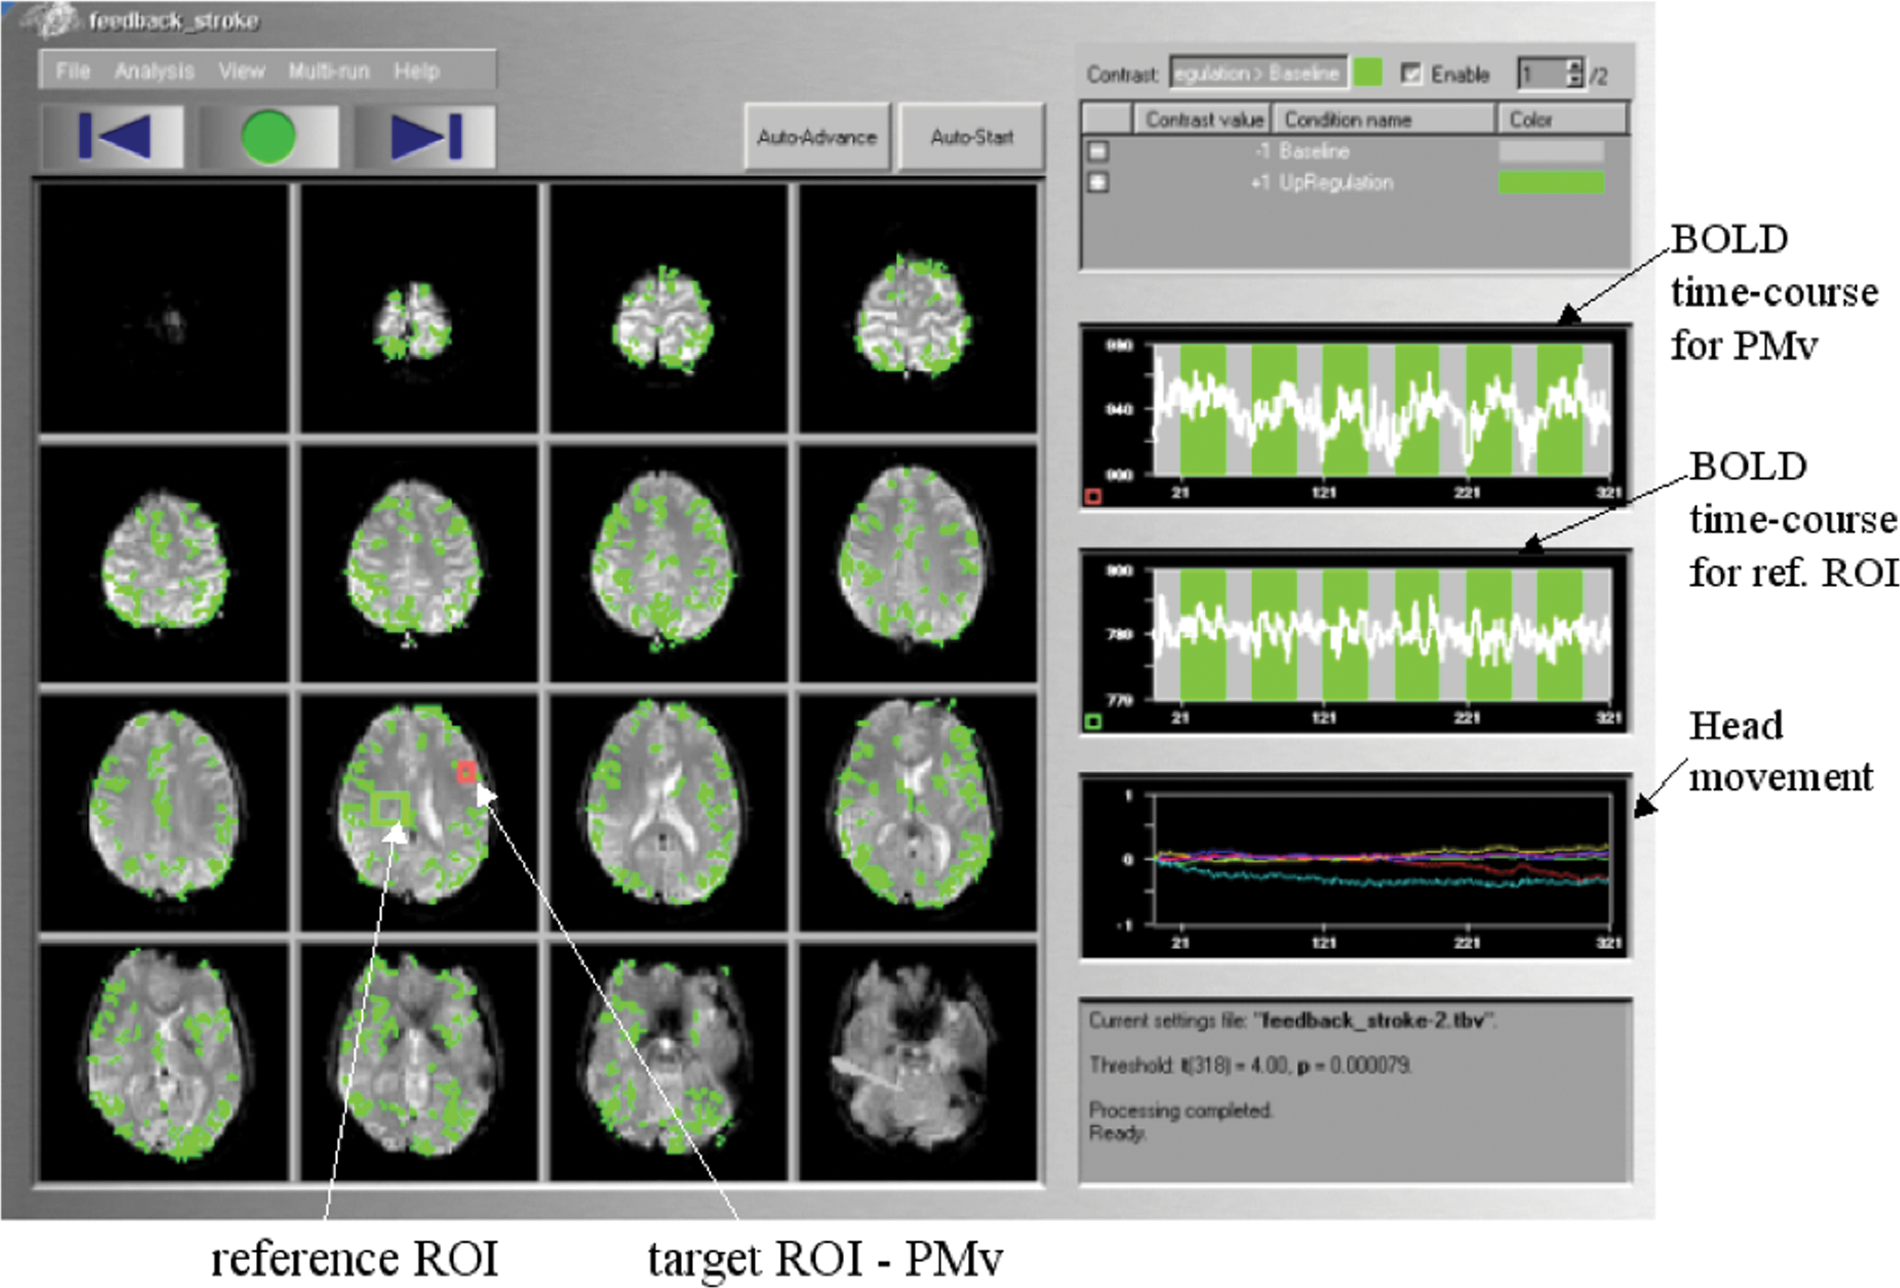
Real-time functional maps during self-regulation of the left ventral premotor cortex (PMv). Functional maps are displayed using the Turbo Brain Voyager software (TBV; Brain Innovations, Maastricht, the Netherlands). On the left panel statistical maps of brain activations are on 16 slices of the echo planar imaging sequence (EPI). The upper and middle right panels show the blood oxygenation level dependent (BOLD) times courses of region of interest (ROI) 1 and ROI 2, respectively. Blocks of PMv upregulation (green bars) are alternated with blocks of rest (gray bars). Lower right hand panel displays head motion in terms of 3 translation and 3 rotation time courses.
Functional images were obtained on a 3T whole body scanner, with a standard 12-channels head coil (Magnetom Tim TRIO, Siemens, Erlangen, Germany). An echo-planar imaging sequence with the following parameters was used: EPI; TR = 1.5 seconds, matrix size = 64 × 64, TE = 30 ms, flip angle α = 70°, bandwidth = 1.954 kHz/pixel. Sixteen oblique slices (voxel size = 3.3 × 3.3 × 5.0 mm3, slice gap = 1 mm), AC/PC aligned in axial orientation, were acquired. The real-time EPI was programmed in-house6,22 to enable real-time export of functional images to the hard disk of the fMRI-BCI computer at the end of each TR period (1.5 seconds) so that the images could be subsequently analyzed in real time. For superposition of functional maps on brain anatomy, a high-resolution T1-weighted structural scan of the whole brain was collected from each participant (MPRAGE, matrix size = 256 × 256, 160 partitions, 1 mm3 isotropic voxels, TR = 2300 ms, TE = 3.93 ms, TI = 1100 ms, α = 8°).
Feedback was presented in 2 different visual forms: (a) video feedback, which presented a first-person view, similar to the functional localizer, during which the coffee cup was moved toward the mouth of the person holding it, by advancing picture frames proportional to the increase in the feedback signal (see Figure 1A), and (b) thermometer feedback in which the temperature bars increased or decreased from the central baseline (red dashed line) proportional to the feedback signal (Figure 1B). Video feedback was used in the first 1 or 2 runs of each day’s training for each participant as an intuitive and engaging method to develop and maintain interest in the experimental paradigm. The thermometer feedback was used in the later stages of the feedback training as a neutral feedback modality that avoided the action observation that video feedback elicits and also for stabilization of the learning process.
Feedback Training
In both video and thermometer feedback scenarios, baseline blocks lasted 30 seconds and activation blocks lasted 45 seconds. Each training run included 6 baseline and 6 activation blocks. In the video feedback scenario, the subject saw a fixation cross on a static picture of a hand holding a coffee cup during the baseline (Figure 1A). The beginning of a self-regulation block (activation block) was indicated by the disappearance of the fixation cross. In the thermometer feedback scenario, subjects saw a fixation cross next to the thermometer during the baseline blocks (Figure 1B) and a red arrow pointing upward next to the thermometer during the activation blocks. During the first feedback training session subjects were encouraged to explore different strategies to find one that resulted in a contingent feedback output. They were then asked to use the most successful individual strategy throughout the remaining fMRI-BCI training sessions.
To explore the efficacy of transfer of the learnt ability to regulate for subsequent clinical rehabilitation without feedback outside the scanner, we tested whether subjects could regulate PMv activity without contingent feedback. In this transfer scenario, subjects saw the outline of the thermometer but no moving bars during self-regulation. Baseline and activation blocks were indicated by a fixation cross and red arrow, respectively.
On the first day of feedback training for each subject, self-regulation of PMv activity was trained with 2 runs of the video feedback and 2 runs of the thermometer feedback scenarios. On the second and third days, subjects were trained with 1 run of the video feedback scenario, 2 runs of the thermometer feedback scenario, and 1 run of the transfer scenario.
Intracortical Inhibition and Facilitation
Prior to the rtfMRI feedback training resting motor threshold (rMT), recruitment curves (RCs) and intracortical excitability were determined for each participant seated in an armchair. Electromyographic (EMG) activity was recorded from the first dorsal interosseous (FDI) muscle of the right hand through 2 surface electrodes positioned in a belly-tendon montage. RCs, measured as increases in MEP amplitude intensity of single TMS pulses,26,27 were obtained to evaluate the strength of corticospinal connections. Intracortical excitability was evaluated by a paired-pulse paradigm at rest. Short-interval ICI was investigated at an interstimulus interval (ISI) of 3 ms between a conditioning stimulus and a test stimulus. ICF was investigated at an ISI of 10 ms. Conditioning stimulus intensity was set to 80% rMT, and test stimulus intensity was set to 120% rMT. Single TMS pulses were applied at 120% rMT to evoke unconditioned MEPs. Forty-five trials were measured in randomized order (15 trials of each ICI, ICF, test pulse) both before (pretest) and after (posttest) feedback training. After the feedback training, intracortical excitability was also investigated while participants modulated their cortical activity as learned during the rtfMRI feedback training. For this measurement, participants sat about 100 cm in front of a 20-in. computer screen. A 10-second display of a fixation cross on a black background was alternated with a 10-second display of a red arrow on a black background for a total of 45 “arrow” trials (Figure 1B). Participants were instructed to relax during the fixation cross display and to modulate PMv activity as learned during the feedback training during the arrow display. TMS pulses were applied in randomized order at varying timings within the last 3 seconds of the arrow display (Figure 1C).
Visuomotor Behavioral Task
Participants performed a pinch-force task before and after rtfMRI feedback training. Each participant sat comfortably in an arm-chair about 100 cm in front of a 20-in. computer monitor and held a force transducer between the right thumb and index finger. Participants saw 2 rectangles on the computer screen: a stationary black rectangle and a white rectangle that was moving outward and inward in a sinusoidal fashion (Figure 1D, right panel). Participants could manipulate the size of the white rectangle by applying force to the transducer. The task was to overlay the 2 rectangles by constantly adjusting the force applied to the force transducer.
Before the rtfMRI feedback training, participants performed the pinch-force task 6 times for 2 minutes. In between each 2-minute run, participants were allowed to relax for at least 2 minutes. After the rtfMRI feedback training, participants performed 8 runs of 2 minutes of the pinch-force task. During the fourth and sixth runs, participants were instructed to alternate between imagery of the strategy (10 seconds) and performance of the pinch-force task (10 seconds). All data were acquired using a signal amplifier and Neuroscan software (Compumedics, El Paso, TX).
Data Analysis
The fMRI data were analyzed off-line using statistical parametric mapping software (SPM2, Wellcome Department of Imaging Neuroscience, London, UK; http://www.fil.ion.ucl.ac.uk/spm) implemented in Matlab (Mathworks, Inc, Sherborn, MA). The functional images were coregistered with the anatomic images realigned, normalized, and smoothed (width of Gaussian filter = 8 mm). For each participant, self-regulation versus baseline contrasts for the main effect of each feedback scenario were calculated and brain activity present at a height threshold of at least P < .05 (FWE corrected) was superimposed on the MNI single-participant brain template. Single-participant mean signal change (%) of the PMv was calculated for each of the training days by extracting the signal change data from local maxima within the PMv. Because of the small sample size (4 healthy young adults and 2 stroke patients), no group analysis was performed on the rtfMRI data.
To analyze intracortical excitability, peak-to-peak amplitudes of the MEPs were calculated. Trials with EMG activity before magnetic stimulation were not included in the analysis. For each participant, the MEP amplitudes from the intracortical excitability measurements were sorted according to stimulation condition (ICI, ICF, single pulse) and the mean MEP amplitudes were determined. Subsequently, ICI and ICF mean MEP amplitudes were expressed as the percentage of the single-pulse mean MEP amplitude.
Results
FMRI-BCI Data
See Figure 3.
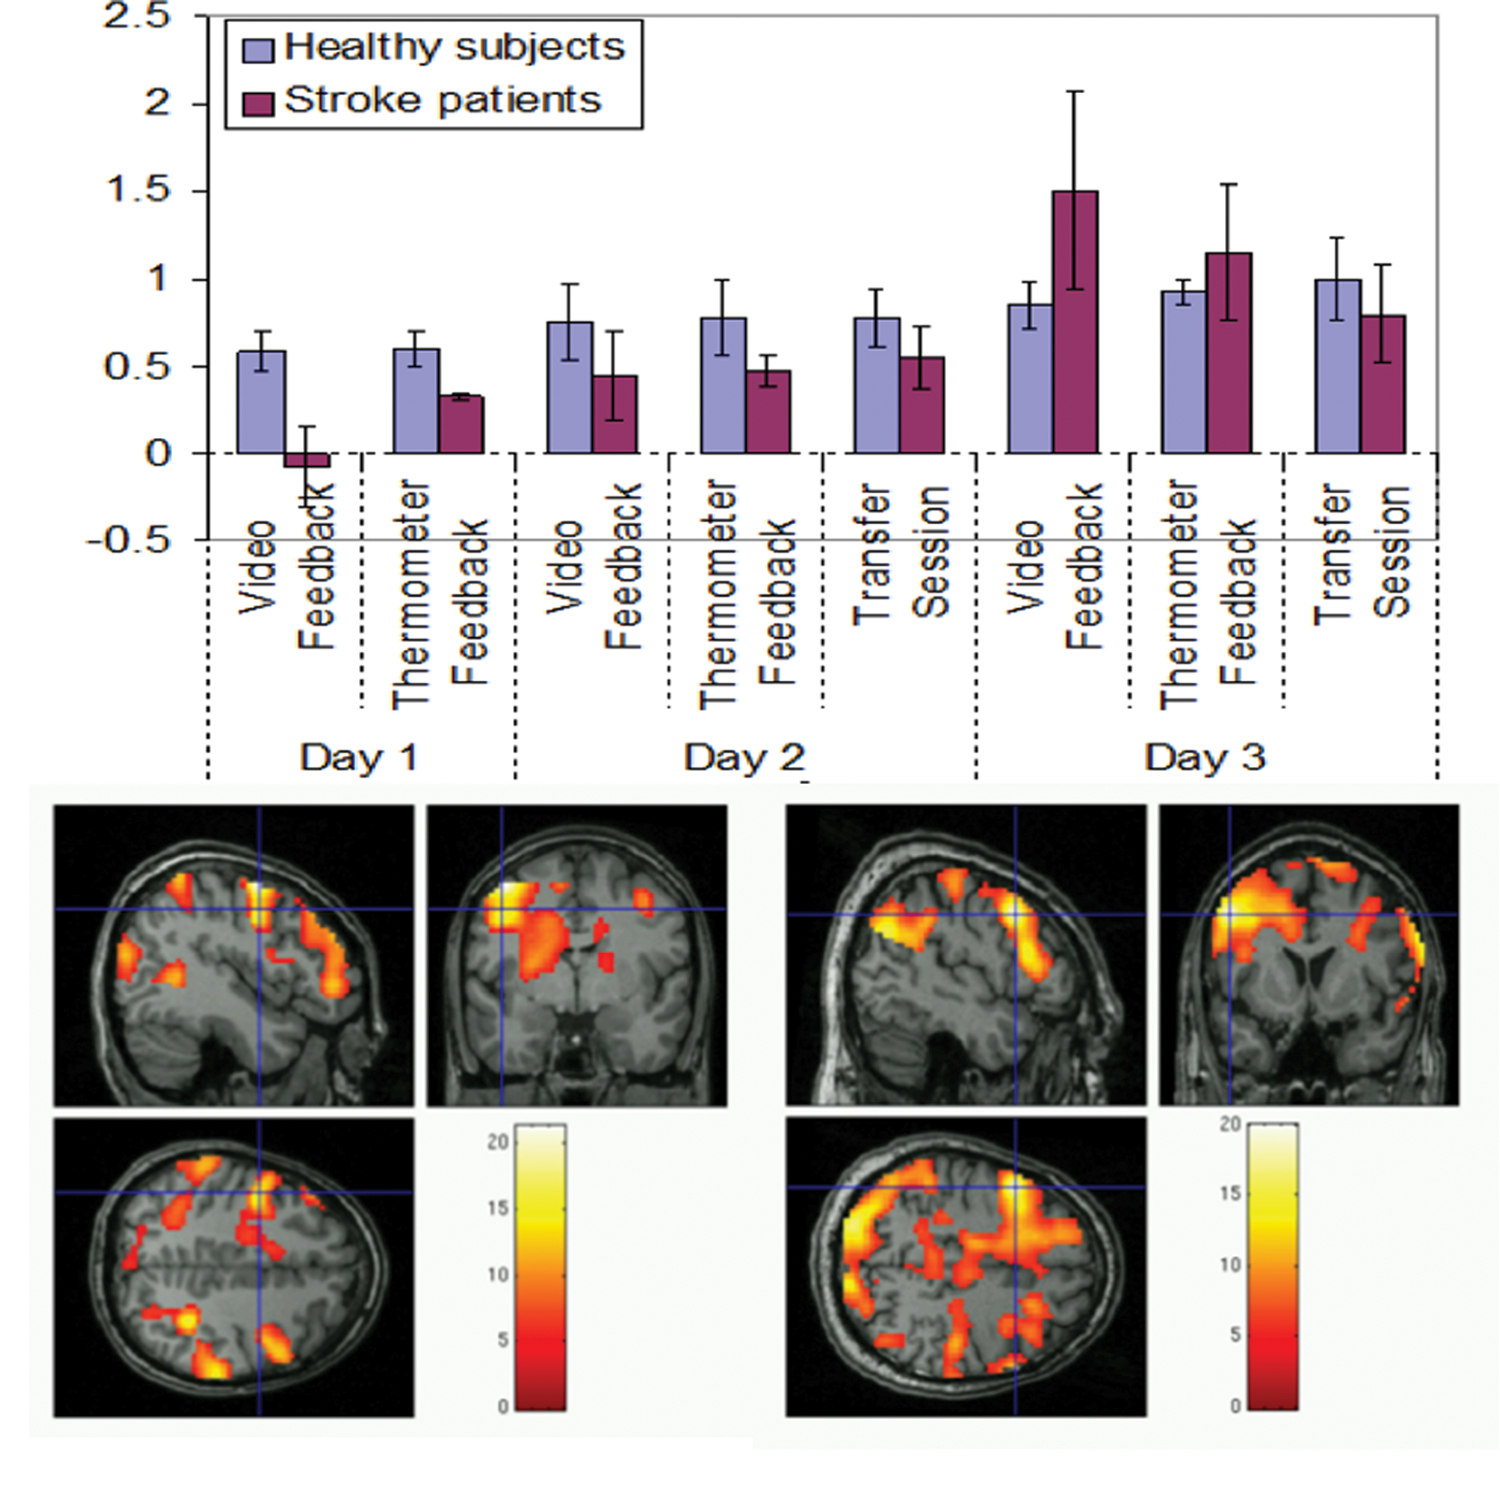
(A) Results of region of interest analysis. Bar chart shows the mean percent BOLD increase in the video feedback, thermometer feedback, and transfer scenarios for 3 days of training for healthy participants and stroke patients, separately. (B and C) Brain activations during thermometer feedback for a healthy participant (participant H-FB, “B”) and stroke patient (participant P-DS, “C”)
Region of Interest Analysis
Participants demonstrated a progressive increase of the BOLD signal in the PMv over 8 sessions in 3 days of feedback training (Figure 3A). Linear regression analysis between percent BOLD and feedback sessions showed an enhancement of activity in both the healthy participants (y = .0573x + .525, R2 = .95) and stroke patients (y = .160x − .075, R2 = .63), indicating learning (data showed normal distribution as indicated by the nonsignificant Kolmogorov–Smirnov test, P = .16, and Shapiro–Wilks test, P = .09). Participants increased activity during upregulation in the video feedback (paired sample t test, P < .03) and thermometer feedback (paired sample t test, P < .03) sessions of day 3 compared with the corresponding sessions of day 1. All participants had an increase in the percent BOLD signal during upregulation in the transfer session of day 3 compared with the feedback sessions of day 1 (paired sample t test, P < .025).
Whole-Brain Analysis
Common areas of activation during the upregulation condition in the participants included bilateral PMv, bilateral SMA, bilateral somatosensory cortex, bilateral medial frontal gyri, bilateral inferior frontal gyri, and bilateral occipital gyri (Table 1 and Figure 3B and C). Other areas that were activated to varying extents across the participants were bilateral dorsal premotor cortex (PMd), bilateral M1, and bilateral inferior and superior temporal gyrus. More than 1 local maxima in the PMv were observed in some participants, and different parts of the PMv were maximally activated in different participants.
Activated Brain Areas and the Local Maxima of Left PMv During Video and Thermometer Feedback Training and Transfer Sessions in Healthy Individuals (H1-H4) and Stroke Patients (P1 and P2)
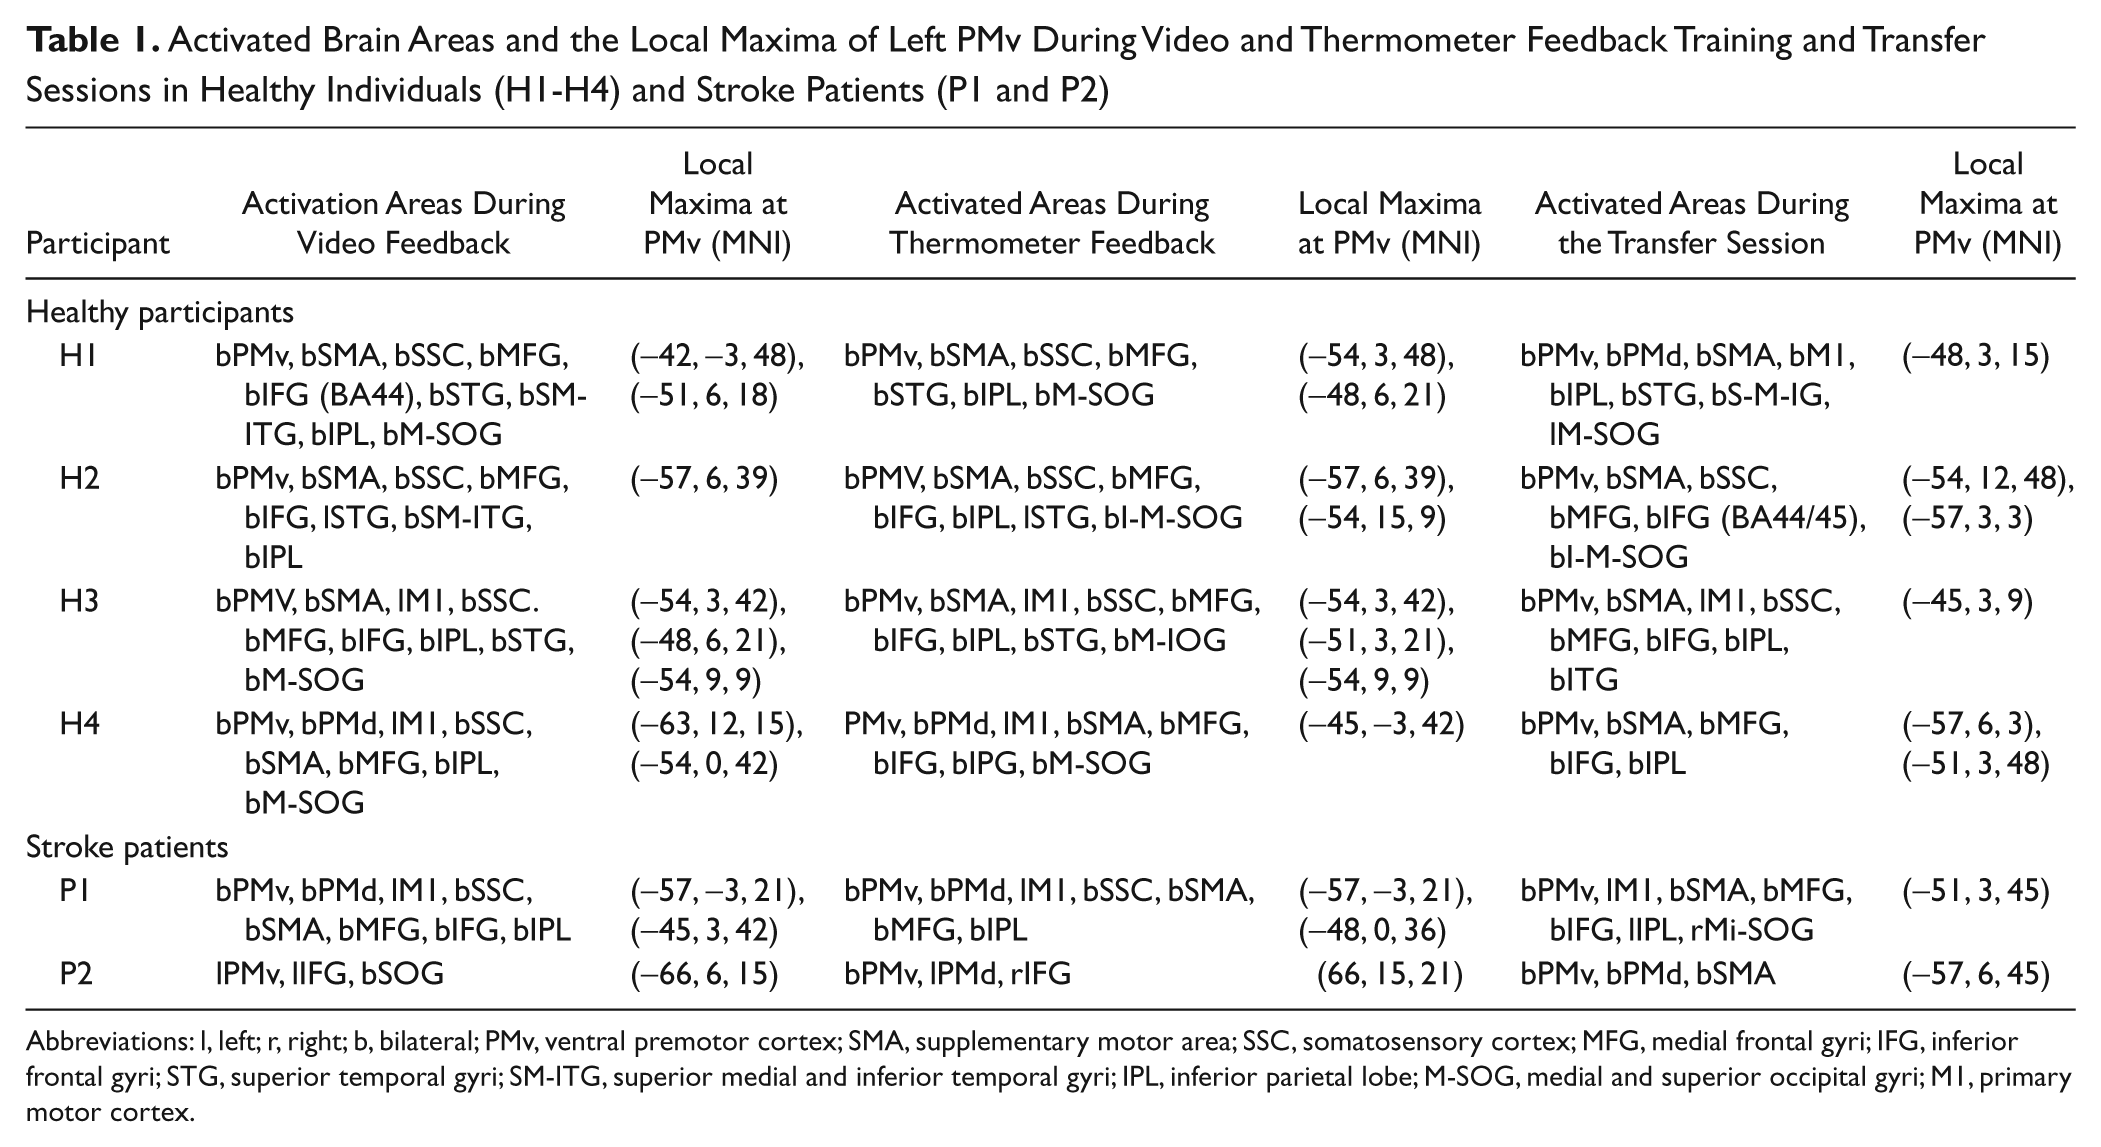
Abbreviations: l, left; r, right; b, bilateral; PMv, ventral premotor cortex; SMA, supplementary motor area; SSC, somatosensory cortex; MFG, medial frontal gyri; IFG, inferior frontal gyri; STG, superior temporal gyri; SM-ITG, superior medial and inferior temporal gyri; IPL, inferior parietal lobe; M-SOG, medial and superior occipital gyri; M1, primary motor cortex.
TMS Analysis
Pretraining and posttraining measurements of rMT in healthy subjects showed slightly higher (not significant) mean pretraining thresholds (42.3 ± 1.1%) than the posttraining thresholds (40.5 ± 0.3%). In the 2 stroke patients, no significant difference was found between the pretraining (39.5) and posttraining rMT values (40.5). No significant differences were observed for any of the subjects between the pretraining and posttraining RCs for MEP amplitudes at varying intensities of TMS test stimuli (100% to 150% of motor threshold, MT).
We evaluated the relation between cortical excitability (ICI/ICF) measured at rest in all participants before fMRI-BCI feedback training and the mean percent BOLD increase in each participant during the upregulation blocks (Figure 4A). A negative correlation (Spearman correlation coefficient, r = −.48, df = 6, P = .2) was found between ICI at rest and mean percent BOLD increase across participants. In addition, a positive correlation (Spearman correlation coefficient, r = .71, df = 6, P = .1) was found between ICF measured at rest before fMRI-BCI training and the mean percent BOLD increase in each participant during the upregulation blocks (Figure 4B). These results suggest that lower ICI and higher facilitation predict greater success in learning to regulate the PMv. Stroke patients showed higher ICI at rest (mean = 80.9 ± 10.2) than the healthy participants (mean = 31.1 ± 5.1) before fMRI-BCI training. Mean ICF (140.2 ± 15.3) in stroke patients was slightly higher than healthy participants (122.5 ± 15.5).
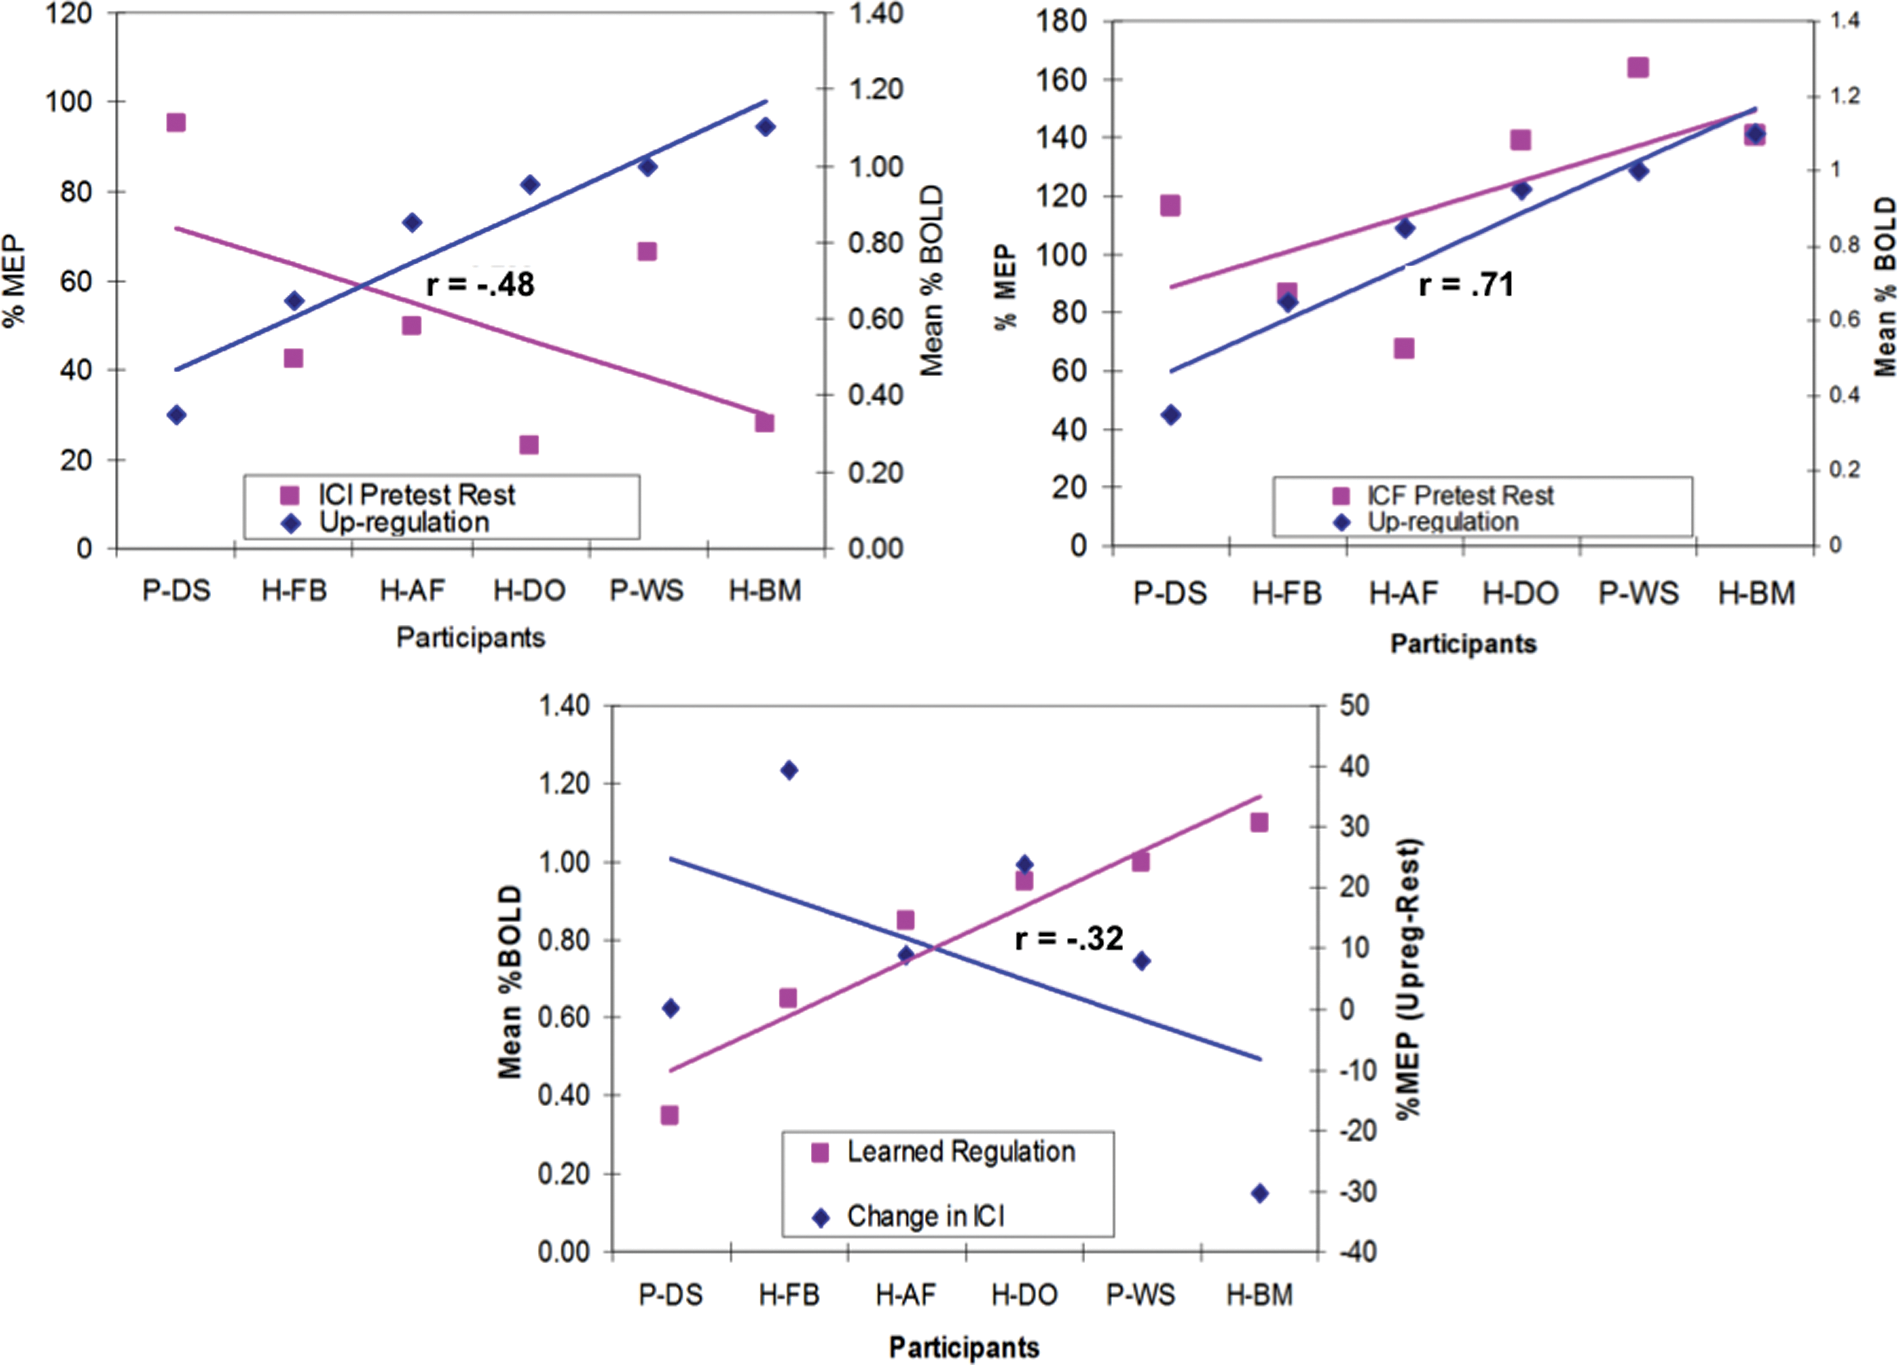
Results of TMS analysis. (A) Intracortical inhibition (ICI) measured at rest in all the participants prior to the feedback training is negatively correlated with the mean percent blood oxygenation level dependent (BOLD) increase in the ventral premotor cortex (PMv; Spearman correlation coefficient, r = −.48). (B) Intracortical facilitation (ICF) measured at rest in all the participants prior to the feedback training is positively correlated with the mean percent BOLD increase in the PMv (Spearman correlation coefficient, r =.71). (C) Mean percent upregulation of the BOLD in the PMv in all participants during the transfer session on day 3 is positively correlated with the reduction in the ICI (Spearman correlation coefficient, r =−.32).
We assessed the effect of participants’ learned ability to self-regulate the PMv and the changes in ICI/ICF from pretest to posttest. We used the percent BOLD increase during the transfer sessions as a comparative measure, as ICI and ICF were measured in the posttest outside the scanner, in the absence of real-time contingent feedback (Figure 1C). A negative correlation (Spearman correlation coefficient, r = −.32, df = 6, P = .1) was found between the percent BOLD change and the difference between the ICI measures between the posttest and pretest (see Figure 4C). A positive correlation (Spearman correlation coefficient, r = .25, df = 6, P = .2), although lower, was found between the percent BOLD change and the difference in the ICF measures between posttest and pretest. The above results indicate that learned upregulation of the BOLD signal in the PMv helps decrease ICI and may enhance facilitation.
Visuomotor Task
Visuomotor performance was quantified by the tracking error, expressed in arbitrary units (au). The analyses of the behavioral task revealed a difference of the performance of the visuomotor task between trials in which the subjects were asked to modulate PMv activity compared with control trials. Smaller values of tracking error corresponded to better performance (modulation PMv = 669 ± 63; task only = 707 ± 48). There were 2 nonresponders on the behavioral level (1 patient and 1 control).
Discussion
In this exploratory study, we exploit real-time fMRI 1 to study the effect of volitional regulation of a circumscribed region of the motor cortex to explore its potential utility for stroke rehabilitation. Using this innovative technology, signals from a brain region, namely, the ventral premotor cortex involved in action observation and motor planning, were extracted and processed to provide online visual feedback to healthy participants and stroke patients. Combining this technology with video feedback of first-person view of the participant drinking a cup of coffee, we trained healthy individuals and stroke patients to volitionally increase the BOLD signal of the PMv in 3 sessions per day for 3 days. We also incorporated a graphically animated thermometer as a form of feedback and transfer sessions in the absence of feedback to stabilize the learning process. With the aim to evaluate the neurophysiological effect of upregulation of the PMv, we measured ICI and facilitation before and after the fMRI-BCI feedback training using TMS in a paired pulse paradigm.
Our study provides the first evidence that both healthy individuals and stroke patients can learn to modulate the BOLD signal of the PMv. Participants showed a progressive increase of the BOLD signal in PMv over the 3 days of feedback training, indicating a learned self-regulation. Healthy participants showed a larger magnitude of rtfMRI training-induced BOLD changes, which may correspond to more pronounced learning ability than after stroke.
By comparing the patterns of mean percent BOLD signal change of different local activation maxima in the left PMv, the percent signal change was found not to be homogeneous across these local maxima in individuals, perhaps because the PMv is somatotopically organized. 28 Whether differential BOLD signal modulation within the PMv itself has any impact on behavioral and neurophysiological effects of the feedback training is currently unclear.
During the feedback training of the left PMv, all participants showed bilateral PMv activation, with some showing stronger right PMv activation. This pattern may seem paradoxical, because participants were specifically instructed to image right hand actions only. Bilateral PMv activation was found in prior studies during precision grasping23,29 and object manipulation. 24 Two studies demonstrated ipsilateral finger representations in the PMv.30,31 Also, bilateral activation of the PMv during precision grasping was confirmed by a TMS study, 32 suggesting that both PMv are active during an early phase of movement preparation. According to this suggestion, the persistent bilateral PMv activation observed throughout the rtfMRI feedback training could be due to an early planning/programming component of the imaged action. However, the role of the observed bilateral PMv activation for the outcome of the feedback training is unclear.
Analysis of TMS data provided 3 important insights. Cortical excitability was increased in stroke patients with reduced ICI and increased ICF, as other reports of subcortical stroke. 33 Second, in all participants, baseline ICI and ICF strongly correlated with the ability to self-regulate the PMv. Low ICI or high ICF predicted higher capability for self-regulation of the BOLD signal in the PMv in all subjects. These results are important for stroke rehabilitation in light of the finding that the time-course of a decline in ICI after subcortical stroke followed the gain in motor recovery. 20 Third, after prolonged fMRI-BCI feedback training, the learned ability to upregulate the PMv might change cortical excitability by decreasing ICI and increasing ICF. Our results are also consistent with the findings from studies with macaque monkeys that stimulation of PMv facilitates outputs from the M1.34,35 Although, these results support our original hypothesis that upregulation of the PMv facilitates motor cortical output from the M1, we suggest caution because of the small number of patients.
A drawback of the TMS protocol we used for measuring M1 excitability is that it is unknown which brain structures actually caused the excitability change. Thus, we cannot exclude that self-regulation-related excitability changes occurred also in the M1 rather than PMv activity modulating M1 excitability. Although changes in M1 excitability seem at least in part caused by an increase in brain activity in the PMv, testing the interaction of the PMv and the M1 requires a different TMS protocol.34,35 The fact that mean posttraining ICF values for the controls slightly decreased during the modulation condition compared with baseline does not contradict the notion that PMv modulation may increase M1 excitability. ICI and ICF are mediated by different local neuronal circuits by different neurotransmitter systems and can thus show different behavior during the modulation of cortical activity. 19 However, this difference is also likely to be caused by the age difference in the 2 groups.
The behavioral data provide first promising hints toward an improvement in a visuomotor tracking task, a task in which the PMv is significantly involved. We found 1 healthy subject and 1 patient who did not behaviorally respond; however, a larger sample of participants are necessary to address whether self-modulation of the PMv acquired by feedback training might have a behavioral effect on tasks processed by the PMv.
Overall, the results of this exploratory study are promising and provide a basis for the use of real-time fMRI-BCI for stroke rehabilitation, perhaps using portable and more feasible hemodynamic BCIs1,36 with near infrared spectroscopy.
Footnotes
The author(s) declared no potential conflicts of interest with respect to the research, authorship, and/or publication of this article.
The author(s) disclosed receipt of the following financial support for the research, authorship, and/or publication of this article: This work was supported by the Deutsche Forschungsgemeinschaft, the European Union Marie Curie Host Fellowship for Early Stage Researchers Training, Bundesministerium für Bildung und Forschung Bernstein project number 01GQ0761 and grants from the Deutsche Forschungsgemeinschaft DFG BI 195/59-1 and DFG BI 195/56-1. Author FCH was supported by a grant from the Werner-Otto Foundation (7/73).