
Abstract
Introduction
Various machine learning models and features have been proposed for lymphoma diagnosis using 18F-fluorodeoxyglucose (18F-FDG) PET/CT radiomics. This research aimed to systematically evaluate the diagnostic value of 18F-FDG PET/CT radiomics in lymphoma by conducting a meta-analysis.
Methods
Data from published studies regarding the diagnosis of lymphoma using 18F-FDG PET/CT radiomics, from January 2010 to July 2024, were gathered from PubMed, Web of Science, and the Cochrane Library. Following their separate searches and screenings of the literature, two researchers extracted data and assessed the caliber of all the included studies. The quality assessment involved the Quality Assessment of Diagnostic Accuracy Studies 2 (QUADAS-2), the Radiomics Quality Score (RQS), and the METhodological RadiomICs Score (METRICS). The meta-analysis was conducted by using RevMan 5.4.1, R 4.4.0, and Stata 17.0 software. Six meta-regressions were conducted on study performance, considering sample size, image modality, region of interest (ROI) selection, ROI segmentation, radiomics mode, and algorithms.
Results
In total, 20 studies classified as type 2a or above according to the Transparent Reporting of a Multivariable Prediction Model for Individual Prognosis or Diagnosis (TRIPOD) statement were included for this systematic review and meta-analysis. The studies achieved an average RQS of 13 (ranging from 10 to 17), accounting for 36.1% of the total points. The average METRICS score was 69.3% (ranging from 54.8% to 80.9%). The quality category of the studies is mainly “good”. The results of our meta-analysis showed that the pooled sensitivity (SEN), specificity (SPE), positive likelihood ratio, negative likelihood ratio and diagnostic odds ratio with 95% confidence interval (CI) were 0.82 (0.78, 0.88), 0.83 (0.76, 0.87), 4.7 (3.4, 6.6), 0.20 (0.15, 0.28) and 23 (13, 42), respectively. The area under the curve of the summary receiver operating characteristic curve was 0.90 (0.87, 0.92). The results of Spearman correlation analysis revealed no threshold effect among the studies (P = .423). Significant heterogeneity was observed among the studies (overall I2 = 83.7%; 95% CI: 76.0, 88.9; P < .01). Meta-regressions indicated that sample size and ROI selection contributed to the heterogeneity in SEN, while algorithms affected the heterogeneity in SPE (P < .05). Deeks’ test confirmed there was no significant publication bias in all the included studies. The Fagan nomogram showed an absolute increase of 34% in the post-test probability following a positive test result.
Conclusion
The results supported that 18F-FDG PET/CT radiomics has high diagnostic value for lymphoma. However, there is high heterogeneity among different studies. In the future, clinical practicality needs to be substantiated by more prospective studies with rigorous adherence to existing guidelines and multicentric validation.
Introduction
Lymphoma is a highly heterogeneous hematological malignancy that can affect any organ in the body. Biopsy remains the gold standard for lymphoma diagnosis, although it cannot provide the whole situation of the tumor and only yields limited information. Therefore, efficient and non-invasive diagnostic indicators still have important clinical significance in evaluating individual disease risk.1,2 18F-fluorodeoxyglucose (18F-FDG) PET/CT is an important imaging evaluation technique in the diagnosis of lymphoma, which helps identify the anatomy and quantify the metabolic characteristics of highly invasive lymphomas.3,4 The clinical application of 18F-FDG PET/CT is growing daily as living standards rise, but its limitations are also gradually exposed: routine examinations often reveal the same disease, but images differ because of the high tumor heterogeneity, which lowers the diagnostic accuracy of lymphoma.
In recent years, radiomics has emerged with the evolution of computer hardware and image analysis technology. Its advantage lies in obtaining a large number of image features that are difficult to distinguish by the naked eyes through automated algorithms and quantifying them into numerical data to increase the accuracy and efficiency of image diagnosis. This technology is expected to reduce subjective errors caused by differences in physician experience and assist in achieving precision medicine.5,6 In previous studies, 18F-FDG PET/CT radiomics performed well in the diagnosis and prognosis prediction of lymphoma, offering direction for treatment plan development and prognosis evaluation.7-9 However, the results differ significantly because varying study methodologies were used. Consequently, this study aimed to systematically evaluate the diagnostic value of 18F-FDG PET/CT radiomics for lymphoma, and our results can be used as reference for subsequent research.
Materials and Methods
Protocol and Registration
This study was conducted in accordance with the Preferred Reporting Items for a Systematic Review and Meta-analysis of Diagnostic Test Accuracy Studies guidelines (PRISMA-DTA). 10 The study protocol was prospectively registered with PROSPERO (CRD42025640732) https://www.crd.york.ac.uk/prospero/.
Literature Search
Computer searches were performed on PubMed, Web of Science, and the Cochrane Library databases to find relevant research on the diagnosis or differential diagnosis of lymphoma based on 18F-FDG PET/CT radiomics features. The search period was from January 1, 2010 to July 30, 2024. The literature search adopted a combination of subject words and free words, modifying its approach based on the characteristics of each database. The English search terms included PET/CT, radiomics, machine learning, lymphoma, and diagnosis. The search strategy was as follows: (“radiomics” OR “machine learning” OR “artificial intelligence” OR “deep learning” OR “texture analysis”) AND (lymphoma OR DLBCL) AND (PET/CT OR “positron emission tomography”) AND (diagnose OR diagnosis OR diagnosing OR diagnostic) AND (distinguish OR classification OR differentiation OR differential). Additionally, the references included in the research were simultaneously retrieved to supplement relevant information.
Literature Screening
Inclusion criteria: (1) Research on the diagnosis or differential diagnosis of lymphoma based on 18F-FDG PET/CT radiomics; (2) diagnostic outcomes, including true positive (TP), false positive (FP), false negative (FN), and true negative (TN), can be acquired directly or indirectly from scholarly literature; and (3) researches classified as type 2a or above according to Transparent Reporting of a Multivariable Prediction Model for Individual Prognosis or Diagnosis (TRIPOD) statement. 11
Exclusion criteria: (1) Non-English literature; (2) the number of lymphoma cases or lesions included in the literature is less than 10; (3) literature lacking sufficient data or unable to extract data; and (4) studies in the form of letters, conference abstracts, editorials, reviews, case reports and duplicates.
Two researchers conducted independent literature screening, data extractions, and cross-checks. For any discrepancies, they were worked out through discussion or consultation with a senior physician. When screening literature, researchers read the article title first and then read the abstract and entire article to decide whether to include them after removing material that was blatantly unrelated.
Data Extraction
Data extraction was performed systematically using a data extraction form for each full-text publication: (1) fundamental study information, such as first author, publication year, diagnostic subjects, and sample size. (2) Radiomics analysis: region of interest (ROI) used for feature extraction, machine learning models, and texture features with the best diagnostic performance. If the research subjects were split into training and validation sets, only the validation set was included as the outcome indicator to maintain data integrity, reduce bias, and provide a more accurate assessment of model performance.12,13 When more than one model was employed concurrently in a study, only the model's outcome metric with the highest area under the curve (AUC) was selected. If the AUC was not provided, the model with the highest Youden index was chosen. For research convenience, the same literature could be split into several separate studies for data extraction if it simultaneously separated lymphoma from numerous other lesions. (3) Directly obtained or indirectly calculated outcome measures: TP, FP, FN, and TN. 14
Quality Assessment
The quality of the literature included in this study was assessed independently by two academics, who also cross-checked the findings. The risk of bias and concerns regarding applicability questions of all included studies were assessed with the Quality Assessment of Diagnostic Accuracy Studies 2 (QUADAS-2). 15 This tool includes four domains in terms of risk of bias (patient selection, index test, reference standard, as well as flow and timing) and three domains in terms of applicability concerns (patient selection, index test, and reference standard). Each domain of risk of bias and concerns about applicability is rated as low, high, or unclear.
Additionally, the radiomics quality score (RQS) 6 and METhodological RadiomICs Score (METRICS), 16 instruments developed specifically for radiomics studies, were applied to assess the methodological quality of the included studies. The RQS comprises 16 essential components, with each research allocated a certain number of points per component, yielding a total score ranging from −8 to 36, where −8 to 0 is defined as 0% and 36 is defined as 100%. The METRICS is a checklist-based framework that includes 30 items over 9 categories, and each item is assigned a different weight based on the completeness of reporting and methodological rigor (https://metricsscore.github.io/metrics/METRICS.html).
Statistical Analysis
This meta-analysis was conducted by using RevMan 5.4.1, R 4.4.0, and Stata 17.0 software. Heterogeneity among the studies was evaluated using Cochran's Q test. A random effects model was used if P < .05 and I2 > 50%, which indicated significant heterogeneity; otherwise, a fixed effects model was adopted. The diagnostic value of 18F-FDG PET/CT radiomics in lymphoma was evaluated by integrating the summary receiver operating characteristic (SROC) curve, and Spearman correlation analysis was conducted to determine whether heterogeneity caused by threshold effects exists. If there was no threshold effect, we used TP, FP, FN, and TN equivalent strain to calculate the pooled sensitivity (SEN), specificity (SPE), positive likelihood ratio (PLR), negative likelihood ratio (NLR), and diagnostic odds ratio (DOR), and the results were visualized through forest plots.
Subgroup analyses of various relevant covariates were performed to investigate the influencing factors of the diagnostic value of 18F-FDG PET/CT radiomics. The covariates included the sample size, image modality, global or non-global ROI selection, manual or automatic ROI segmentation, radiomics mode, and deep learning (DL) or traditional machine learning (TML) algorithms. In addition, the publication bias and clinical utility was evaluated with Deeks’ funnel plot and Fagan nomogram respectively. P < .05 was regarded as statistically significant.
Results
Literature Screening Process and Results
Our search strategy yielded a total of 1473 pertinent publications during the initial search. Following the removal of duplicate records, 415 papers were evaluated based on their titles and abstracts, leading to the deletion of 352 non-original researches or those irrelevant to this study. The remaining 63 full texts were independently evaluated by the same investigators. Among them, 43 studies were excluded due to data mismatch or inability to extract data. Ultimately, 20 studies were incorporated into meta-analysis after progressive screening. The search and selection flowchart complying with the guidance of PRISMA-DTA is shown in Figure 1.

Flow Diagram Shows the Literature Screening Process and Results.
Characteristics of the Included Studies
This research encompassed 20 studies that reported a cumulative total of 19 087 samples. All included studies were designed retrospectively; four were multicentric, while the remainder were monocentric. Nine studies were performed in China, seven in Europe, two in Japan, one in America, and one in Egypt. Various methodologies were employed in ROI segmentation; eight studies implemented a threshold based on the maximum standardized uptake value (SUVmax), two studies applied a threshold value of CT density, two studies utilized maximum intensity projection (MIP) images, seven studies designated all malignant lesions within a specific organ as ROI, and one study identified five lesions with the highest SUVmax. The predominant feature reduction algorithm was the least absolute shrinkage and selection operator (LASSO; n = 7). Logistic regression (LR) was the most frequently used approach for developing radiomics signatures (n = 8). The basic characteristics of the included studies were shown in Table 1.
Characteristics of the Included Studies.
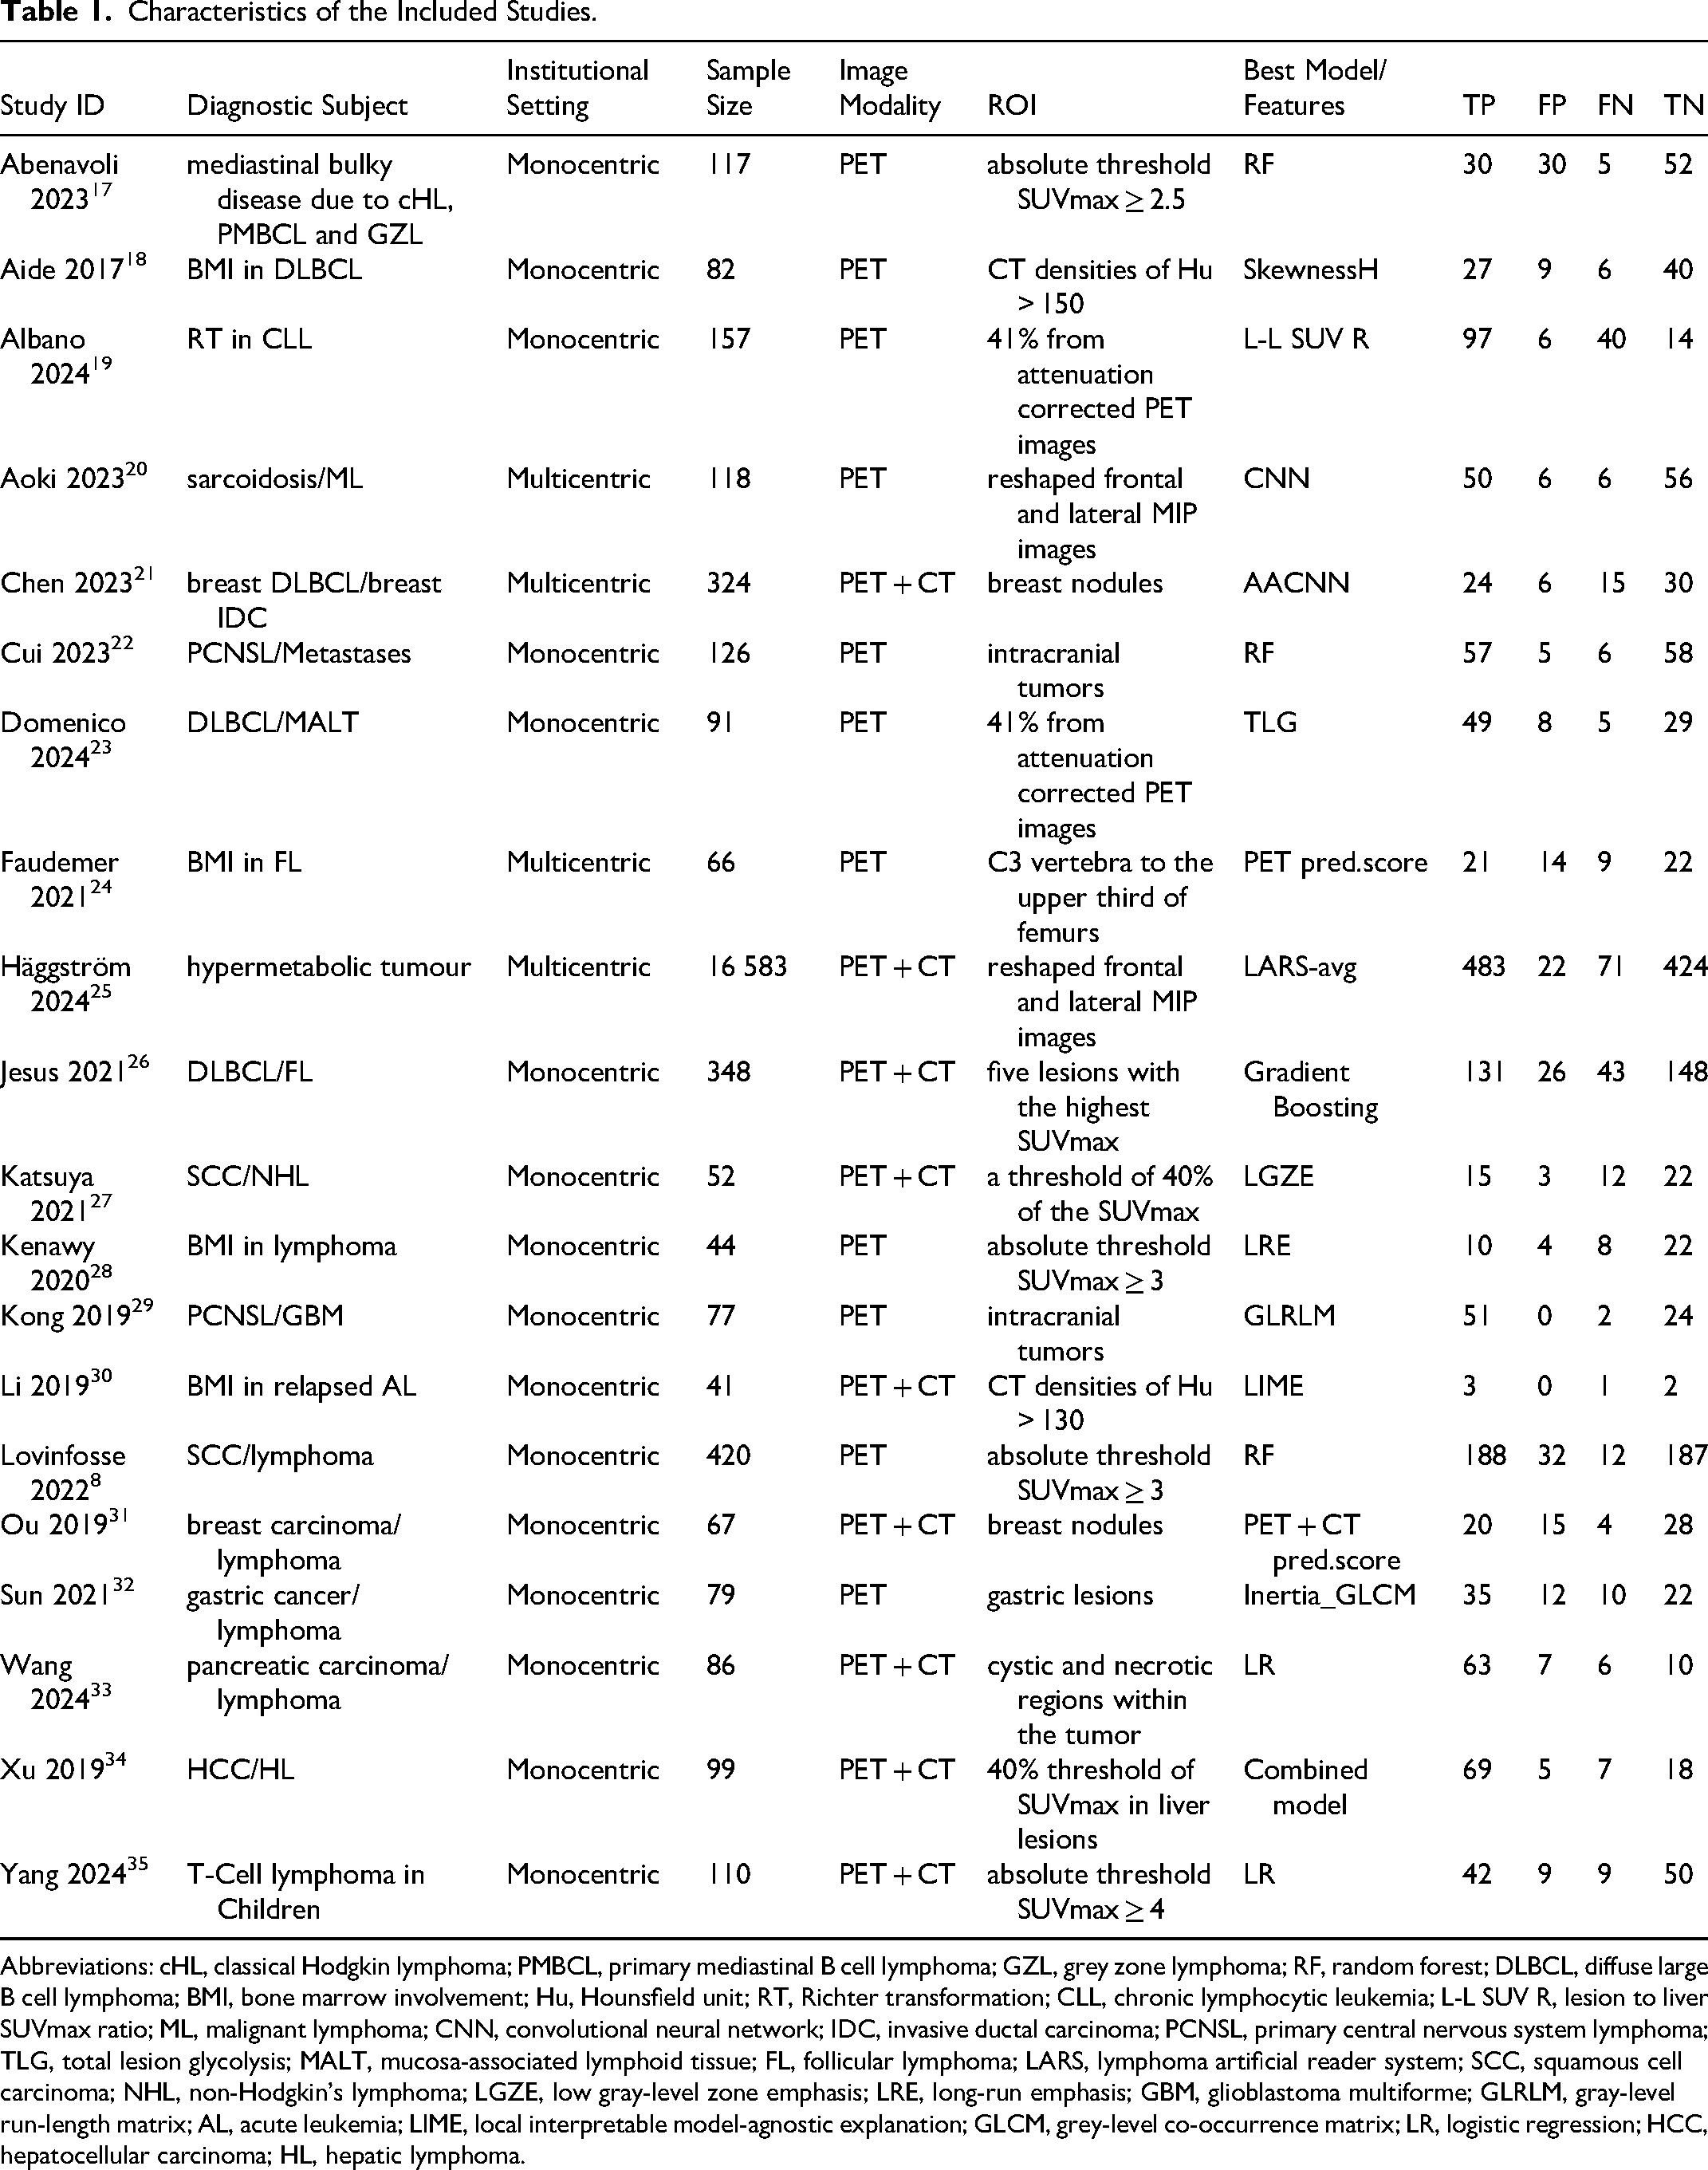
Abbreviations: cHL, classical Hodgkin lymphoma; PMBCL, primary mediastinal B cell lymphoma; GZL, grey zone lymphoma; RF, random forest; DLBCL, diffuse large B cell lymphoma; BMI, bone marrow involvement; Hu, Hounsfield unit; RT, Richter transformation; CLL, chronic lymphocytic leukemia; L-L SUV R, lesion to liver SUVmax ratio; ML, malignant lymphoma; CNN, convolutional neural network; IDC, invasive ductal carcinoma; PCNSL, primary central nervous system lymphoma; TLG, total lesion glycolysis; MALT, mucosa-associated lymphoid tissue; FL, follicular lymphoma; LARS, lymphoma artificial reader system; SCC, squamous cell carcinoma; NHL, non-Hodgkin's lymphoma; LGZE, low gray-level zone emphasis; LRE, long-run emphasis; GBM, glioblastoma multiforme; GLRLM, gray-level run-length matrix; AL, acute leukemia; LIME, local interpretable model-agnostic explanation; GLCM, grey-level co-occurrence matrix; LR, logistic regression; HCC, hepatocellular carcinoma; HL, hepatic lymphoma.
Risk of Bias Assessment
The quality evaluation findings of the included literature by QUADAS-2 are shown in Figure 2. In the patient selection domain, we noted unclear risks of bias and unclear applicability concerns for two studies because the inclusion/exclusion criteria were not specified. For the index test, there was an unclear risk of bias in four studies because cross-validation methods were not used for modeling. However, no applicability issue was found because they matched research questions. Two studies in the reference standard area were found to have a high risk of bias because they obtained their specimens through biopsy. Finally, we observed an unclear risk of bias in five studies because they did not mention the interval between imaging acquisition and histopathological examination. Overall, the quality of the included literature was high.

Stacked Bar Charts of the QUADAS-2 Scale of Methodological Quality Evaluation. Risk of Bias and Applicability Concerns of Each Included Study. (A) Individual Studies and (B) Summary. For Each Quality Domain, the Proportions of the Included Studies that Suggested Low, High, or Unclear Risk of Bias and Applicability Concerns are Displayed in Green, Red, and Yellow, Respectively.
RQS and METRICS
The single score of each RQS component and the total score of the whole study were provided in Table 2. The included studies achieved an average RQS of 13 (ranging from 10 to 17), accounting for 36.1% of the total points. Among the six domains with 16 items of RQS, there are four items, such as phantom studies on all scanners, biological correlates discussion, prospective design, and cost-effectiveness analysis, were not performed in the 20 included studies, and all the studies achieved 0 points in these items. Feature reduction, cutoff analyses, and discrimination statistics were performed in every included study.
Radiomics Quality Score of the Included Studies.
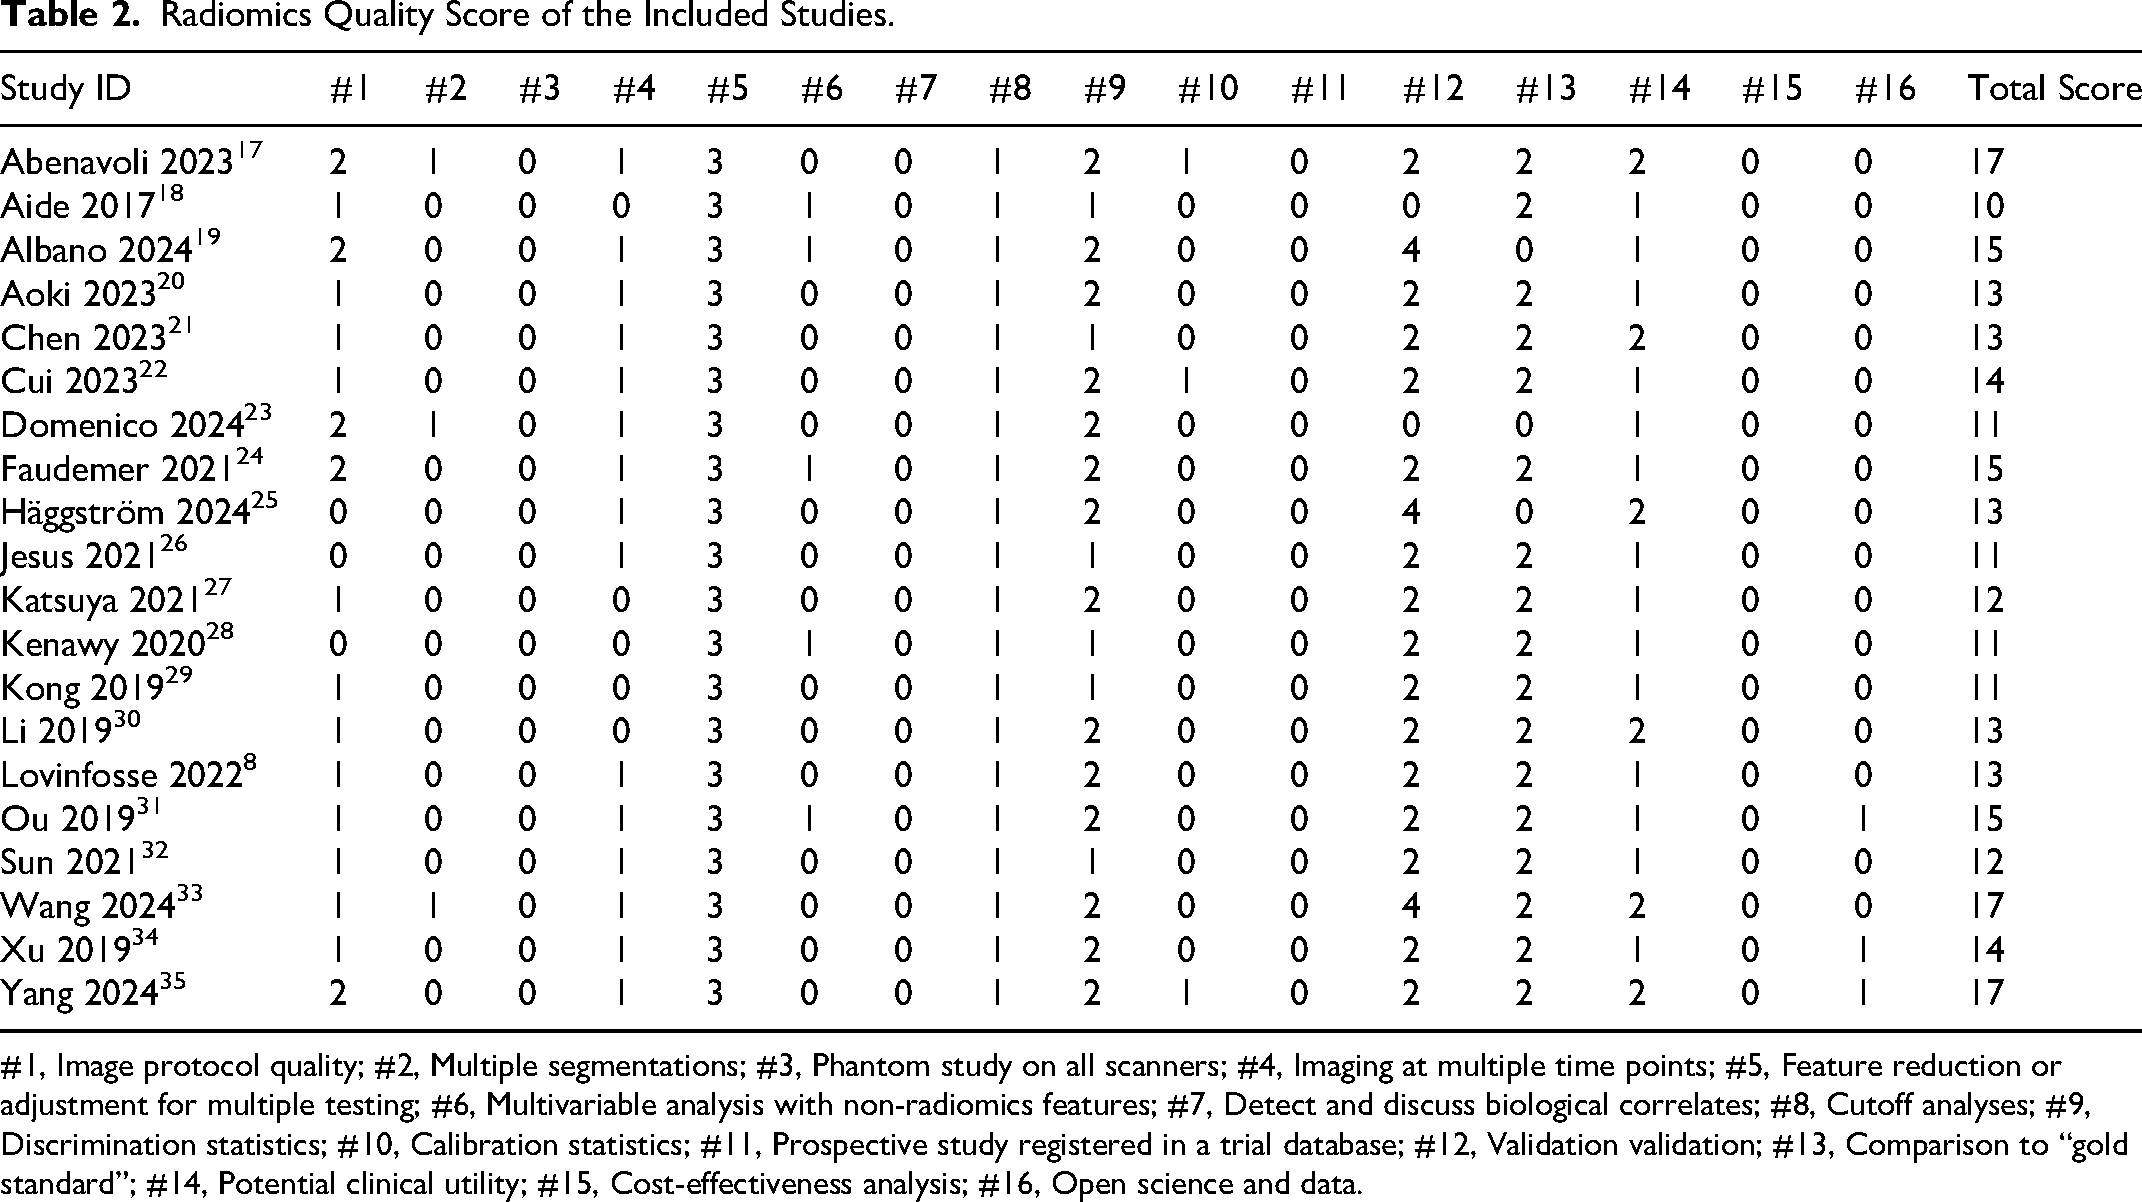
#1, Image protocol quality; #2, Multiple segmentations; #3, Phantom study on all scanners; #4, Imaging at multiple time points; #5, Feature reduction or adjustment for multiple testing; #6, Multivariable analysis with non-radiomics features; #7, Detect and discuss biological correlates; #8, Cutoff analyses; #9, Discrimination statistics; #10, Calibration statistics; #11, Prospective study registered in a trial database; #12, Validation validation; #13, Comparison to “gold standard”; #14, Potential clinical utility; #15, Cost-effectiveness analysis; #16, Open science and data.
The total METRICS score and quality category for each study were shown in Table 3. The average METRICS score across the 20 studies is 69.3% (ranging from 54.8% to 80.9%). One study is classified as excellent, sixteen as good, and three as moderate in quality category. Among numerous significant weight items, all studies used eligibility criteria to describe a representative study population and high-quality reference standard with a clear definition; fifteen studies implemented image preprocessing techniques with transparent description and proper data partitioning process, yet only four studies tested the model with independent data from other institution.
METhodological RadiomICs Score of the Included Studies.

#1, Adherence to radiomics and/or machine learning-specific checklists or guidelines; #2, Eligibility criteria that describe a representative study population; #3, High-quality reference standard with a clear definition; #4, Multi-center; #5, Clinical translatability of the imaging data source for radiomics analysis; #6, Imaging protocol with acquisition parameters; #7, The interval between imaging used and reference standard; #8, Transparent description of segmentation methodology; #9, Formal evaluation of fully automated segmentation; #10, Test set segmentation masks produced by a single reader or automated tool; #11, Appropriate use of image preprocessing techniques with transparent description; #12, Use of standardized feature extraction software; #13,Transparent reporting of feature extraction parameters, otherwise providing a default configuration statement; #14, Removal of non-robust features; #15, Removal of redundant features; #16, Appropriateness of dimensionality compared to data size; #17, Robustness assessment of end-to-end deep learning pipelines; #18, Proper data partitioning process; #19, Handling of confounding factors; #20, Use of appropriate performance evaluation metrics for task; #21, Consideration of uncertainty; #22, Calibration assessment; #23, Use of uni-parametric imaging or proof of its inferiority; #24. Comparison with a non-radiomics approach or proof of added clinical value; #25, Comparison with simple or classical statistical models; #26, Internal testing; #27, External testing; #28, Data availability; #29, Code availability; #30, Model availability; Y, Yes; N, No.
Meta-Analysis
Diagnostic Performance of 18F-FDG PET/CT Radiomics in Lymphoma
The pooled SEN, SPE, PLR, NLR, and DOR with 95% CI were 0.82 (0.78, 0.88), 0.83 (0.76, 0.87), 4.7 (3.4, 6.6), 0.20 (0.15, 0.28), and 23 (13, 42), respectively. The coupled forest plot showing SEN, SPE, and heterogeneity indicators (I2 and Cochran's Q test) is depicted in Figure 3. The SROC curve with pooled AUC value of 0.90 (0.87, 0.92) is depicted in Figure 4, which suggested high diagnostic value of 18F-FDG PET/CT radiomics in lymphoma.

Forest Plots Show the Performance Estimates (SEN and SPE) of Each Study Based on 18F-FDG PET/CT Radiomics in Lymphoma Diagnosis. the Pooled SEN and SPE are Displayed as Vertical Lines in the Forest Plots. Significant Variability in the Diagnostic Parameters Between Trials is Indicated by I2 > 50%.
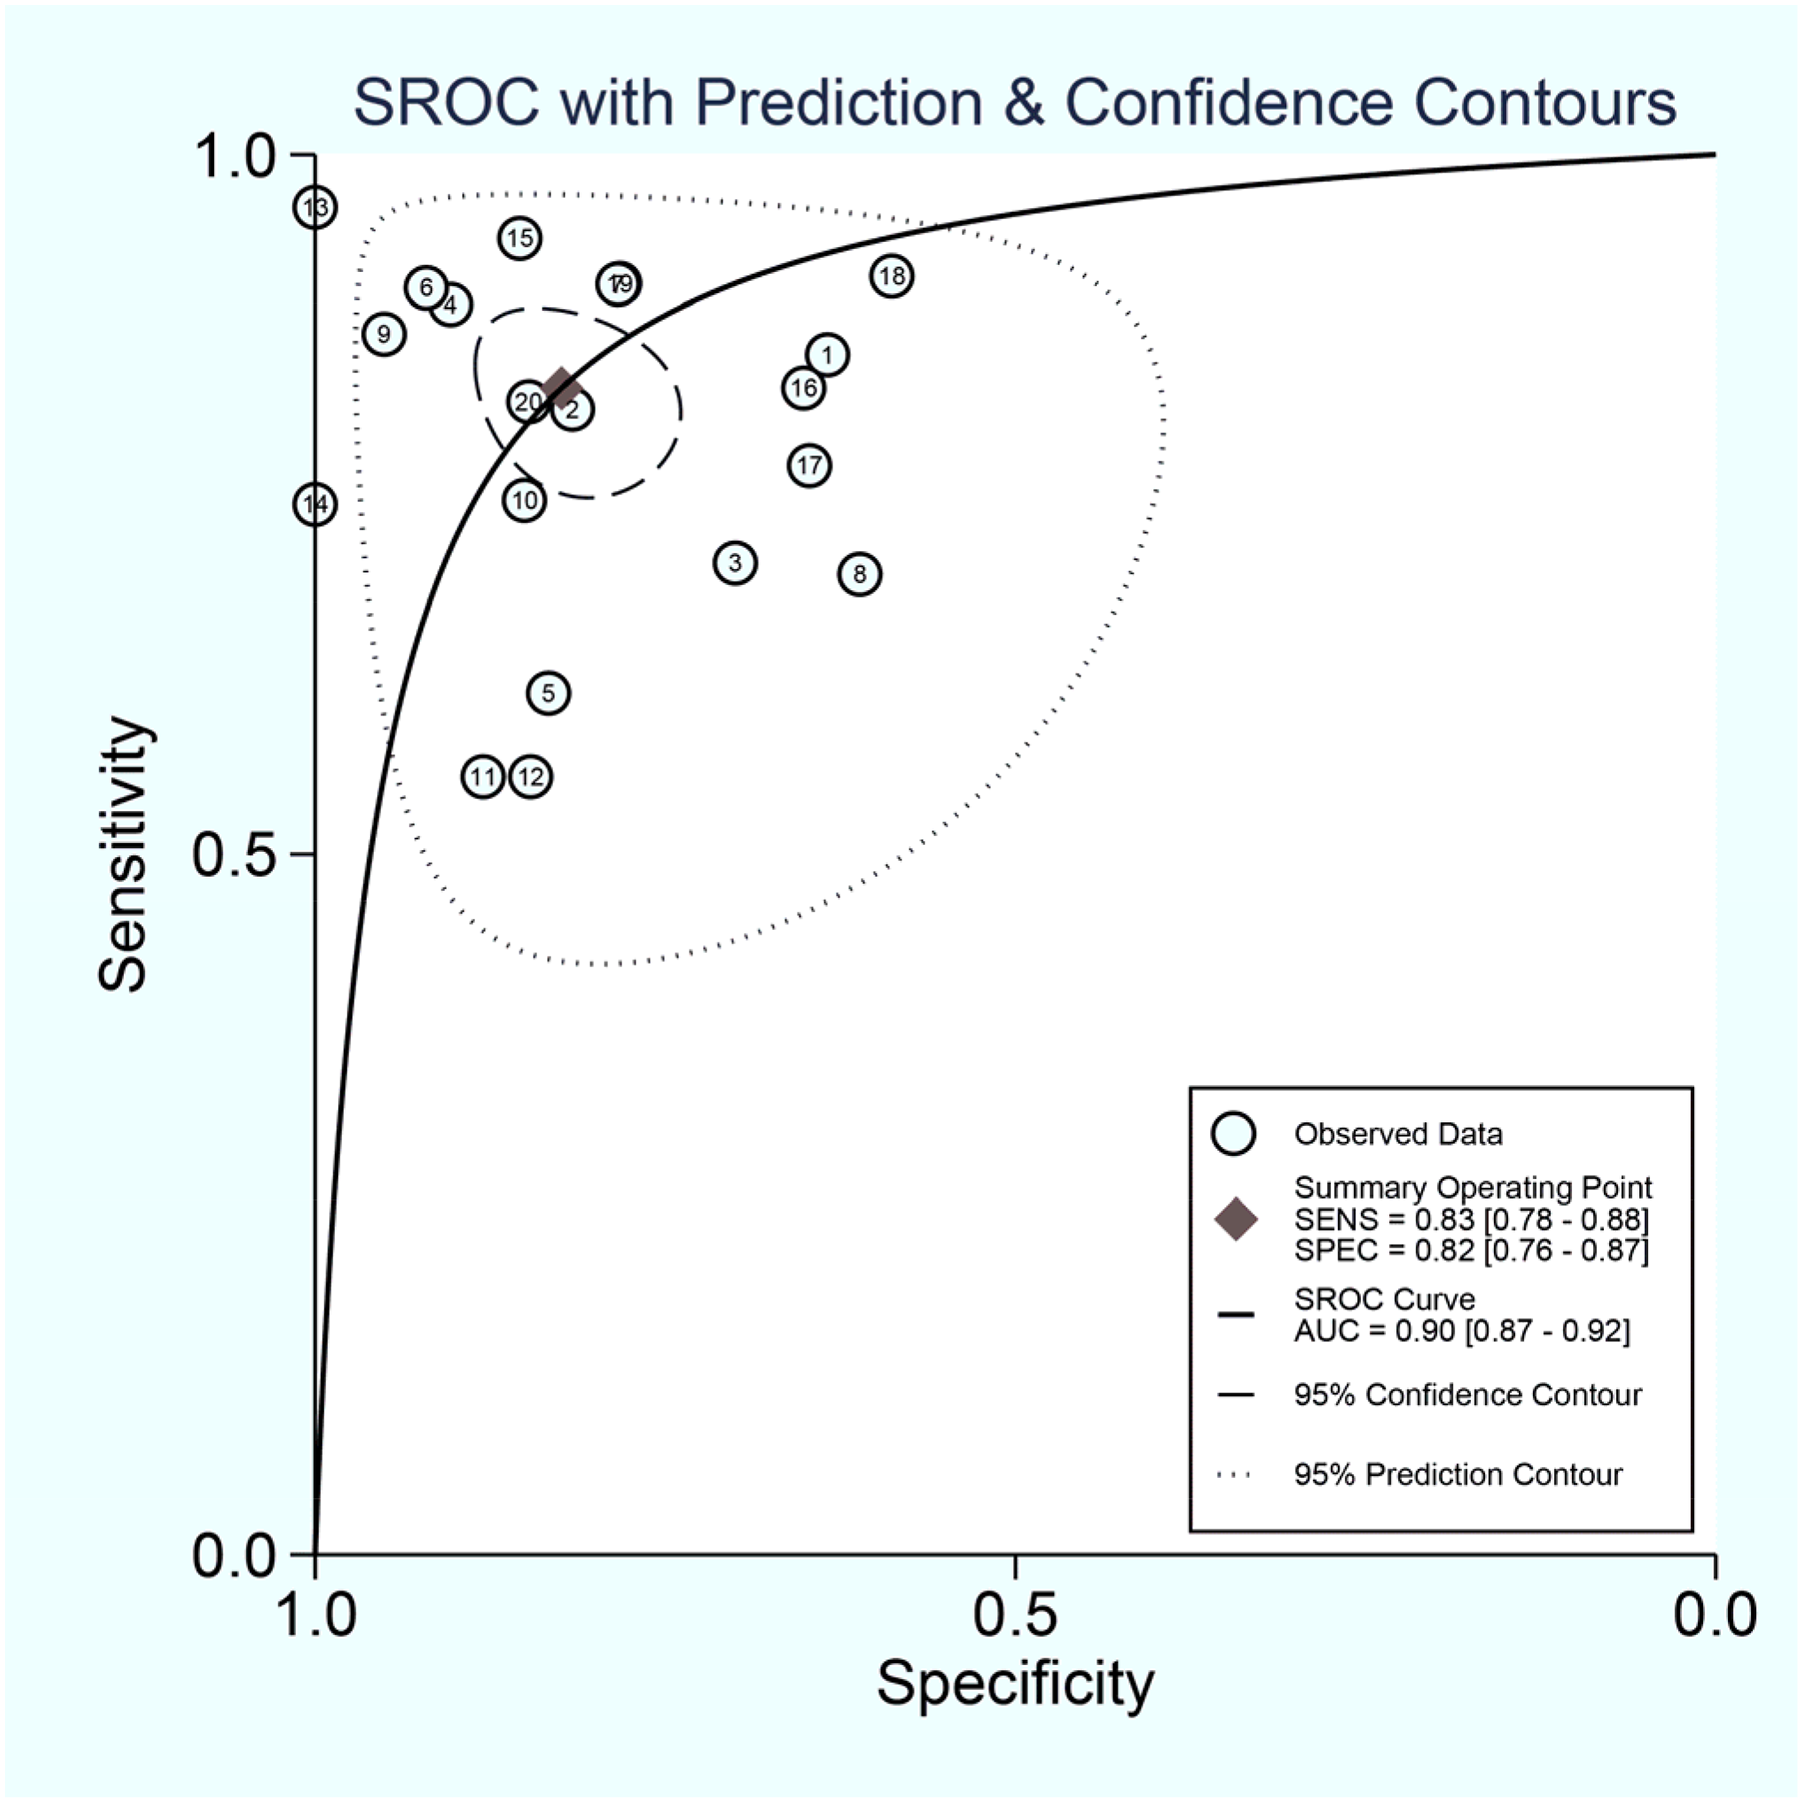
SROC Plots of 18F-FDG PET/CT Radiomics in Lymphoma Diagnosis. Each Circle Indicates One Included Study. Values in Brackets are 95% CIs.
Heterogeneity Assessment
The Higgins’ I2 value of Cochran's Q test with 95% CI was 83.7% (76.0, 88.9), and P < .01 showed significant heterogeneity among the included studies. Spearman's correlation coefficient (r) was 0.116 (P = .423), suggesting the absence of a threshold effect as the possible cause of heterogeneity.
Meta-Regression and Subgroup Analyses
Considerable heterogeneity existed among the studies (overall I2 83.7% [76.0, 88.9]; P < .01). Similarly, the forest plots indicated high heterogeneity with I2 > 50% for SEN (I2 82.1%; 95% CI: 75.0, 89.2; P < .001) and SPE (I2 84.5%; 95% CI: 78.6, 90.4; P < .001). To identify the sources of heterogeneity, we performed univariable meta-regression and subgroup analyses to investigate the impact of sample size, radiomics features, imaging modality, ROI, and algorithms on the heterogeneity. The results were presented in Table 4. Fully automatic segmentation was defined as a process executed entirely by algorithms without any human intervention. In contrast, semi-automatic segmentation referred to approaches that required manual initialization, correction, or supervision during or after the segmentation process.36,37 The findings of univariable meta-regression and subgroup analyses revealed that sample size and ROI selection considerably impacted the heterogeneity in SEN (P < .01), while algorithms significantly influenced the heterogeneity in SPE (P < .01); other assessed parameters showed no statistical significance regarding overall heterogeneity (P > .05).
Univariable meta-Regression and Subgroup Analyses.

Abbreviations: SEN, sensitivity; SPE, specificity; ROI, region of interest; DL, deep learning; TML, traditional machine learning.
In terms of sample size, studies with 100 participants or more (n = 9) had a higher SEN (83%; 95% CI: 76, 89) and SPE (85%; 95% CI: 78, 91) than studies with fewer than 100 participants (n = 11; SEN, 82% [95% CI: 72, 89]; SPE, 74% [95% CI: 67, 81]). Regarding different imaging modalities, PET alone (n = 11) had a higher SEN (84%; 95% CI: 80, 86) than PET combined with CT (n = 9; 80%; 95% CI: 71, 87), but SPE (80%; 95% CI: 72, 86 vs 83%; 95% CI: 73, 90) showed the opposite trend.
Regardless of whether ROI was segmented in the global images, non-global ROI (n = 12) had higher SEN (84%; 95% CI: 77, 90) and SPE (80%; 95% CI: 74, 85) than global ROI (n = 8; SEN, 81% [95% CI: 75, 86]; SPE, 79% [95% CI: 69, 87]). In terms of ROI segmentation, semi-automatic segmentation (n = 12) had the highest SEN (83%; 95% CI: 75, 89) than manual segmentation (n = 4; 81%; 95% CI: 69, 89) and fully automatic segmentation (n = 4; 78%; 95% CI: 69, 85), while fully automatic segmentation had the highest SPE (84%; 95% CI: 82, 85) than manual segmentation (63%; 95% CI: 55, 71) and semi-automatic segmentation (81%; 95% CI: 84, 86).
Regarding radiomics mode, texture features (n = 5) had the highest SEN (86%; 95% CI: 69, 97) than histogram (n = 4; 80%; 95% CI: 66, 88) and other features (n = 11; 83%; 95% CI: 77, 88), whereas other features had the highest SPE (82%; 95% CI: 75, 87) than texture features (79%; 95% CI: 61, 90) and histogram (75%; 95% CI: 67, 82). In terms of algorithms, TML (n = 16) shown a superior SEN (83%; 95% CI: 76, 87) compared to DL (n = 4; 78%; 95% CI: 69, 85), although SPE (77%; 95% CI: 70, 82 vs 84%; 95% CI: 82, 85) demonstrated an inverse trend.
Publication Bias
According to Deeks’ asymmetry test, quantitative analysis results showed no statistical significance among the included studies (P = .14), indicating that publication bias was not significant. Deeks’ funnel plot is shown in Figure 5.

Deeks’ Funnel Plot Shows no Asymmetry and the Presence of Publication Bias. Numbers in Circles Refer to the Study ID. ESS, Effective Sample Size.
Clinical Utility
The Fagan nomogram in Figure 6 showed that the prior probability in our study was 20%. This result revealed the clinical utility of 18F-FDG PET/CT radiomics by quantifying its ability to significantly modify the probability of lymphoma diagnosis from a specified baseline pre-test estimate. A PLR of 5 elevated the post-test probability to 54% for a positive test result, with an absolute increase of 34%. Likewise, an NLR of 0.20 diminished the post-test probability to 5% for a negative test outcome. The notable alterations in posterior probabilities of positive and negative outcomes indicated that the 18F-FDG PET/CT radiomics model may function as an efficacious clinical instrument for lymphoma diagnosis.

Fagan Nomogram of 18F-FDG PET/CT Radiomics in Lymphoma Diagnosis. LR, Likelihood Ratio.
Discussion
The current gold standard for lymphoma diagnosis is histopathological biopsy. Surgery or biopsy is invasive, and the overall lesion condition cannot be obtained. PET/CT examination can reflect overall lesion information and avoid unnecessary surgery. Since 2014, international experts have reached a consensus on the core role of PET/CT in the diagnosis and prognosis assessment of lymphoma. 3 In recent years, with the development of medical imaging technology, the application of 18F-FDG PET/CT radiomics in lymphoma diagnosis and prognosis prediction has become increasingly widespread.38-40 This present systematic review and meta-analysis investigated the diagnostic value of 18F-FDG PET/CT radiomics models in lymphoma and evaluated the quality and risk of bias of included studies utilizing QUADAS-2, RQS and METRICS tools for radiomics studies. For the first time, our meta-analysis amalgamated and statistically analyzed data from distinct independent studies, which may potentially offer vital clues for its clinical utility and future research. Twenty studies were included in the systematic review and meta-analysis. The results showed that the pooled SEN and SPE with 95% CI of 18F-FDG PET/CT radiomics in diagnosing lymphoma were 0.82 (0.78, 0.88) and 0.83 (0.76, 0.87), respectively. The AUC with 95% CI of the SROC curve was 0.90 (0.87, 0.92), indicating that 18F-FDG PET/CT radiomics has high diagnostic efficiency for lymphoma. Deeks’ funnel plot showed no publication bias, indicating that the results of this study were reliable.
Upon observing the high heterogeneity among studies (overall I2 83.7% [76.0, 88.9]; P < .01), we observed I2 > 50% for SEN (I2 82.1%; 95% CI: 75.0, 89.2; P < .001) and SPE (I2 84.5%; 95% CI: 78.6, 90.4; P < .001). We conducted subgroup analysis on the potential parameters contributing to high heterogeneity, and the results suggested that sample size, ROI and algorithms were the primary contributors of heterogeneity. When the sample size was greater than 100, the diagnostic performance of the model was considerable, with a combined SEN and SPE of 83% (95% CI: 76, 89) and 85% (95% CI: 78, 91), respectively. This result may be due to the Neg correlation between sample deviation and sample size, 41 which further indicated that 18F-FDG PET/CT radiomics is a scalable and reliable diagnostic tool for lymphoma. In addition, four studies20,21,25,26 have adopted DL models. The sample sizes of these studies are all greater than 100 or even greater than 1000. DL radiomics models require high-quality datasets to ensure accuracy and generalization. These datasets should be large and diverse to capture the variability in medical imaging. However, acquiring such datasets is challenging due to factors like imaging costs, annotation efforts, and patient privacy concerns.42,43 To address these issues, data augmentation techniques, such as geometric transformations and generative adversarial networks (GANs), are employed to artificially expand dataset size and diversity. 44 Additionally, rigorous data preprocessing, including image acquisition standardization and feature extraction, is essential to minimize variability and enhance model robustness. The dependability and usability of DL models in clinical contexts are further guaranteed by data standardization, the creation of strong models, and thorough statistical analysis. 45
ROI is the most critical and controversial part of radiomics research, and the accuracy of data analysis and the reproducibility of features are closely related to the selection of ROI. One of the primary sources of heterogeneity arises from variations in ROI delineation methods, which can be manual, semi-automatic, or fully automatic.46,47 Although manual segmentation is widely employed, it is very dependent on the radiologist's skill and experience, which can cause variability both within and between observers. Additionally, the defining of ROI is difficult since many tumors have hazy or diffuse borders. The performance of the model can be greatly affected by variations in feature extraction, which can result from different segmentation techniques, such as concentrating only on the tumor core or incorporating peritumoral regions. 48 The subgroup analyses of our study indicated that ROI Segmentation has no statistically effect on heterogeneity (P > .05), while ROI Selection is one of the primary factors influencing it (P < .01). In recent years, semi-automatic and DL-based segmentation methods have been proposed to improve reproducibility, yet they still require careful validation to ensure consistency across different datasets and imaging modalities.49,50 Furthermore, variations in ROI selection criteria, such as tumor size, shape, and intensity thresholds, contribute to dataset heterogeneity. Previous studies have found that semi-automatic segmentation approaches based on 3D Slicer software can significantly improve the accuracy and reproducibility of radiomics feature quantification, with low heterogeneity. 51 Therefore, semi-automatic segmentation is a potential method for constructing strong robust radiomics models. Standardizing ROI segmentation through harmonized protocols, automated algorithms, and quality control measures is essential to minimize variability. Robust cross-validation and external validation using independent datasets are crucial steps to assess the impact of ROI heterogeneity on radiomics models and improve their clinical applicability. 52 By adhering to these stringent data requirements, PET/CT-based radiomics models can be effectively developed and translated into clinical practice.
Meanwhile, all 20 included studies utilized machine learning models. Machine learning typically divides datasets into training and validation sets, and it improves our decision-making process by classifying, predicting, and evaluating known datasets. However, there were two machine learning models included in the literature that have not been validated on other datasets, which may lead to overfitting of the models.26,53 This is a primary factor contributing to the considerable heterogeneity shown in this work. In radiomics research, TML models typically rely on handcrafted features extracted from medical images, necessitating domain expertise for feature selection and engineering. In contrast, DL models automatically learn hierarchical features directly from raw image data through neural networks, reducing the need for manual intervention. Comparative study indicated that DL models often outperform traditional radiomics approaches, achieving higher diagnostic accuracy in various clinical scenarios.54,55 There are four studies20,21,25,26 used DL models in this meta-analysis, all of which have diagnostic accuracy above 85%. Specifically, a DL-based diagnostic platform 25 for DLBCL achieved an accuracy of 95%, highlighting its potential in clinical applications. These findings suggest that DL models may offer significant advantages over TML models in radiomics, particularly in enhancing diagnostic accuracy for lymphoma. Our meta-analysis revealed that the SPE of DL was markedly superior to that of TML, which serves as a source for examining heterogeneity (P < .01). This finding is consistent with the results of previous research. However, DL requires a larger amount of data compared with traditional radiomics approaches, and the generalization ability of models on independent datasets is still lacking.56,57 Therefore, the research on DL is still far from complete.
Multiple studies have shown that radiomics has promising prospects in diagnosing highly heterogeneous tumors like those with the same disease but different images and those with different diseases but the same image. Compared with conventional diagnostic methods, radiomics has stronger diagnostic capabilities, and further consideration should be given to standardize its application in clinical practice.8,20–23,26,27,29,31–34,58 18F-FDG metabolic parameters and texture features are the most commonly used features for constructing lymphoma diagnostic models. They indicate tumor heterogeneity by reflecting the metabolic differences of tumor cells and the local spatial arrangement of voxel intensity.47,59 However, the reproducibility of radiomics features is poor due to different implementation plans of various studies, so seeking universal 18F-FDG PET/CT radiomics features to reflect the biological characteristics of tumors is challenging. The subgroup analysis of this study showed that the use of different radiomics methods to construct models had no statistical significance on heterogeneity (P > .05), suggesting that the variability in model performance was probably affected by extraneous factors, such as datasets or patient characteristics, rather than the radiomics methodology itself. This finding supports the robustness of radiomics-based models across different feature extraction or analysis techniques.
In clinical practice, the successful implementation of 18F-FDG PET/CT radiomics in lymphoma diagnosis necessitates strict adherence to standardized image acquisition protocols to ensure data consistency and reproducibility. This entails the use of uniform scanning parameters, radiotracer injection doses, and acquisition timing to minimize artifacts and individual variability. Additionally, image preprocessing techniques such as normalization, filtering, and segmentation should follow established methodologies to optimize image quality and enhance the reliability of radiomics feature extraction.38,60,61 For robust feature extraction, validated computational algorithms should be employed to quantify key radiomics features, such as texture, shape, and metabolic parameters. The integration of TML or DL algorithms can further facilitate automated analysis, improving diagnostic accuracy and efficiency.56,62,63 Multicenter collaborations play a critical role in constructing large-scale, diverse datasets and enabling the integration of multimodal data, such as radiomics with genomic or biomarker information, to enhance model generalizability.53,64 Moreover, the development of open-access databases and data-sharing platforms can foster research transparency and reproducibility, thereby accelerating the clinical adoption of radiomics in lymphoma diagnostics.56,65,66 From a clinical integration perspective, radiomics analysis should be incorporated into existing diagnostic workflows, complementing traditional image interpretation and pathological assessments. 67 Developing clinical decision support systems can aid physicians in optimizing treatment strategies, such as precise staging, therapy response prediction, and relapse monitoring.46,68,69 By addressing these challenges, 18F-FDG PET/CT radiomics can be effectively translated into clinical practice, ultimately improving diagnostic accuracy and patient outcomes in lymphoma.
Limitations
There are several limitations of this study that warrant consideration. First, all included studies were retrospective, potentially impacting the generalizability of our findings. Compared with prospective studies, retrospective designs are susceptible to unquantifiable confounders, such as discrepancies in image acquisition protocols, variances in patient management, or undocumented clinical variables. Additionally, imbalanced datasets, such as uneven representation of lymphoma subtypes or stages, may impair model training and validation in radiomics studies, hence limiting the applicability of findings in a wider range of clinical settings. Future studies should more adopt prospective design to improve research quality. Second, as a result of incomplete data or poor research implementation, some original studies were excluded from this meta-analysis, which may lead to selection bias and affect the accuracy of conclusions. Lastly, the main radiomics features reported across studies showed notable variability and limited reproducibility, likely due to differences in segmentation methods, image preprocessing (such as resampling and discretization), feature extraction, and model construction. To overcome the limitations of low repeatability, researchers may adhere to established protocols for radiomics study,69,70 integrate the quality evaluation framework of radiomics, 6 and conduct radiomics research with standardization.
Conclusion
In conclusion, this meta-analysis of 20 studies based on 18F-FDG PET/CT radiomics demonstrated promising diagnostic performance in lymphoma, indicating the potential clinical utility of radiomics models. However, there is high heterogeneity among different studies. Future clinical practicality needs to be confirmed by large-scale, prospective, and externally validated studies with harmonized imaging protocols and radiomics methodologies.
Footnotes
Abbreviations
Ethical Considerations
This study does not involve research on animals or humans; hence, no ethical approval was necessary for this meta-analysis and secondary research utilizing data from public sources. Consequently, ethical statements are not applicable.
Author Contributions
Chaoying Liu: Data curation; formal analysis; investigation; writing – original draft. Jun Zhao: Data curation; formal analysis; investigation. Heng Zhang: formal analysis; project administration; writing – review and editing. Xinye Ni: formal analysis; project administration; writing – review and editing.
Funding
The authors disclosed receipt of the following financial support for the research, authorship, and/or publication of this article: This study was supported by the National Natural Science Foundation of China (No. 62371243), Jiangsu Provincial Key Research and Development Program Social Development Project (No. BE2022720), the National Natural Science Foundation of Jiangsu (No. BK20231190), Jiangsu Provincial Medical Key Discipline Cultivation Unit of Oncology Therapeutics (Radiotherapy) (No. JSDW202237), General Program of Jiangsu Provincial Health Commission (No. M2020006), Changzhou Social Development Program (No. CE20235063 and CJ20244020).
Declaration of Conflicting Interests
The authors declared no potential conflicts of interest with respect to the research, authorship, and/or publication of this article.
Data Availability Statement
Data are available upon reasonable request.