
Abstract
Background:
Leukemia is a common malignant disease in the human blood system. Many researchers have proposed circulating microRNAs as biomarkers for the diagnosis of leukemia. We conducted a meta-analysis to evaluate the diagnostic accuracy of circulating miRNAs in the diagnosis of leukemia.
Methods:
A comprehensive literature search (updated to October 13, 2020) in PubMed, EMBASE, Web of Science, Cochrane Library, Wanfang database and China National Knowledge Infrastructure (CNKI) was performed to identify eligible studies. The sensitivity, specificity, positive likelihood ratio (PLR), negative likelihood ratio (NLR), diagnostic odds ratio (DOR), and area under the curve (AUC) for diagnosing leukemia were pooled for both overall and subgroup analysis. The meta-regression and subgroup analysis were performed to explore heterogeneity and Deeks’ funnel plot was used to assess publication bias.
Results:
49 studies from 22 publications with a total of 3,489 leukemia patients and 2,756 healthy controls were included in this meta-analysis. The overall sensitivity, specificity, positive likelihood ratio, negative likelihood ratio, diagnostic odds ratio and area under the curve were 0.83, 0.92, 10.8, 0.18, 59 and 0.94, respectively. Subgroup analysis shows that the microRNA clusters of plasma type could carry out a better diagnostic accuracy of leukemia patients. In addition, publication bias was not found.
Conclusions:
Circulating microRNAs can be used as a promising noninvasive biomarker in the early diagnosis of leukemia.
Introduction
Leukemia is a type of clonal malignant disease that originates from hematopoietic stem cells, characterized by the accumulation of immature cells and disturbed hematopoiesis in bone marrow. 1 Clonal leukemia cells proliferate and accumulate in the bone marrow and other hematopoietic tissues due to mechanisms such as uncontrolled cell proliferation, blocked differentiation, and apoptosis obstruction, even infiltrating other non-hematopoietic tissues and organs, thus inhibiting normal hematopoietic function. 2 Leukemia includes 4 major categories: acute myeloid leukemia (AML), acute lymphocytic leukemia (ALL), chronic myeloid leukemia (CML), and chronic lymphocytic leukemia (CLL). 3 The clinical manifestations may have varying degrees of anemia, bleeding, infection and fever, as well as liver, spleen, lymph node enlargement and bone pain. The emergence of MICM (morphology, immunology, cytogenetics, molecular) diagnosis and classification of leukemia has made an important contribution to its personalized treatment and prognostic evaluation. 4 The performance of MICM is cumbersome and expensive. The MICM morphological types require bone marrow biopsy to obtain test samples, which is the gold standard for diagnosing leukemia. However, the bone marrow extraction process is invasive and complicated, which increases the pain, and the economic burden of patients, may not be accepted by all patients. 5 Therefore, finding a sensitive, convenient and novel noninvasive biomarker to compensate for the shortcomings in the existing leukemia detection methods are desperately needed.
Following the rapid development of cell and molecular biology, microRNA (miRNA) has attracted the attention of many experts because of its strong specificity, repeatability and accuracy. 6 In recent years, the profile of microRNA biomarkers has been widely used in different clinical settings to ensure their stability, such as early detection of disease, disease prediction, monitoring of disease progression, and response to treatment. 7
MiRNAs are small, noncoding sections of RNA, approximately 21-25 nucleotides in length, which regulate gene expression by mediating the degradation of other target mRNAs, that are responsible for various cellular and metabolic biological processes, including cell development, proliferation, differentiation, apoptosis and survival. 8 -10 MiRNAs can act as either oncogenes or tumor suppressors, depending on their specific gene targets, 11 there is increasing evidence that miRNAs are dysregulated in many cancers, including leukemia. Xie et al 12 first reported that miR-221 was upregulated in the serum of AML patients, and then Luna-Aguirre et al 13 reported that miR-221 was downregulated in the plasma of ALL patients. A meta-analysis by Li et al 14 collected the literature on circulating miRNA as a biomarker for overall hematological cancer diagnosis and found that the diagnostic accuracy of circulating miRNA in AML is better than other hematological cancers. In recent years, circulating miRNAs have received widespread attention as new invasive biomarkers for leukemia. Many scholars have successively tested the diagnostic accuracy of peripheral blood miRNAs in leukemia patients. The results are satisfactory but inconsistent. The reason may be due to the small number of clinical samples, the failure to develop test method standards, and the lack of multicenter data demonstration. 6 Therefore, we conducted this meta-analysis to comprehensively evaluate the diagnostic accuracy of circulating miRNAs in the diagnosis of leukemia.
Materials and Methods
Search Strategy and Study Selection
This meta-analysis was performed according to the PRISMA statement. 15 We conducted comprehensive search in PubMed, EMBASE, Web of Science, Cochrane Library, Wanfang database and China National Knowledge Infrastructure (CNKI) up to October 13, 2020. The search terms were as follows: “leukemia” and “microRNA” or “miRNA” or “miR.” The searches were limited to publications with human subjects, without language restriction. Furthermore, a manual search was performed using the references listed in the original articles and review articles retrieved.
Inclusion and Exclusion Criteria
The inclusion criteria for the meta-analysis were as follows: (1) clinical study of circulating miRNA in the diagnosis of leukemia; (2) healthy individuals were used as control groups; (3) the obtained miRNAs are measured in serum or plasma specimens; (4) studies that used relevant data, such as specificity, sensitivity, or other sufficient information to construct a diagnostic 2 × 2 table.
The exclusion criteria were as follows: (1) duplicate reports; (2) publications with incomplete information; (3) miRNAs obtained from cell lines, animals, marrow bone; (4) reviews, case reports, comments and letters to the editors; and (5) systematic reviews or meta-analysis.
Data Extraction and Quality Assessment
Two investigators (WTZ and GXZ) independently screened the following data from each eligible study: first author’s name, year of publication, country, miRNA according to number, differentiated expression (up or downregulated), sample size (number of patients with leukemia and healthy controls), specimen source (serum or plasma), as well as relevant statistical data and methodological quality information. Quality Assessment of Diagnostic Accuracy Studies-2 (QUADAS-2) 16 tool was employed to evaluate the quality of eligible studies. Two investigators (WTZ and GXZ) independently conducted data extraction and quality assessment of the included studies, and the disagreement was resolved by consultation with a third author (SSG), and finally reached a consensus.
Statistical Analysis
Statistical analyses were carried out by Review Manager 5.2 and STATA version 13.0. According to the guidelines for diagnostic accuracy meta-analysis, 17 the number of true positive (TP), false positive (FP), true negative (TN) and false negative (FN) from each study were extracted. We calculate sensitivity (SEN), specificity (SPE), positive likelihood ratio (PLR) and negative likelihood ratio (NLR) to evaluate the ability to distinguish leukemia patients from healthy controls. Besides, the area under the curve (AUC) of the summary receiver operator characteristic (SROC) curve and the diagnostic odds ratio (DOR) were used in the evaluation of the overall performance and subgroup analysis of each diagnostic test. The heterogeneity was evaluated by I2 statistics. If the I2 value is greater than 50%, it indicated the existence of significant heterogeneity and a random effects model is performed. The regression analysis and subgroup analysis were used to investigate the potential sources of heterogeneity. Finally, we explored the potential publication bias by using Deeks’ funnel plot asymmetry test, in which P < 0.05 indicated statistical significance.
Results
Study Selection and Characteristics of Included Studies
The flow chart of the article selection process is shown as Figure 1. A total of 9,040 articles were retrieved from the primary literature search strategy, of which, 2,961 were from PubMed, 2,707 were from Embase, 2,813 were from Web of Science, 14 were from Cochrane Library, 213 were from Wan-fang databases and 332 were from Chinese National Knowledge Infrastructure. After removed 2,605 duplicates, 6,435 articles were left for detection. After reviewing titles and abstracts manually, 6,342 studies were excluded due to their irrelevance to the analysis, or because they were animal experiments or linear cell research, or review articles or letters. Then, we read the full texts of the remaining 93 articles and 71 articles were excluded. Finally, 49 studies from 22 high quality articles were included in this meta-analysis, of which 3 were on AL (not separated clearly for ALL or AML), 28 were on AML, 13 were on ALL and 5 were CML.
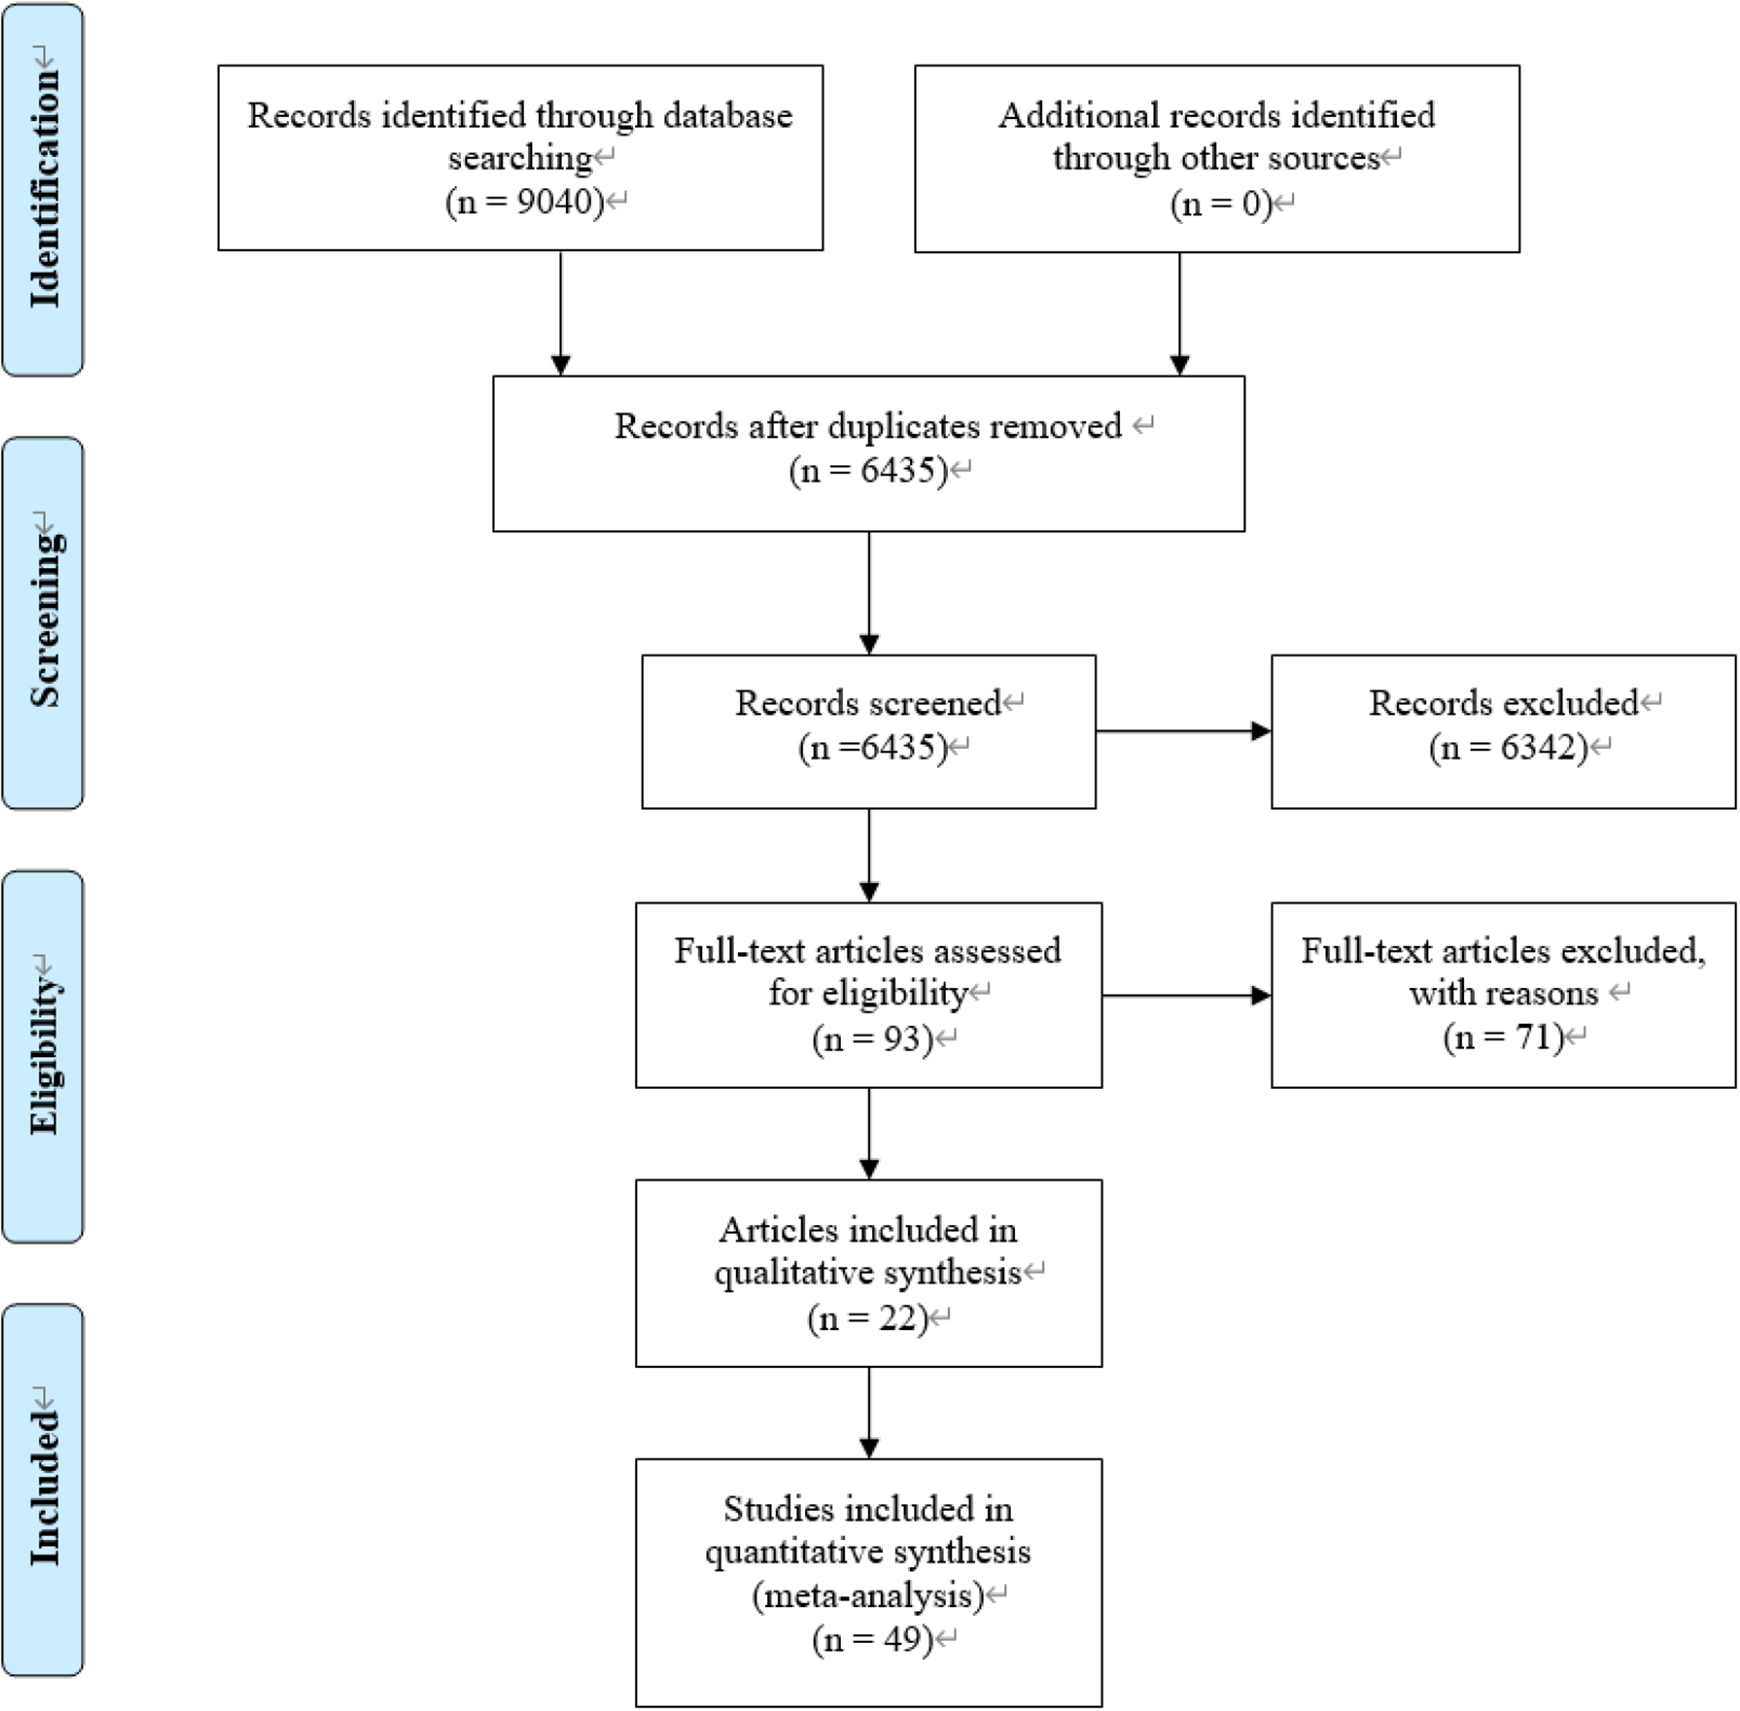
Flow diagram according to PRISMA 2009.
The main characteristics of the 49 eligible studies included are summarized in Table 1, published from 2012 to 2020. A total of 3,489 leukemia patients (192 AL, 2,464 AML, 643 ALL and 190 CML) and 2,756 healthy controls were included. A total of 45 studies focused on a single miRNA, and 4 studies focused on multiple miRNAs. The quantitative reverse transcription PCR (qRT-PCR) were used the expression of miRNAs from 23 serum specimens and 26 plasma specimens. The study subjects were from China, Egypt, Belgium and Mexico, and the dominant ethnicity was Asian. The quality assessments of the included articles according to QUADAS-2 tool were summarized in Figure 2.
Characteristics of the Included Studies.

Abbreviations: AL, acute leukemia; AML, acute myeloid leukemia; ALL, acute lymphocytic leukemia; CML, chronic myelogenous leukemia; Sen, sensitivity; Spe, specificity; AUC, area under the curve.

Quality evaluation according to the QUADAS-2 criteria.
Threshold Effect
The threshold effect was evaluated by calculating the Spearman correlation coefficient using the logarithm of sensitivity and the logarithm of (1-specificity). The results showed that the Spearman correlation coefficient is 0.039 (P = 0.790), which indicated no threshold effect.
Diagnostic Accuracy of miRNAs in Distinguishing Leukemia Patients From Healthy Controls
The sensitivity and specificity of circulating miRNAs in leukemia patients were analyzed by using forest plots. We found significant heterogeneity between the overall studies (I2 = 86.5% for sensitivity and I2 = 78.7% for specificity), and therefore the random effects model was used in our meta-analysis. The pooled sensitivity was 0.83 (95% CI: 0.79-0.86), specificity was 0.92 (95% CI: 0.89-0.94), PLR was 10. 8 (95% CI: 7.8-14.9), NLR was 0.18 (95% CI: 0.15-0.22) and DOR was 59 (95% CI: 38-91; Figure 3A and B). These results showed that miRNAs could distinguish leukemia patients from healthy controls. In addition, AUC was 0.94 (95% CI: 92-96), which suggested that the circulating miRNAs had an outstanding diagnostic accuracy for leukemia patients (Figure 3C).
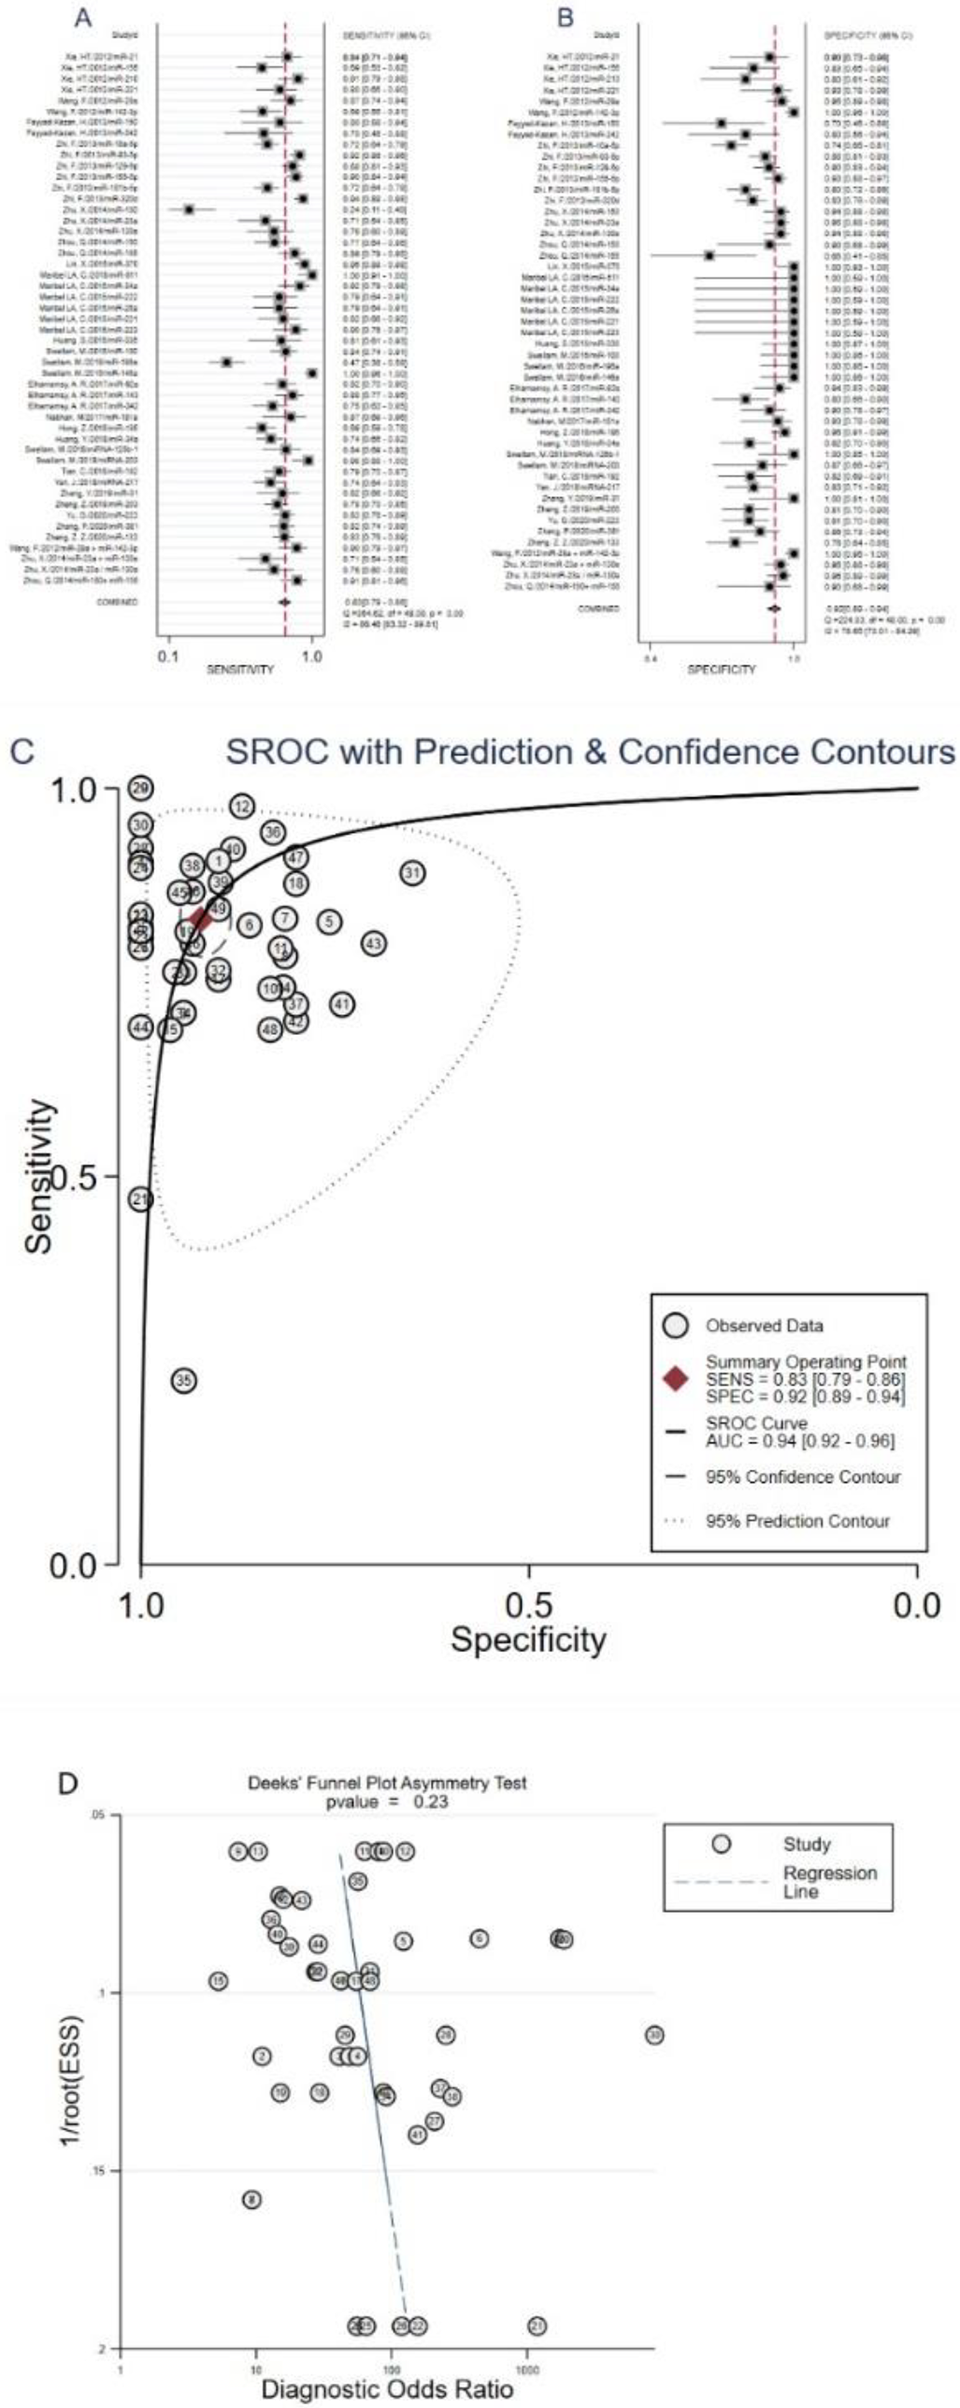
Forest plots of sensitivity, specificity, AUC and funnel plot of circulating miRNAs for diagnosing leukemia patients from healthy controls among overall studies. (A) Sensitivity; (B) specificity; (C) AUC; (D) funnel plot.
Diagnostic Value of miRNA Clusters in Leukemia Patients
There were 4 studies focused on miRNA clusters. The pooled sensitivity was 0.84 (95% CI: 0.73-0.91), specificity was 0.97 (95% CI: 0.93-0.99), PLR was 27.3 (95% CI: 10.8-68.9), NLR was 0.17 (95% CI: 0.09-0.29), DOR was 165 (95% CI: 44-623), and AUC was 0.97 (95% CI: 0.96-0.98; Figure 4). The results suggested that miRNA cluster has a relatively high diagnostic accuracy in the diagnosis of leukemia patients.

Forest plots of sensitivity, specificity, AUC and funnel plot of miRNA clusters for diagnosing leukemia patients from healthy controls. (A) Sensitivity; (B) specificity; (C) AUC; (D) funnel plot.
Meta-Regression Analysis
Subsequently, we conducted a meta-regression analysis to explore possible sources of between-study heterogeneity in sensitivity and specificity, based on country, miRNA profiling, regulation mode, sample size, specimen types and types of leukemia. The meta-regression analysis suggested that country, regulation mode, sample size and specimen types might explain heterogeneity in sensitivity (P < 0.001), and regulation mode, sample size and specimen types might also be potential sources of heterogeneity in specificity (P < 0.001; Figure 5).

Forest plots of multivariable meta-regression for sensitivity and specificity.
Subgroup Analysis
Our subgroup analysis outcomes are shown in Table 2, which were performed to find probable sources of heterogeneity. Subgroup analyses suggested that the miRNA cluster showed a better diagnostic accuracy than single ones, with a sensitivity (0.84 vs. 0.83), specificity (0.97 vs. 0.91), PLR (27.3 vs. 9.7), NLR (0.17 vs. 0.18), DOR (165 vs. 52), and AUC (0.97 vs. 0.94). In addition, plasma types had a higher diagnostic value than serum types: sensitivity (0.83 vs. 0.84), specificity (0.96 vs. 0.87), PLR (22.2 vs. 6.5), NLR (0.18 vs. 0.18), DOR (122 vs. 35) and AUC (0.96 vs. 0.92). Moreover, acute lymphocytic leukemia patients displayed a better performance than other subgroups, with an AUC of 0.99. Furthermore, studies with non-Chinese population with upregulated miRNA showed a better diagnostic performance, but the sample size had no influence on the diagnosis.
Summary Estimates of Diagnostic Power and Their 95% Confidence Intervals.

Abbreviations: Se, sensitivity; Sp, specificity; PLR, positive likelihood ratio; NLR, negative likelihood ratio; DOR, diagnostic odds ratio; AUC, area under the curve; CI, confidence interval; AML, acute myeloid leukemia; ALL, acute lymphocytic leukemia; CML, chronic myelogenous leukemia.
Publication Bias
The publication bias of the included studies was checked by Deeks’ funnel plot asymmetry test. The pooled Deeks’ test result of the overall study was t = 1.22, P = 0.23 (Figure 3D), the pooled Deeks’ test result of microRNA cluster was t = −0.95, P = 0.44 (Figure 4D), which indicated no significant publication bias in this meta-analysis.
Discussion
Leukemia is a common malignant disease in the human blood system. The main pathogenic factors are chemical factors, genetic factors, exposure to radioactive substances or viruses. With the rapid development of modern medicine, the diagnosis and treatment of leukemia have also made great progress. The basis of leukemia precision medicine is laboratory diagnosis, which includes 4 aspects of morphology, immunology, cytogenetics and molecular (MICM classification), all of the above studies require bone marrow biopsy to obtain test samples. The MICM diagnosis method is not only an invasive and expensive operation, but also requires higher medical conditions and professional researchers to interpret the report. Therefore, we need to find a more accurate and advanced non-invasive biomarker for the early diagnosis of leukemia. In recent years, circulating miRNAs have come into the field of researchers due to their stability, high sensitivity and specificity. As a novel method for diagnosing leukemia, circulating miRNA is a non-invasive method, and it is convenient to obtain samples and relatively cheap. Xie 12 found that the sensitivity and specificity of miR-155 in the serum of AML patients were 69% and 83%, respectively. However, Zhi et al 20 found that miR-155 reached a relatively higher sensitivity and specificity of 90% and 93% in serum of AML patients. Nabhan et al 27 revealed that the sensitivity and specificity of miR-181a in the serum of ALL patients were 87% and 93%, respectively. However, Luna-Aguirre et al 13 found that miR-511 has very high diagnostic sensitivity and specificity in the plasma of ALL patients, both reaching 1.00, which is a very ideal biomarker. Moreover, both Xu 38 and Ommanuel’s 39 meta-analysis showed that miRNA circulating in the blood is a promising diagnostic biomarker for hematological cancer. Although these results are inconsistent, they indicate that miRNA is a promising biomarker for early diagnosis of leukemia.
Therefore, we thoroughly searched multiple databases and collected 49 studies on the value of peripheral blood miRNA in the early diagnosis of leukemia to complete this meta-analysis. The overall results for diagnosis showed that the overall pooled sensitivity was 0.83 (95% CI: 0.79-0.86), specificity was 0.92 (95% CI: 0.89-0.94), PLR was 10. 8 (95% CI: 7.8-14.9), NLR was 0.18 (95% CI: 0.15-0.22) and DOR was 59 (95% CI: 38-91). The SROC curve was drawn and obtained the corresponding AUC value is 0.94, which indicates that circulating miRNAs could distinguish leukemia patients from healthy controls and its diagnostic accuracy of circulating miRNA in leukemia patients reached the high level of evaluation criteria in diagnosis. 40
A meta-regression analysis and subgroup analysis were conducted according to the country, miRNAs profiling, regulation mode, sample size, specimen types and types of leukemia to explore possible sources of between-study heterogeneity. The meta-regression analysis suggested that regulation mode, sample size and specimen types might be potential sources of heterogeneity in sensitivity and specificity (P < 0.001). Subgroup analyses suggested that the miRNA cluster showed a better diagnostic accuracy than single ones, which is consistent with the current research results. 38,39 For example, Wang et al 18 found that the diagnostic value of miR-29a + miR-142-3p in AML patients showed sensitivity was 90%, specificity was 100%, and the AUC value was 0.97; Zhu et al 21 found that miR-23a + miR-130a in CML patients have a sensitivity of 70%, a specificity of 95%, and an AUC value of 0.95; the diagnostic accuracy of each single miRNA was lower than that of the miRNA cluster. A single miRNA is not only expressed in hematological tumors, but also may fluctuate in other diseases, so a single miRNA has poor specificity. 41 In contrast, miRNA clusters have complex molecular mechanisms and can reflect the occurrence and development of tumors in various ways, thereby forming a more stable and reliable network diagnostic structure. 6 Furthermore, the overall diagnostic accuracy of plasma type had better diagnostic value than serum, which is consistent with the previous studies, 42,43 and it may be because plasma retains more protein for co-separation of miRNA. 44 Moreover, we found that acute lymphocytic leukemia patients displayed a better performance than other subgroups, with 89% sensitivity and 99% specificity, an AUC value of 0.99. This is inconsistent with previous results, so large-scale prospective studies are still needed to consolidate the results. In addition, our research also found that upregulated miRNAs showed slightly better diagnostic performance than downregulated miRNAs. This may be due to the different statistical methods and platforms used in microarray technology, the types of miRNAs and the different sample sizes. Finally, in this meta-analysis, we found that the sample size does not have much influence on the diagnosis of leukemia, but we still need a larger sample size to verify this result.
This is the latest comprehensive meta-analysis, the included studies were independently selected by 2 researchers based on strict inclusion and exclusion criteria, and included the current latest research, which solved the issue of whether circulating miRNAs can be used for early diagnosis of leukemia. We have made every effort to avoid publication bias, but we also recognized that there are still some limitations. First, although a comprehensive search strategy is adopted in our literature search process, some valuable research may be lost. Secondly, individual studies contain a small number of samples, which may limit the strength of our conclusions; thirdly, we did not extract cut-off values, which may lead to inconsistent conclusions. Forth, studies with positive results are easier to publish, and some studies with negative results may not be published, which may lead to an expansion of the overall diagnostic accuracy. Finally, the currently included studies only have data from China, Egypt, Mexico, and Belgium. The diagnostic accuracy of peripheral blood miRNAs for leukemia populations in other countries is unknown.
Conclusion
In summary, circulating microRNAs can be used as a promising noninvasive biomarker in the early diagnosis of leukemia. Using miRNA clusters and plasma specimens can improve diagnostic accuracy. In the future, large-scale multicenter clinical research is still needed to improve its efficacy, so that it can be used in daily clinical work as soon as possible to provide new methods for early diagnosis of leukemia patients.
Footnotes
Authors’ Note
Our study did not require an ethical board approval because it is a meta-analysis and it did not contain human or animal trials.
Declaration of Conflicting Interests
The author(s) declared no potential conflicts of interest with respect to the research, authorship, and/or publication of this article.
Funding
The author(s) received no financial support for the research, authorship, and/or publication of this article.