
Abstract
Introduction
The MYCN oncogene promotes tumor cell proliferation in neuroblastoma, and its amplification is a well-established marker of poor prognosis. Radiomics-based approaches have shown promise in noninvasively determining MYCN amplification status; however, their diagnostic performance has varied significantly across studies. This systematic review and meta-analysis aimed to quantitatively evaluate the diagnostic accuracy of radiomics-based machine learning models for determining MYCN amplification in neuroblastoma and to critically assess the methodological quality of the included studies.
Methods
A systematic search of articles published between January 1, 2000, and June 30, 2024, was conducted across PubMed, Embase, Web of Science, and the Cochrane Library. The articles focused on using radiomics to determine MYCN amplification in neuroblastoma. Methodological quality was assessed using the Radiomics Quality Score (RQS), METhodological RadiomICs Score (METRICS), and Quality Assessment of Diagnostic Accuracy Studies 2 (QUADAS-2) tools. A meta-analysis of validation performance was performed on studies with Transparent Reporting of a Multivariable Prediction Model for Individual Prognosis or Diagnosis statement Type 2a or higher.
Results
Nine studies with 851 patients were included, and seven studies with 217 patients in the validation set were eligible for meta-analysis. The RQS scores ranged from 10 to 16 (mean 12), and METRICS scores ranged from 28.8% to 78.4% (mean 59.7%). QUADAS-2 assessment indicated that most studies had a low or unclear risk of bias. The pooled sensitivity, specificity, positive likelihood ratio, and negative likelihood ratio were 0.78, 0.92, 9.45, and 0.24, respectively. The area under the summary receiver operating characteristic curve was 0.94 (95% confidence interval: 0.91-0.95).
Conclusion
Despite variability in study design and bias risk, radiomics shows promise as a non-invasive method for detecting MYCN amplification in neuroblastoma. Further refinement and validation in multicenter studies with larger sample sizes are needed to enhance its clinical applicability.
Introduction
Neuroblastoma arises from immature neurons of the sympathetic nervous system and often occurs in childhood.1,2 The MYCN oncogene plays an important role in neuroblastoma pathogenesis, as it can drive both the proliferation and differentiation of tumor cells. 3 Amplification of the MYCN oncogene, present in approximately 20% of cases, is a well-established biomarker of high-risk status and is associated with aggressive tumor behavior, rapid progression, and poor prognosis in neuroblastoma. 4 Regardless of histological subtypes or clinical presentations, neuroblastoma patients with MYCN amplification are classified as high-risk according to the International Neuroblastoma Risk Group (INRG) classification system. 5 Consequently, assessing MYCN amplification status is crucial for tailoring treatment strategies for neuroblastoma patients. However, accurately determining MYCN amplification status can be challenging due to tumor heterogeneity and potential sampling errors during invasive biopsy. 6 These limitations highlight the need for non-invasive diagnostic approaches to improve the detection and management of MYCN amplification in neuroblastoma. 7
Some reports have demonstrated the potential of radiomics-based machine learning in determining the MYCN amplification status in neuroblastoma.8-10 Radiomics, an emerging technology in medical image analysis, provides a more detailed characterization of tumors than traditional imaging methods by extracting a large number of quantitative voxel features from medical images, thereby enhancing the diagnostic capabilities of current imaging modalities.11,12 Radiogenomics, a subset of radiomics, links the imaging features with genetic and molecular profiles of tumors, offering a deeper understanding of tumor biology. 13 This approach allows for non-invasive prediction of genetic alterations, such as MYCN amplification, by analyzing the imaging data. Consequently, identifying MYCN amplification status through radiomics-based machine learning could lead to improve the accuracy of neuroblastoma non-invasive diagnosis.
Despite the potential of radiomics in determining MYCN amplification status in neuroblastoma as shown in multiple studies, its diagnostic performance varies significantly across different reports.14-16 Some studies have reported that the area under the receiver operating characteristic curve (AUC) for predicting MYCN amplification in neuroblastoma can exceed 0.90,8,10 while others reported an AUC of only 0.75. 17 This discrepancy may stem from differences in sample size, imaging modalities, feature extraction methods, machine learning algorithms, and study design. Therefore, a systematic evaluation of radiomics studies in determining MYCN amplification status in neuroblastoma is necessary to determine its practical value and limitations. Such an evaluation can lay the foundation for future research, further improving diagnostic performance and clinical applicability of radiomics in determining MYCN amplification status in neuroblastoma.
Therefore, this systematic review and meta-analysis aimed to investigate the effectiveness of radiomics-based machine learning in determining MYCN amplification status in childhood neuroblastoma. Additionally, it aimed to assess the methodological quality of radiomics studies in this context.
Materials and Methods
Registry Information and Evidence Collection Protocol
The study was prospectively registered with the International Prospective Register of Systematic Reviews (PROSPERO) (ID: CRD42024566020) and adhered to the guidelines outlined by the Preferred Reporting Items for Systematic Reviews and Meta-analyses of Diagnostic Test Accuracy Studies (PRISMA-DTA). Since this research involved a secondary analysis of pre-existing literature, ethical approval and informed consent were not required.
Systematic Literature Search and Study Selection Procedure
Two reviewers, each with 4 and 15 years of experience in pediatric imaging, respectively, jointly conducted a search for original articles exploring the application of radiomics in assessing MYCN amplification status in neuroblastoma. The search was performed across PubMed, Embase, Web of Science, and the Cochrane Library for studies published from January 1, 2000, to June 30, 2024. Discrepancies were resolved through discussion to achieve consensus. The search strategy employed was: ((radiomics) OR (radiogenomics) OR (texture analysis) OR (artificial intelligence) OR (deep learning) OR (machine learning)) AND ((neuroblastoma) OR (neuroblastic tumor) OR (NB)) AND ((MYCN) OR (N-Myc)). To ensure thoroughness, no restrictions were placed on imaging modalities during the initial search; however, these modalities were limited during the subsequent manual review. Articles were selected based on the following criteria. Inclusion criteria: (1) Studies published in English with full-text availability; (2) Studies involving patients with neuroblastoma; (3) Use of imaging modalities such as CT, MRI, or PET/CT; (4) Employment of radiomics or texture features from medical images to determine MYCN amplification status. Exclusion criteria: (1) Duplicate studies; (2) Case reports, conference abstracts, reviews, or editorials; (3) Studies focusing exclusively on segmentation or feature extraction algorithms.
Data Extraction
Two reviewers, working together, collected the following information from each study: 1) Study general characteristics: including the authors, year of publication, type and design of the study, and the country of origin; 2) Participant characteristics: total number of cases, cases with and without MYCN amplification, tumor location, INRG stages, and reference standard; 3) Radiomics and machine learning characteristics: imaging modality, imaging phase/sequence, tumor segmentation method, number of extracted and selected radiomics features, modeling and validation approach, as well as sensitivity, specificity, and AUC values. From these details, we computed the numbers for True Positives (TPs), False Positives (FPs), False Negatives (FNs), and True Negatives (TNs). We only documented the performance metrics from the validation set of the proposed radiomics models to avoid overfitting in the training process, so only the studies with Transparent Reporting of a Multivariable Prediction Model for Individual Prognosis or Diagnosis (TRIPOD) statement Type 2a or above were included into subsequent meta-analysis. In cases where multiple radiomics models were developed for the same patient group in a study, only the model demonstrating the highest diagnostic performance was included in the meta-analysis.
According to the TRIPOD statement, studies can be classified based on the model's validation method and study design. 18 TRIPOD types include Type 1a (model development and evaluation on the same dataset), Type 1b (internal validation using methods like cross-validation or bootstrapping), Type 2a (validation on a randomly splitting dataset), Type 2b (validation on a non-randomly splitting dataset), Type 3 (validation on a completely independent dataset), and Type 4 (validation of an external model using independent data). Additionally, based on sample size and design, studies can be categorized into Discovery Science (experimental research), Phase 0 (retrospective, internal validation with <100 patients or >100 patients), Phase I (retrospective, external validation with <100 patients), Phase II (retrospective, external validation with >100 patients), Phase III (prospective, external validation with >100 patients), and Phase IV (real-world application). 19
Assessment of Methodological Quality
Two reviewers assessed the methodological quality of the included articles using the Radiomics Quality Score (RQS), METhodological RadiomICs Score (METRICS), and the Quality Assessment of Diagnostic Accuracy Studies (QUADAS-2) tools. The METRICS scores were calculated using a user-friendly online calculation tool https://metricsscore.github.io/metrics/METRICS.html.
RQS is a standardized tool developed by Lambin et al 20 to assess the methodological quality of radiomics studies. It consists of 16 scoring items that evaluate key aspects such as the quality of imaging acquisition protocols, image segmentation, feature selection, model validation methods, and clinical utility. The maximum RQS score is 36, which corresponds to 100% on the scoring scale. Under the RQS framework, the total score for a radiomics study can range from −8 to 36, with scores between −8 and 0 defined as 0%. A higher RQS score indicates better methodological rigor and reliability, reflecting higher standards in study design and reporting.
METRICS is a new evaluation framework released in 2024 by a group of international experts, designed to assess the quality and transparency of studies in radiomics and machine learning. 21 This framework aims to provide detailed guidelines to ensure the reproducibility and reliability of research. METRICS consists of 9 major categories, including study design, imaging data, image segmentation, image processing and feature extraction, model development and validation, results reporting, model performance interpretation, etc. Within these 9 categories, there are 30 specific items, each with corresponding scoring criteria.
QUADAS-2 is a widely used tool for assessing the quality of diagnostic accuracy studies. 22 It helps evaluate both the risk of bias and the applicability of studies, ensuring the reliability and clinical relevance of diagnostic research. QUADAS-2 consists of four domains: Patient Selection, Index Test, Reference Standard, and Flow and Timing. Each domain includes signaling questions that aid in evaluating potential bias, with each domain rated as low, high, or unclear risk of bias.
Statistical Analysis
STATA (version 14.0), Review Manager (version 5.4.1) and RStudio (version 4.1.3) were used for statistical analysis. First, Egger's test were applied to assess potential publication bias. We then calculated the pooled sensitivity, specificity, positive likelihood ratio (PLR), and negative likelihood ratio (NLR), diagnostic score, and odds ratio to evaluate the diagnostic performance of the included studies. Based on these metrics, we further plotted the summary receiver operating characteristic (SROC) curve and assessed the diagnostic ability of these studies for determining MYCN amplification status by calculating the AUC and its 95% confidence intervals (CIs). Additionally, we created forest plots and conducted a quantitative analysis of the heterogeneity between studies using the I2 test. Significant heterogeneity was considered when the I2 value was greater than 50%. To further explore the potential sources of heterogeneity, we performed meta-regression and subgroup analysis to identify factors that may influence the heterogeneity. When the P-value was less than 0.05, it indicated statistical significance.
Results
Selection Process and Overview of Included Studies
A total of nine studies involving 851 patients were included in this systematic review8-10,14-17,23,24 (Figure 1). Of these, six studies used CT,8-10,14,15,24 two used PET/CT,16,23 and one used MRI. 17 The general characteristics of the studies included in the review are summarized in Table 1. Among the studies, only one employed deep learning for tumor lesion segmentation, 24 while the remaining eight used manual segmentation. All studies adopted a validation approach, with one study using external validation and the other eight relying on internal validation. Table 2 provides an overview of the radiomics and machine learning characteristics of the included studies. Eight studies provided detailed information on the categories of radiomics features used to determine MYCN amplification status (Table 3). According to the TRIPOD statement, two studies were classified as Type 1b,15,24 five as Type 2a,8,10,14,16,23 one as Type 2b, 9 and one as Type 3. 17 Consequently, seven studies,8-10,14,16,17,23 with a total of 217 patients in the validation set, were eligible for subsequent meta-analysis.

Flowchart for Literature Screening.
General Characteristics of Studies Included in the Systematic Review.

FISH, Fluorescence In Situ Hybridization.
Radiomics and Machine Learning Characteristics of Studies Included in the Systematic Review.

ICC, intra-class correlation coefficient; TRIPOD, Transparent Reporting of a Multivariable Prediction Model for Individual Prognosis or Diagnosis; RQS, radiomics quality score; mRMR, minimum Redundancy Maximum Relevance; LASSO, Least Absolute Shrinkage and Selection Operator; LR, logistic regression; SVM, support vector machine; RF, random forest; DT, decision tree; ANN, artificial neural network.
Summary of the Radiomics Features Used to Determine MYCN Amplification Status.

RQS, METRICS, and Bias Risk Assessment
The RQS scores of the included studies ranged from 10 to 16, with a mean of 12 and a standard deviation of 2. Specifically, two studies had an RQS score of 10,9,15 two studies scored 12,14,16 and another two scored 14.8,10 Detailed RQS scoring information for each included study is presented in Table 4. The METRICS scores of the included studies ranged from 28.8% to 78.4%, with a mean of 59.7% and a standard deviation of 13.8%. Among these, five studies were categorized as having “Good” quality,8,10,17,23,24 three were rated as “Moderate”,9,14,16 and one was rated as “Low”. 15 Table 5 provides detailed METRICS scoring information for each included study. Based on the QUADAS-2 evaluation, most studies showed either a low or unclear risk of bias. The results of the risk of bias and applicability concerns, as assessed using the QUADAS-2 tool, are presented in Figure 2.
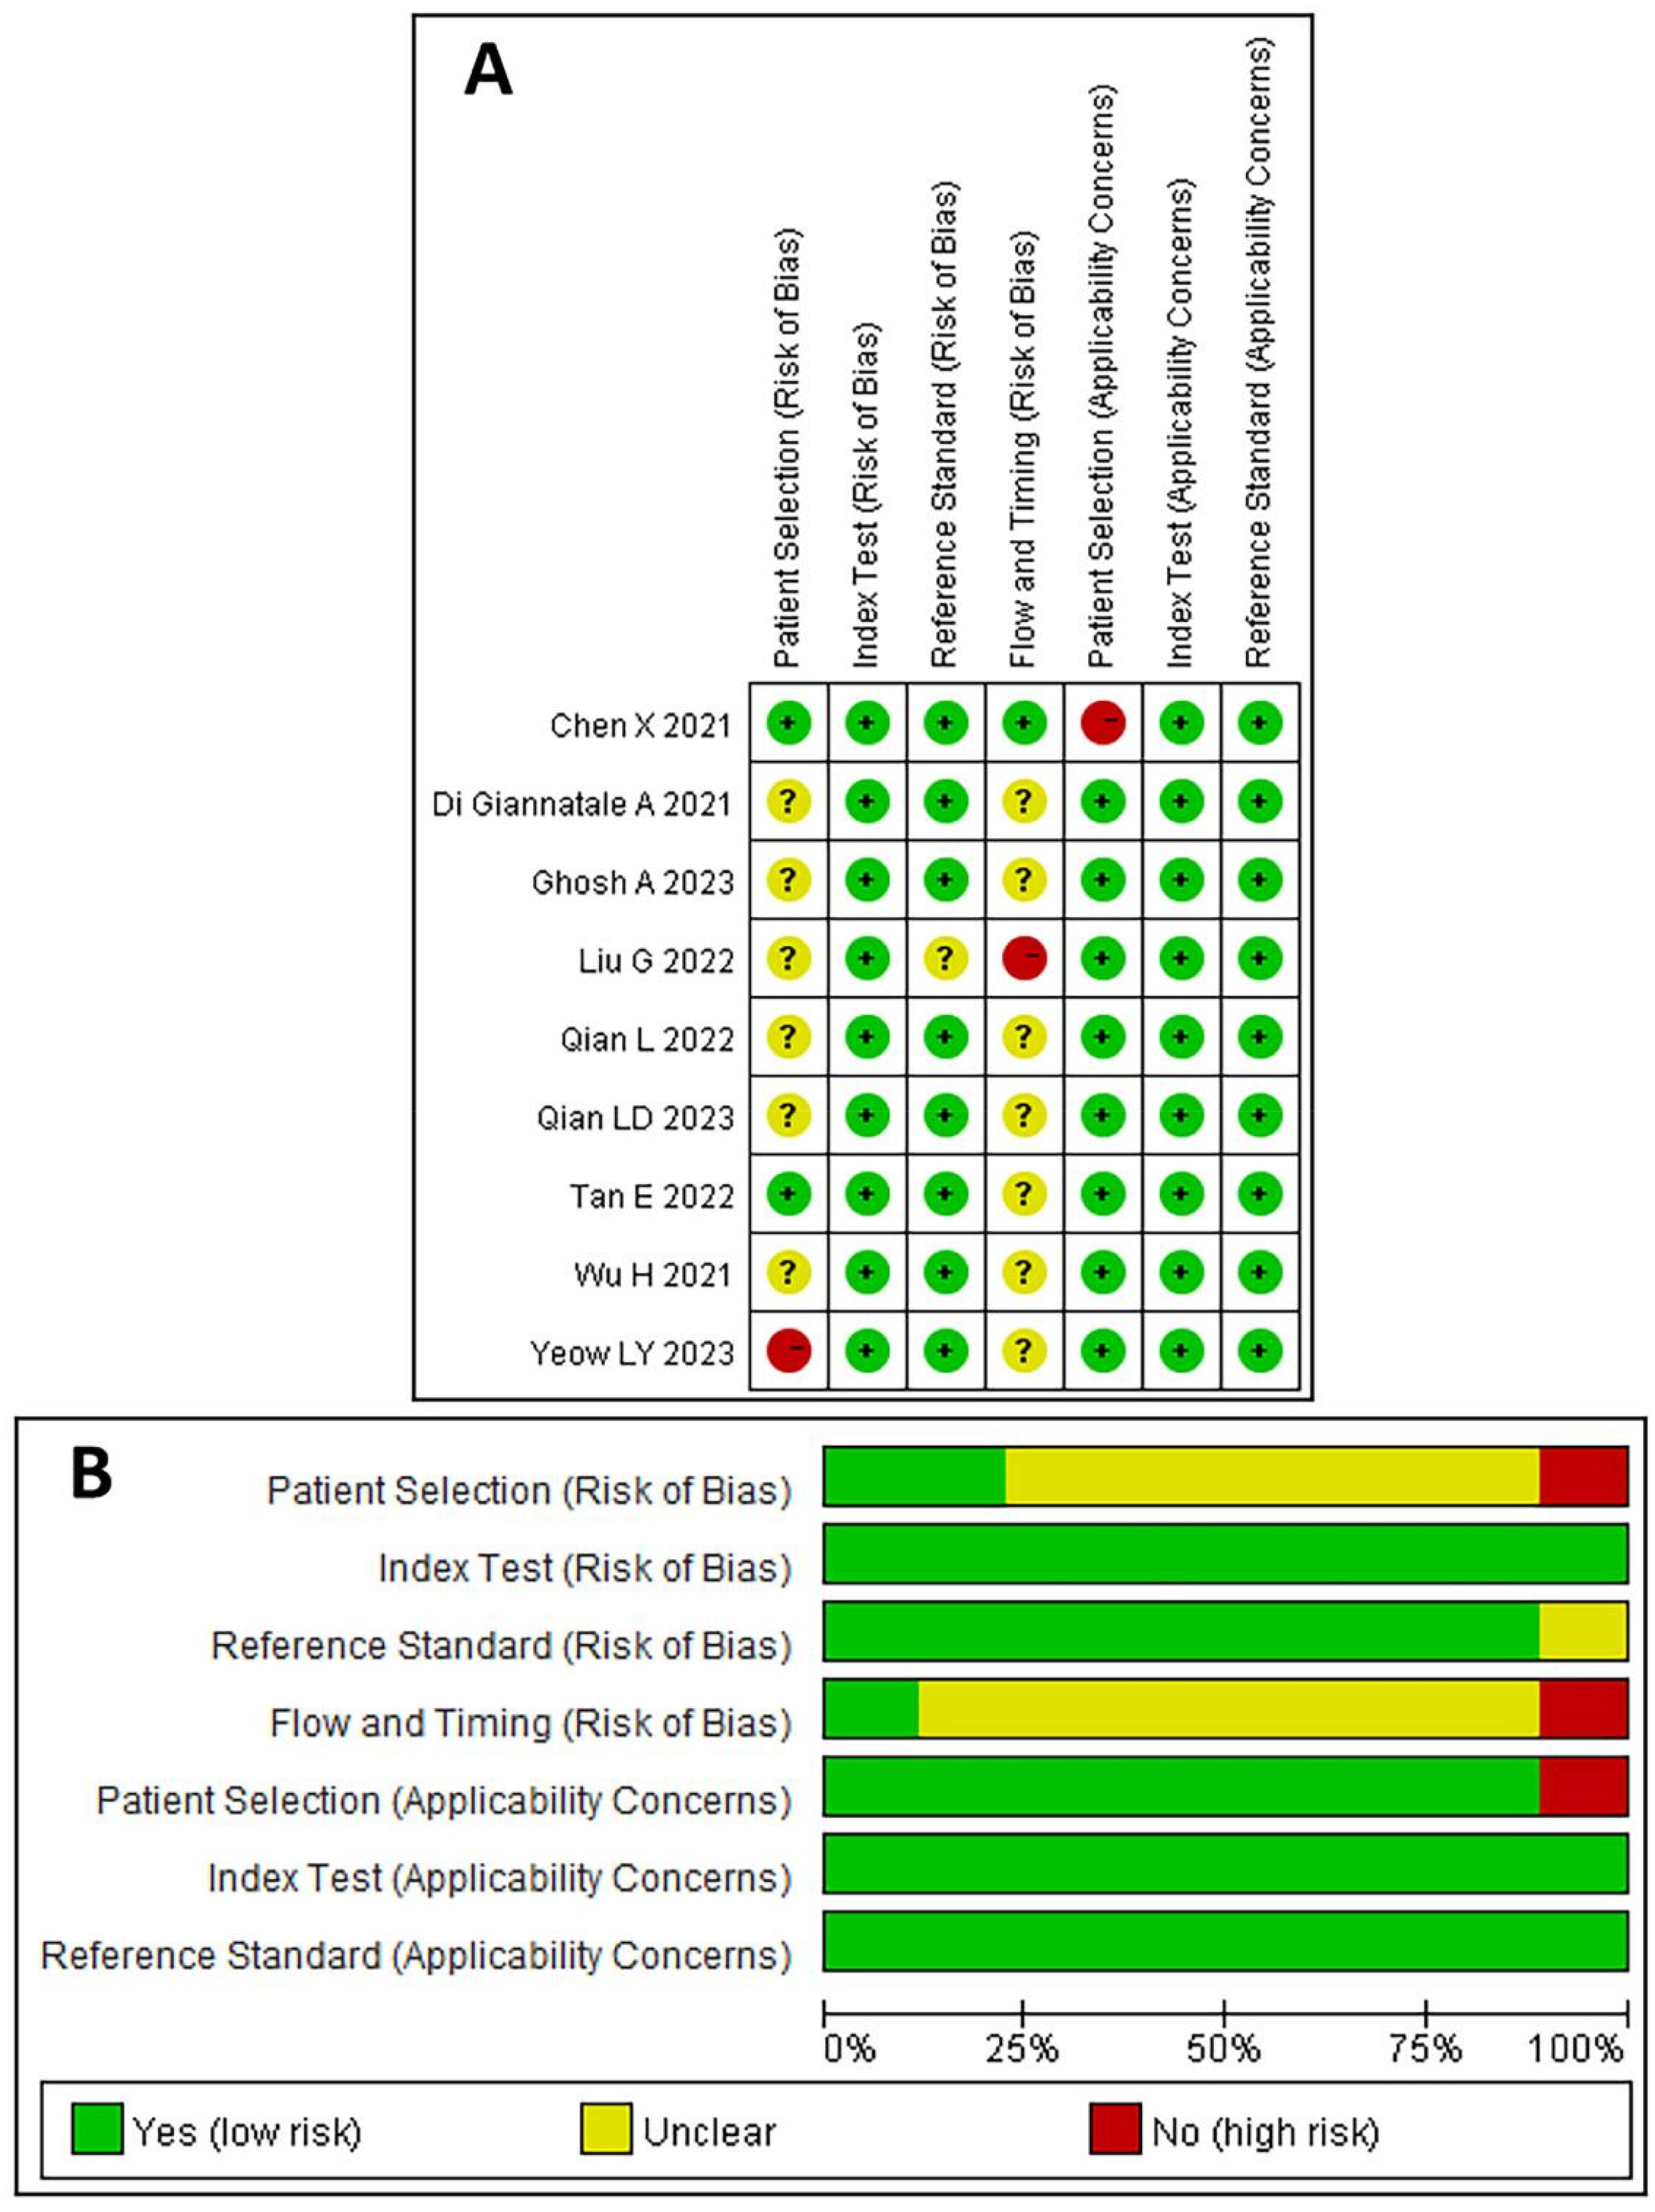
Methodological Quality Assessment of the Included Studies Using the Quality Assessment of Diagnostic Accuracy Studies 2 (QUADAS-2) Tool. (
The Radiomics Quality Score of the Included Studies.

The METhodological RadiomICs Score (METRICS) of the Included Studies.

Meta-Analysis
Egger's test indicated no publication bias among the included studies (P = 0.731). The pooled sensitivity, specificity, PLR, NLR, diagnostic score, and odds ratio for the radiomics-based machine learning model determining MYCN amplification status were 0.78 (95% CI: 0.49-0.93), 0.92 (95% CI: 0.81-0.97), 9.45 (95% CI: 4.46-20.00), 0.24 (95% CI: 0.09-0.64), 3.68 (95% CI: 2.58-4.78), and 39.66 (95% CI: 13.16-119.51), respectively. Figure 3 displays the forest plots for these metrics. The I2 values for sensitivity, specificity, and NLR across the studies were 77.14%, 49.31%, and 90.77%, respectively, suggesting substantial heterogeneity among the included studies. The AUC of the SROC curve for determining MYCN amplification status was 0.94 (95% CI: 0.91-0.95), indicating high diagnostic performance (Figure 4).
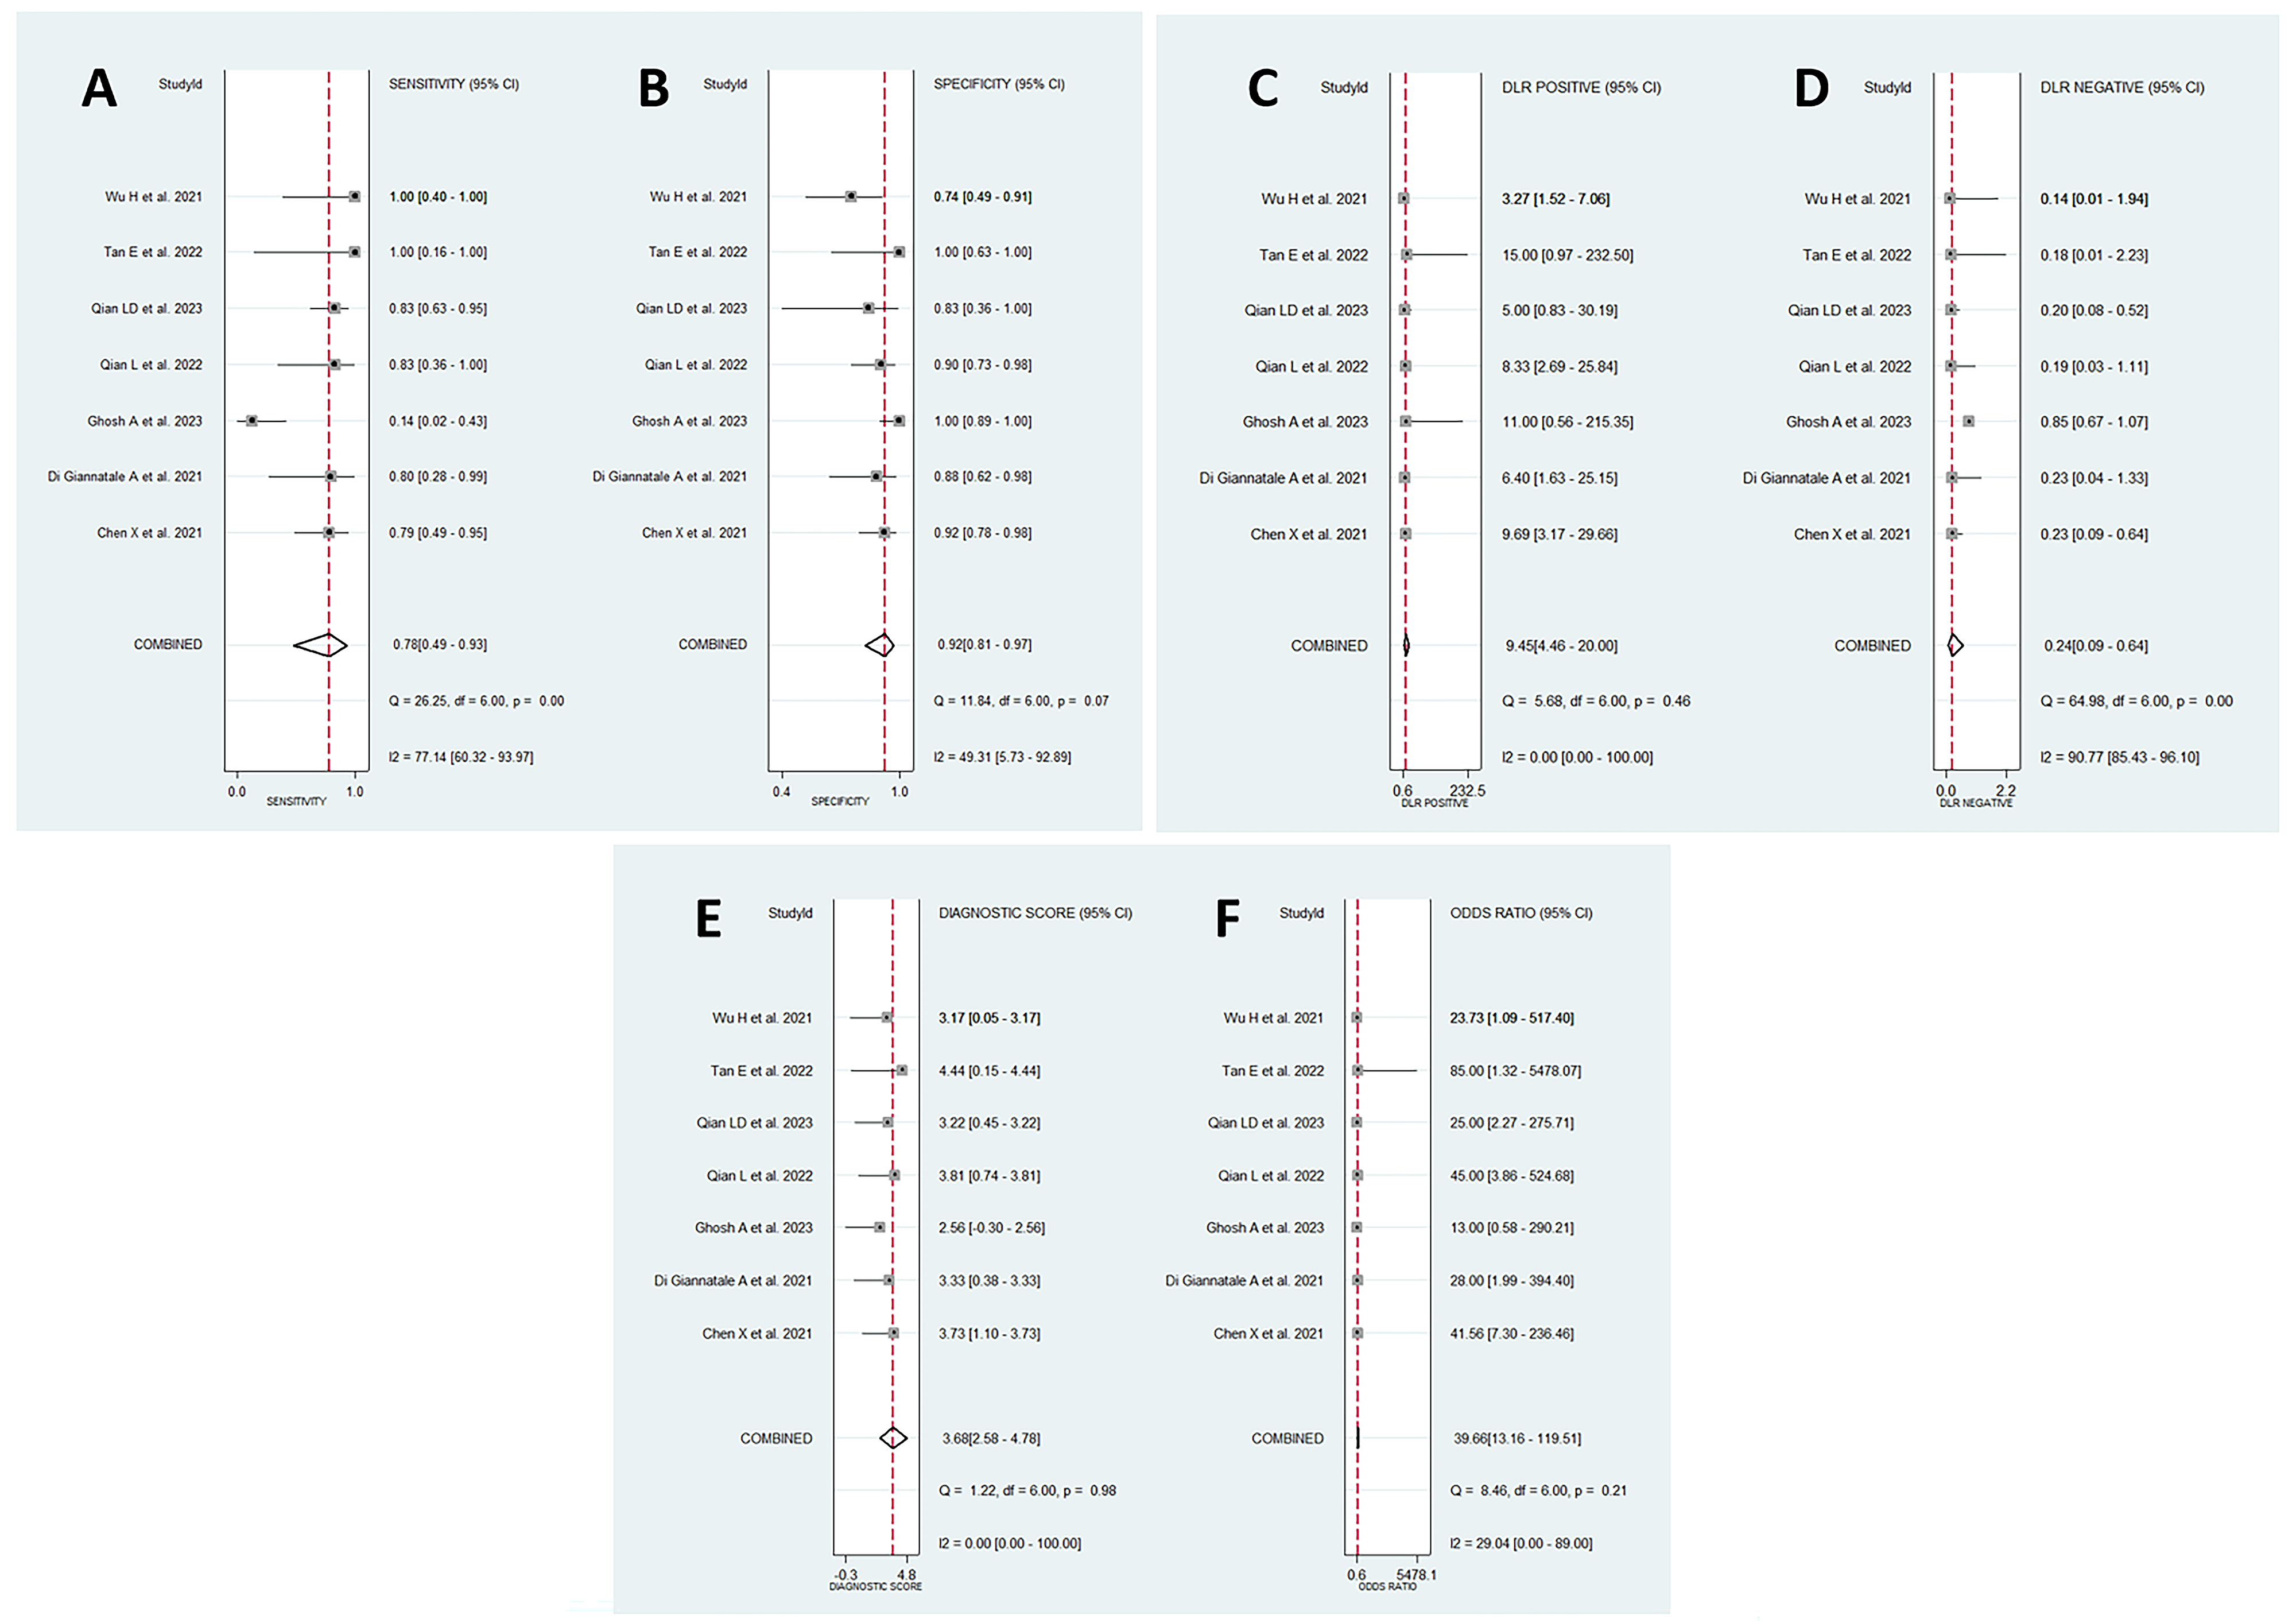
Forest Plots of Metrics for Radiomics-Based Machine Learning Models Used to Determine MYCN Amplification Status: (

Summary Receiver Operating Characteristic (SROC) Curve of Radiomics-Based Machine Learning Models Used to Determine MYCN Amplification Status in Neuroblastoma. AUC, Area Under the Curve.
Meta-Regression and Subgroup Analyses
The meta-regression analysis identified imaging modality as a significant contributor to heterogeneity among studies (P = 0.047) (Figure 5A). While over resampling appeared to influence heterogeneity, its effect did not reach statistical significance (P = 0.061) (Figure 5B). Other factors, including the number of patients (P = 0.116), intra-class correlation coefficient analysis (P = 0.255), and image preprocessing approach (P = 0.266), were found to have no significant impact on heterogeneity. The detailed results of the meta-regression and subgroup analyses across various factors are illustrated in Figure 5.

Meta-Regression and Subgroup Analyses Evaluating the Influence of Imaging Modality (
Discussion
The determination of MYCN amplification status is crucial for risk stratification in patients with neuroblastoma. In this study, we systematically reviewed nine studies that utilized radiomics to determine MYCN amplification status. Although these studies showed variability in design and sample size, their overall quality was acceptable, with five studies achieving a “Good” quality rating based on the METRICS scoring system. Additionally, we performed a meta-analysis of the performance of radiomics models on validation datasets, revealing an SROC-AUC value of 0.94 (95% CI: 0.91-0.95). These findings suggest that radiomics has a high diagnostic efficacy in identifying MYCN amplification status. However, significant heterogeneity was observed among the published studies, with image modality identified as a major contributing factor. Therefore, future research still needs to emphasize standardization in model development and validation processes to enhance reproducibility and facilitate clinical translation.
The recommended imaging modalities for neuroblastoma typically include ultrasound, CT, MRI, and MIBG. 25 Each modality plays a unique role in the clinical management of neuroblastoma. Since neuroblastoma primarily occurs in pediatric patients, efforts should be made to minimize the additional radiation burden from imaging examinations. Therefore, CT scans are often performed using a single-phase venous imaging protocol. Due to its short examination time and the absence of a need for anesthesia, CT remains widely used for preoperative evaluation of thoracoabdominal neuroblastomas. Of the nine studies included, six utilized CT imaging,8-10,14,15,24 with four specifically employing the recommended venous phase.9,14,15,24 Our meta-analysis revealed no significant heterogeneity among studies using CT images, suggesting that future research should prioritize single venous phase imaging for assessing MYCN amplification.
It is noteworthy that image modality image was identified as a major contributing factor for heterogeneity among studies. The findings showed that radiomics models based on CT images performed better in identifying MYCN amplification status compared to MRI. This superiority may be attributed to the higher spatial resolution and sensitivity of CT imaging in capturing subtle differences in tissue density. A previous study also highlighted that venous phase CT imaging radiomics outperforms MRI in the differential diagnosis of pathological neuroblastoma subtypes. 26 However, current studies on MRI radiomics in neuroblastoma have primarily focused on conventional T1WI and T2WI images. Whether multiparametric MRI could offer additional insights for determining MYCN amplification remains an area for further exploration. Additionally, two studies employed 18F-FDG PET/CT, which demonstrated high predictive value for MYCN amplification. However, 18F-FDG PET/CT is not a standard imaging modality for neuroblastoma evaluation. Given the superior diagnostic accuracy of MIBG for detecting bone metastases in neuroblastoma, PET/CT is less widely used compared to MIBG.
In the present review, eight studies reported detailed radiomics feature categories, including first-order statistics (eg, skewness, kurtosis, percentile values), texture features derived from Gray Level Co-occurrence Matrix, Gray Level Size Zone Matrix, and Gray Level Dependence Matrix, as well as shape-based descriptors.8-10,14,16,17,23,24 Among these, texture features predominated in models for identifying MYCN amplification. A CT-based study extracted over 1200 features across triphasic scans, ultimately selecting 14 optimal predictors, including eight wavelet-transformed and five LoG-transformed texture features, demonstrating that higher-order filters enhanced discriminatory performance compared to original and first-order features. 10 Collectively, these findings highlight that texture-rich, higher-order radiomics features are particularly sensitive to the intratumoral heterogeneity characteristic of MYCN amplification in neuroblastoma, especially those derived from Gray Level Size Zone Matrix, wavelet, and LoG filters.
Although the clinical value of radiomics has been demonstrated in various diseases, its low reproducibility remains a pressing issue. 27 As a methodological approach, radiomics has prompted the academic community to propose stricter standards for its workflows and methods to maximize its potential for clinical translation. Efforts such as the RQS and METRICS scoring frameworks aim to enhance the overall quality of radiomics research.20,21 Among the nine studies we included, only four applied image preprocessing, and five conducted ICC analyses. Furthermore, significant variability was observed in the machine learning algorithms used to build models across different studies.
More importantly, MYCN amplification occurs in only approximately 20% of neuroblastoma cases, resulting in a significant class imbalance that may compromise the performance and generalizability of machine learning models. Classifiers trained on such imbalanced datasets often exhibit artificially high overall accuracy or AUC by disproportionately favoring the majority class, thereby obscuring poor sensitivity in detecting the clinically critical MYCN-amplified cases. Although data-level solutions such as oversampling are commonly used to mitigate class imbalance, only five of the reviewed studies8,10,16,17,23 reported implementing such techniques. Moreover, oversampling can introduce new challenges, including overfitting to synthetic data and reduced model performance on external validation cohorts. To enhance the reliability and clinical applicability of radiomics models, future studies should predefine strategies for managing class imbalance and prioritize validation using independent, real-world datasets.
Significantly, based on the QUADAS-2 assessment tool, we found that most studies had an unclear rating for the “Flow and Timing” domain. The majority of studies did not specify the time interval between imaging acquisition and MYCN gene testing, nor did they report whether time differences could introduce bias. While FISH testing is regarded as the best method for determining MYCN amplification status, 28 the strong heterogeneity of neuroblastoma may be influenced by temporal and spatial factors. 6 Therefore, future studies should not only use imaging and genetic data obtained prior to treatment but also report the time interval between imaging acquisition and MYCN gene testing. Additionally, since MYCN amplification most commonly occurs in abdominal neuroblastomas, particularly those located in the adrenal glands, 29 and neuroblastoma can arise at any location within the peripheral sympathetic nervous system, future research should also assess the generalizability of radiomics models predicting MYCN amplification across different anatomical sites.
However, our study still had several limitations. First, due to the rarity of neuroblastoma, with a low prevalence of MYCN amplification, resulting in a limited number of studies available for inclusion in our review. Despite these constraints, a systematic review is still particularly valuable at this stage, as it provides a timely summary of the current evidence, highlights methodological limitations, and identifies key areas for improvement. Second, all the included studies were retrospective, which may have introduced selection bias in patient inclusion. Lastly, the small number of relevant studies, most of which focused on CT imaging (with only one study utilizing MRI and two studies employing PET/CT to detect MYCN amplification), restricted our ability to perform comprehensive meta-analyses for MRI and PET/CT.
Conclusion
In conclusion, despite variability in study design and potential bias, current evidence still demonstrates that radiomics-based machine learning as a non-invasive method holds promise for detecting MYCN amplification in neuroblastoma. However, the diagnostic performance of radiomics-based machine learning for identifying MYCN amplification may vary across different image modalities. Therefore, further refinement and validation through larger-scale, multicenter studies using recommended image modalities are necessary to enhance its clinical applicability.
Footnotes
Abbreviations
Author Contributions
JC and HW conceived the project. HW, XC, LH, and XF collected the data. HW and YJ analyzed the data and performed meta-analysis. HW wrote the first draft of the manuscript. JC revised this manuscript. All authors read and approved the final manuscript.
Funding
The authors received no financial support for the research, authorship, and/or publication of this article.
Declaration of Conflicting Interests
The authors declared no potential conflicts of interest with respect to the research, authorship, and/or publication of this article.
Data Availability Statement
All data generated or analyzed during this study are included in this published article.