
Abstract
Introduction
Breast carcinoma (BC) is the most common carcinoma in women and is also the leading cause of cancer-related deaths worldwide. 1 BC histological grade is an independent prognostic factor that consists of information about 3 aspects, namely, the degree of glandular ducts, pleomorphism of nucleus, and chromatin and mitotic phase. 2 The histological grade of BC maintains its pivotal role within the prognostic classification framework of the Nottingham Prognostic Index. 3
Invasive BC, which represents the predominant histological subtype of breast cancer, constitutes approximately 80% of all breast cancer cases. 4 Different histological grades of invasive BC have different management and treatment schemes.5,6 Hence, an accurate diagnosis of histological grade in patients with invasive BC has a tremendous influence on the prognosis. Clinically, pre-operatively histological grade of invasive BC is mainly confirmed pathologically by ultrasound-guided biopsy, which is an invasive method and still associated with some unacceptable complications, including hematoma, pain, and infection. 7
Medical images include information that reveals underlying pathophysiology and these internal connections could be illustrated by a number of advanced methods of image processing. 8 The radiomics enables application of advanced image analysis in the standard clinical setting, which converts digital medical images into mineable data.9,10 Advances in machine learning have also opened up new view points for ultrasound (US) image analysis by using radiomics.
Breast US is widely used as a noninvasive, nonradiative and inexpensive modality to help clinician to detect and diagnose BC, clinically. There is evidence showing that some gray scale features of US have a close relationship with histological grade of invasive BC.11,12 However, the reproducibility and accuracy of the interpretations of ultrasonic imaging varies greatly among different ultrasonographers because of the considerable subjectivity of the understanding and application of diagnostic criteria. Theoretically, US images possibly contain hidden information that can be hardly perceived by the naked eye. 13 Furthermore, US imaging has been universally utilized in the field of breast and lots of studies have demonstrated that US radiomics analysis is able to predict malignant breast tumor,14,15 axillary lymph node metastasis, 16 hormone receptor-positive BC, 17 human epidermal growth factor receptor 2 (HER2) expression, 18 Ki-67 expression level, 19 neoadjuvant chemotherapy responses,20,21 and disease-free survival of invasive BC. 22
To the best of our knowledge, no multicenter study has been conducted to pre-operatively predict histological grade of invasive BC using the method of US-based radiomics except for ours. In our study, it was hypothesized that US radiomics features extracted from the invasive BC lesions and machine learning classifiers can be used to develop imaging biomarkers that may differentiate the high histological grade (grade III) from low histological grade (grade I and II) of invasive BC, noninvasively.
Materials and Methods
The study was approved by the Institutional Review Board of all the hospitals and complied with the Declaration of Helsinki. The informed consent was waived because of the retrospective nature of this study.
Data Source and Patient Selection
Our multicenter study was conducted at 2 hospitals: Hospital 1 (Zhejiang Cancer Hospital, approval number IRB-2022-548) and Hospital 2 (Dongyang People's Hospital, approval number 2024-YX-111). Finally, 297 patients with invasive BC meeting the inclusion criteria from Hospital 1 were consecutively enrolled between March 2019 and December 2021 and divided into 2 either a training or an internal validation set at a ratio of 7:3. A number of 207 cases were enrolled in the training set, and 90 cases were enrolled in the internal validation set. Another independent set of 86 patients was consecutively enrolled from September 2021 to December 2022 at Hospital 2 as the external validation set. The procedure of inclusion and exclusion of patients is revealed in Figure 1. The reporting of this study conforms to STROBE guidelines (https://www.equator-network.org/reporting-guidelines/strobe/). We also have de-identified all the patient details.
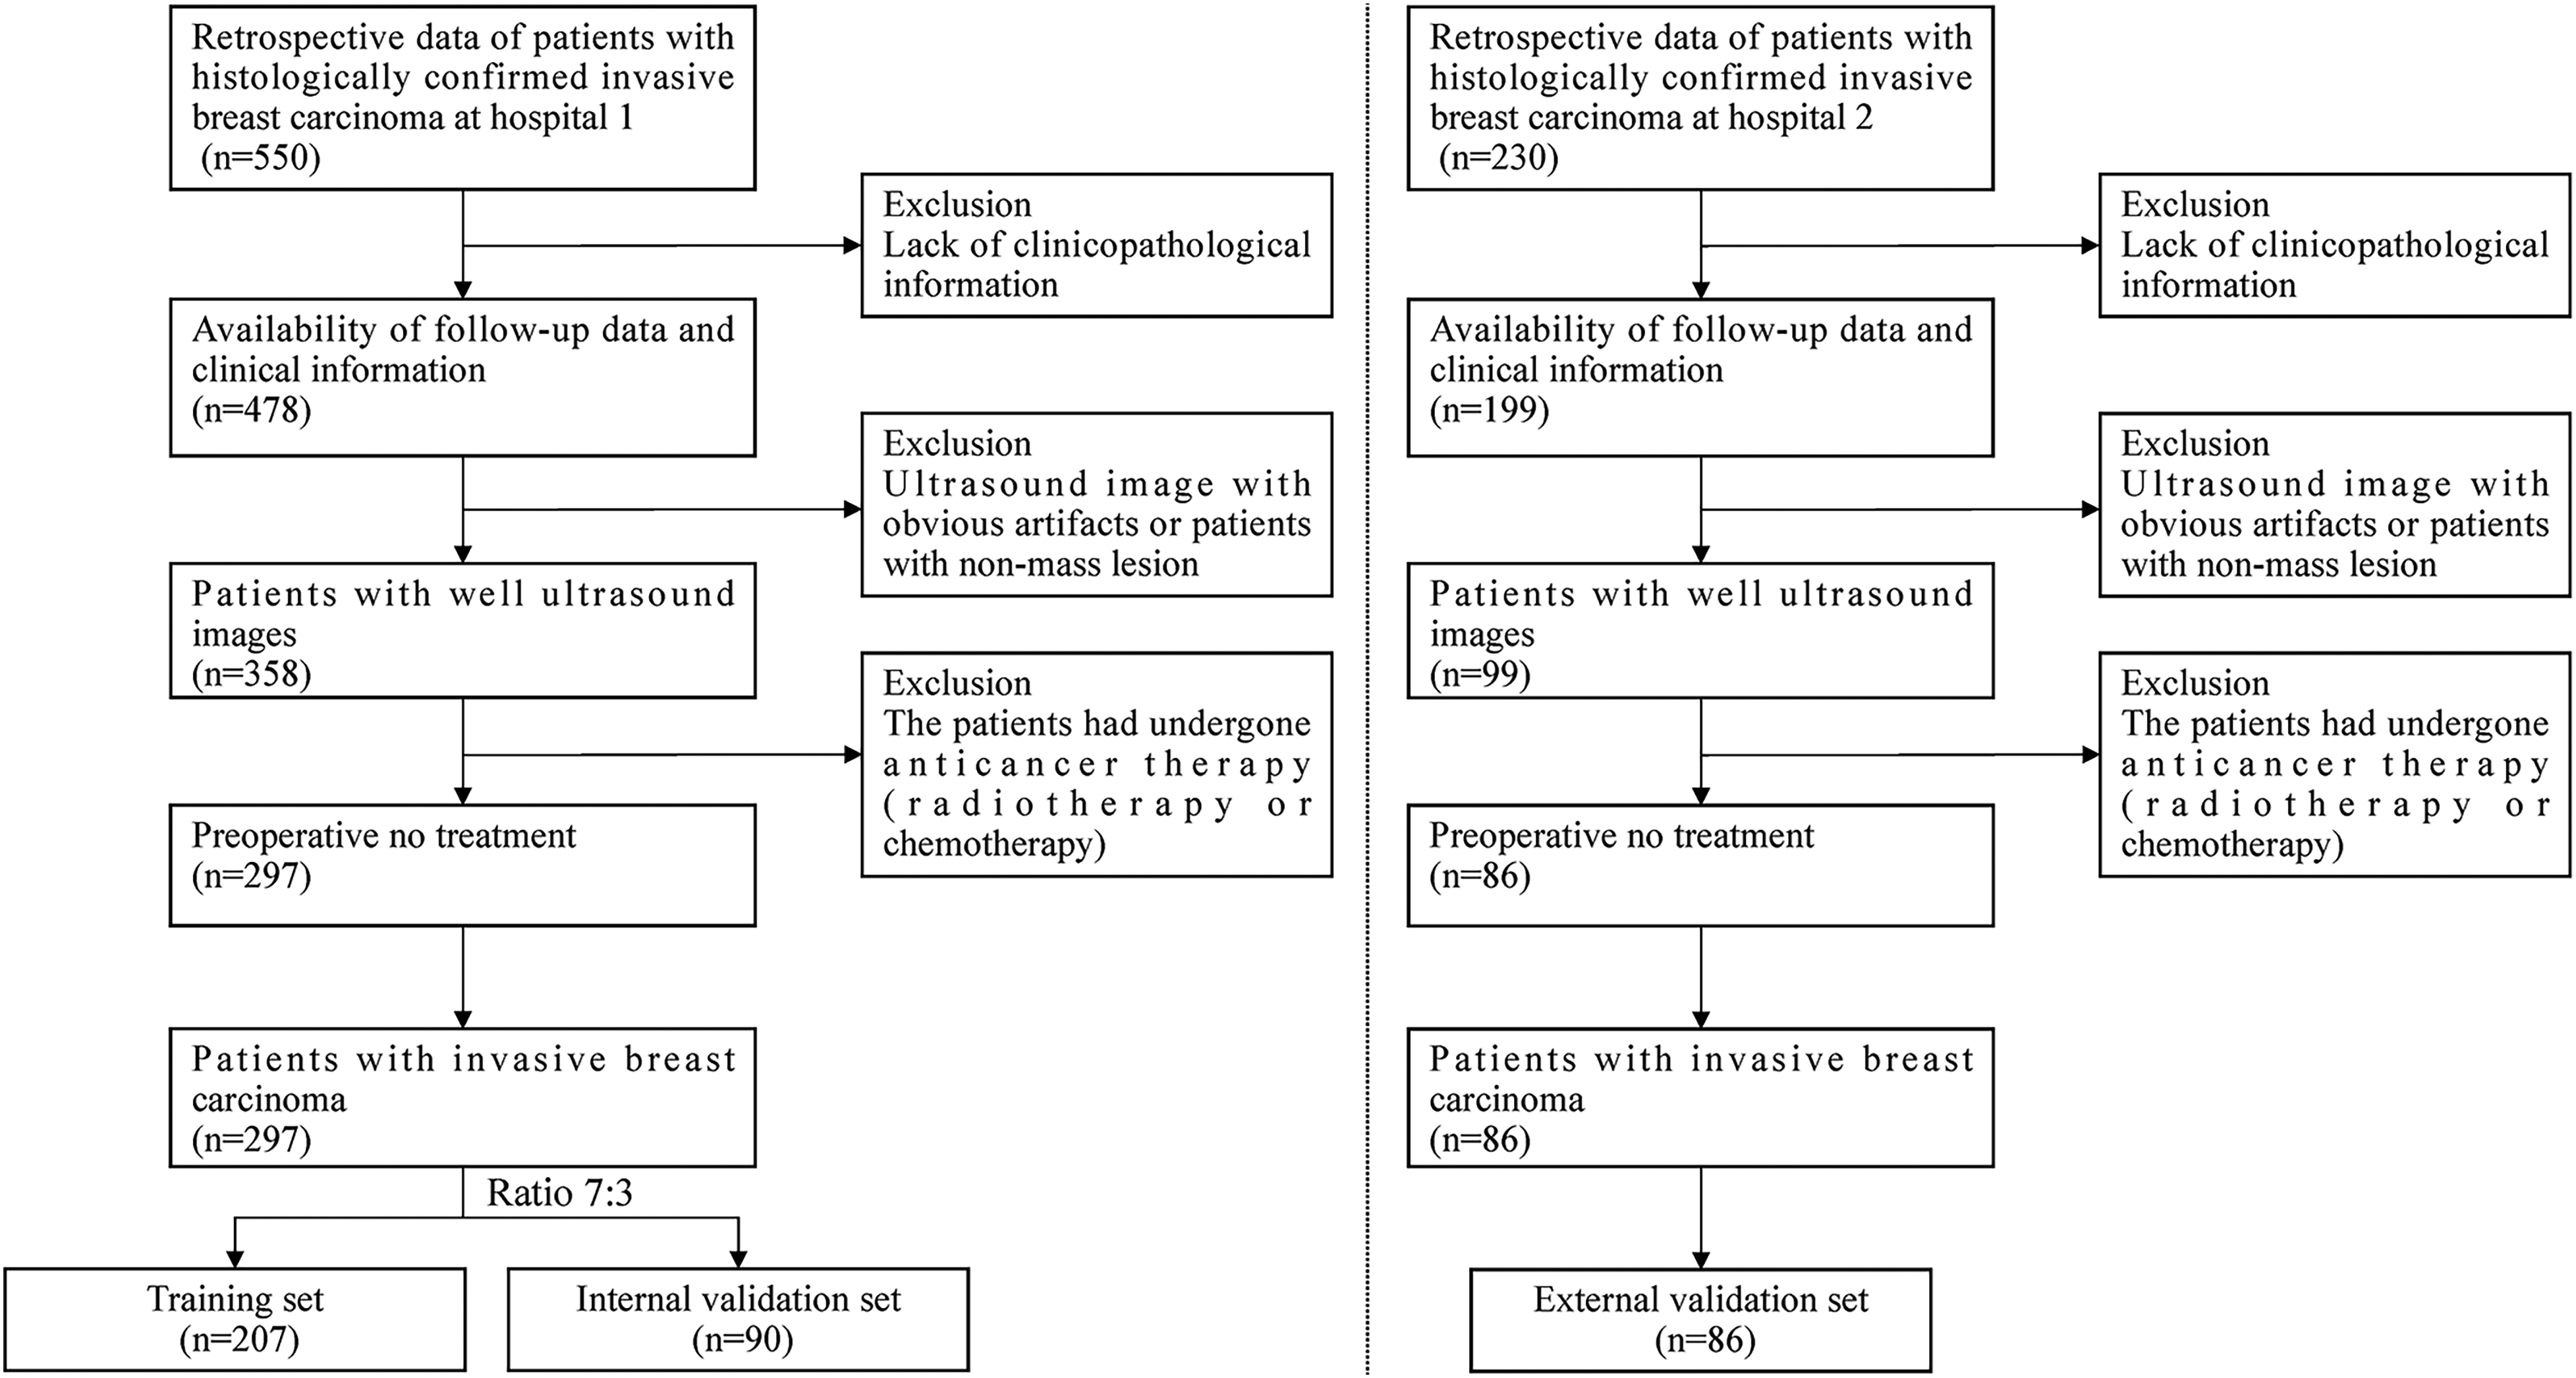
Flow chart of patients for enrollment. The left panel represents patient screening at Hospital 1, while the right panel pertains to patient screening at Hospital 2.
The inclusion criteria were: (1) patients who underwent biopsy or surgery of the breast lesion and were histopathologically confirmed with nonspecial types of invasive BC; (2) lesions presenting as mass on ultrasound images; (3) time interval between surgery and ultrasound examination less than 2 weeks; and (4) patients who received no previous chemotherapy or radiotherapy. The exclusion criteria included: (1) ultrasound images with obvious artifacts; (2) the target tumor was not completely visible in the ultrasound image; (3) patients with lack of pathological biomarkers or incomplete history information in clinical medical records; and (4) patients with BC with multiple malignant lesions.
The training set contained high (n = 60) and low histological grades (n = 147). The internal validation set contained high (n = 27) and low histological grades (n = 63). The external validation set contained high (n = 22) and low histological grades (n = 64).
The patients’ demographic characteristics such as tumor size, age, tumor site, axillary lymph node status (metastasis or no metastasis), Ki-67 index, HER2 status (positive or negative), estrogen receptor (ER) status (positive or negative), progesterone receptor (PR) status (positive or negative), Breast Imaging-Reporting and Data System (BI-RADS), and histological grade (I, II or III) were collected.
Postoperative Pathological Assessment
Pathological results were confirmed by US-guided biopsy or surgery. The cutoff point for ER-positive, PR-positive expression was 1%. 23 The critical threshold of Ki-67 to 14% was set, and over 14% was considered high expression. 24 In cases of equivocal HER2 overexpression, an amplification ratio of 2 or higher on fluorescence in situ hybridization test was considered to indicate HER2 positivity; otherwise, they were deemed to be negative. 25 The scoring criteria for histological grade of invasive BC were based on the following criteria:2,26 (1) in regard to the formation of glandular ducts, most obvious glandular ducts were defined as 1 point, moderately differentiated glandular ducts were considered as 2 point, and the tumor cells growing in solid patches or strips were determined as 3 point; (2) regarding the size, shape, and chromatin of the nucleus, the size, shape, and chromatin of the nucleus were identical (1 point), the nucleus was moderately irregular (2 points), and the nucleus showed obvious polymorphism (3 points); and (3) for chromatin and mitotic phase, 1/10 HPF considered as 1 point, 2 to 3/10 HPF considered as 2 points, and > 3/10 HPF considered as 3 points. We graded each score as follows: 3 to 5 scores were graded I, 6 to 7 scores were graded II, and 8 to 9 scores were graded III.
Ultrasound Acquisition and Image Segmentation
Different types of ultrasound diagnostic equipment (LOGIQ E9, Siemens Acuson S2000, Toshiba Aplio 500 and Philips EPIQ 5) were used at the above 2 hospitals, employing a high-frequency linear probe with radial, transverse, and longitudinal scans on both breasts. Ultrasound images were exported with the format of digital imaging and communication in medicine from the picture archiving and communication system database.
In this study, sonographer 1 was responsible for collecting the ultrasound image information of the patients. Preprocessing was carried out using resampling technique, resampling all of the ultrasound images so that they were 1 mm × 1 mm × 1 mm to obviate the disturbances due to the nonuniform spatial resolution. Next, ITK-SNAP software (open source software; http://www.itk-snap.org) was employed to manually outline region of interest that covered the largest cross-sectional area of each breast lesion in the transverse plane. This was carried out independently by sonographer 2 (sonographer 1 from Hospital 2, with more than 5 years’ experience in ultrasonic diagnosis) not knowing a patient's histopathological grade result.
Radiomics Feature Extraction and Selection
The “pyradiomics” package (version 3.0.1) of Python (version 3.7.11) was utilized to extract ultrasound radiomics features. A total of 788 features of 4 types were extracted from ultrasound image from each eligible case: (1) 18 first-order features, (2) 14 shape-based features, (3) 14 gray-level dependence matrix features, (4) 16 gray-level run length matrix features, (5) 16 gray-level size zone matrix features, (6) 22 gray-level co-occurrence matrix features, and (7) 688 features using wavelet filter images.
In order to assess the inter- and intra-observer consistency of radiomics feature exaction, the ultrasound images from 50 patients were randomly selected. Two experienced sonographers (sonographer 2 and sonographer 3 from Hospital 2, with more than 5 years’ experience in ultrasonic diagnosis) finished the procedure independently according to the same references. Although the 2 sonographers knew that all the patients were invasive BC, they were without knowing the diagnosis of tumor histological grade. Moreover, sonographer 2 repeated the process according to the same procedure after 2 weeks. The intraclass correlation coefficient (ICC) was adopted to evaluate the inter- and intra-observer stability of the obtained radiomics features, and features with ICCs > 0.75 were selected for the following analysis.
For the extracted radiomics features, a z-score normalization was used to standardize the radiomics feature data in the 3 sets, respectively. Features with ICCs more than 0.75 were considered to be consistent and retained for further analysis. In the training set, 2 feature selection methods, Mann-Whitney U test and the Boruta method were adopted in order to screen out the principal radiomics features that could be the most relevant for histological grade of invasive BC. The Mann-Whitney U test was applied for comparisons between the features of subjects with high histological grade and subjects with low histological grade. P values lower than .05 were considered significant. By comparing the importance of original attributes with randomly achievable importance, a top-down search is performed using the Boruta method, which is recommended for high-dimensional data analysis.27,28 In this step, the features that are important to the classification process is selected. Finally, the algorithm outputs a minimum and optimal subset of features.
Model Construction and Validation
In the training set, 7 representative machine learning classifiers including naive Bayesian, support vector machine, k-nearest neighbor, decision tree, extreme gradient boosting (XGBoost), logistic regression, and random forest were adopted to developed prediction models for histological grade of BC. The output of the machine learning classifier with the superior predictive power was labeled as the radiomics score (Rad-score) and the model was selected as the Rad-score model. Univariable regression analysis in the training set was performed to determine the independent predictive factors for the histological grade of invasive BC. The combined model was developed through integrating the independent predictive factors into Rad-score model by multivariate logistic regression. Moreover, a nomogram was plotted for the combined model.
Sensitivity, specificity, accuracy, positive predictive value, and negative predictive value were used to assess the power of the prediction models in the training, internal, and external validation sets. We plotted calibration curve in order to evaluate the calibration of the radiomics and the combined models, which illustrated the relationship between the observed and predicted results. Meanwhile, to explore the clinical utility of the 2 models, decision curve analysis was carried out. An analysis of receiver operating characteristic curves (ROC) was presented, and area under the curve (AUC) measured the predictive power of a classifier was reported. The flowchart of this research is shown in Figure 2.
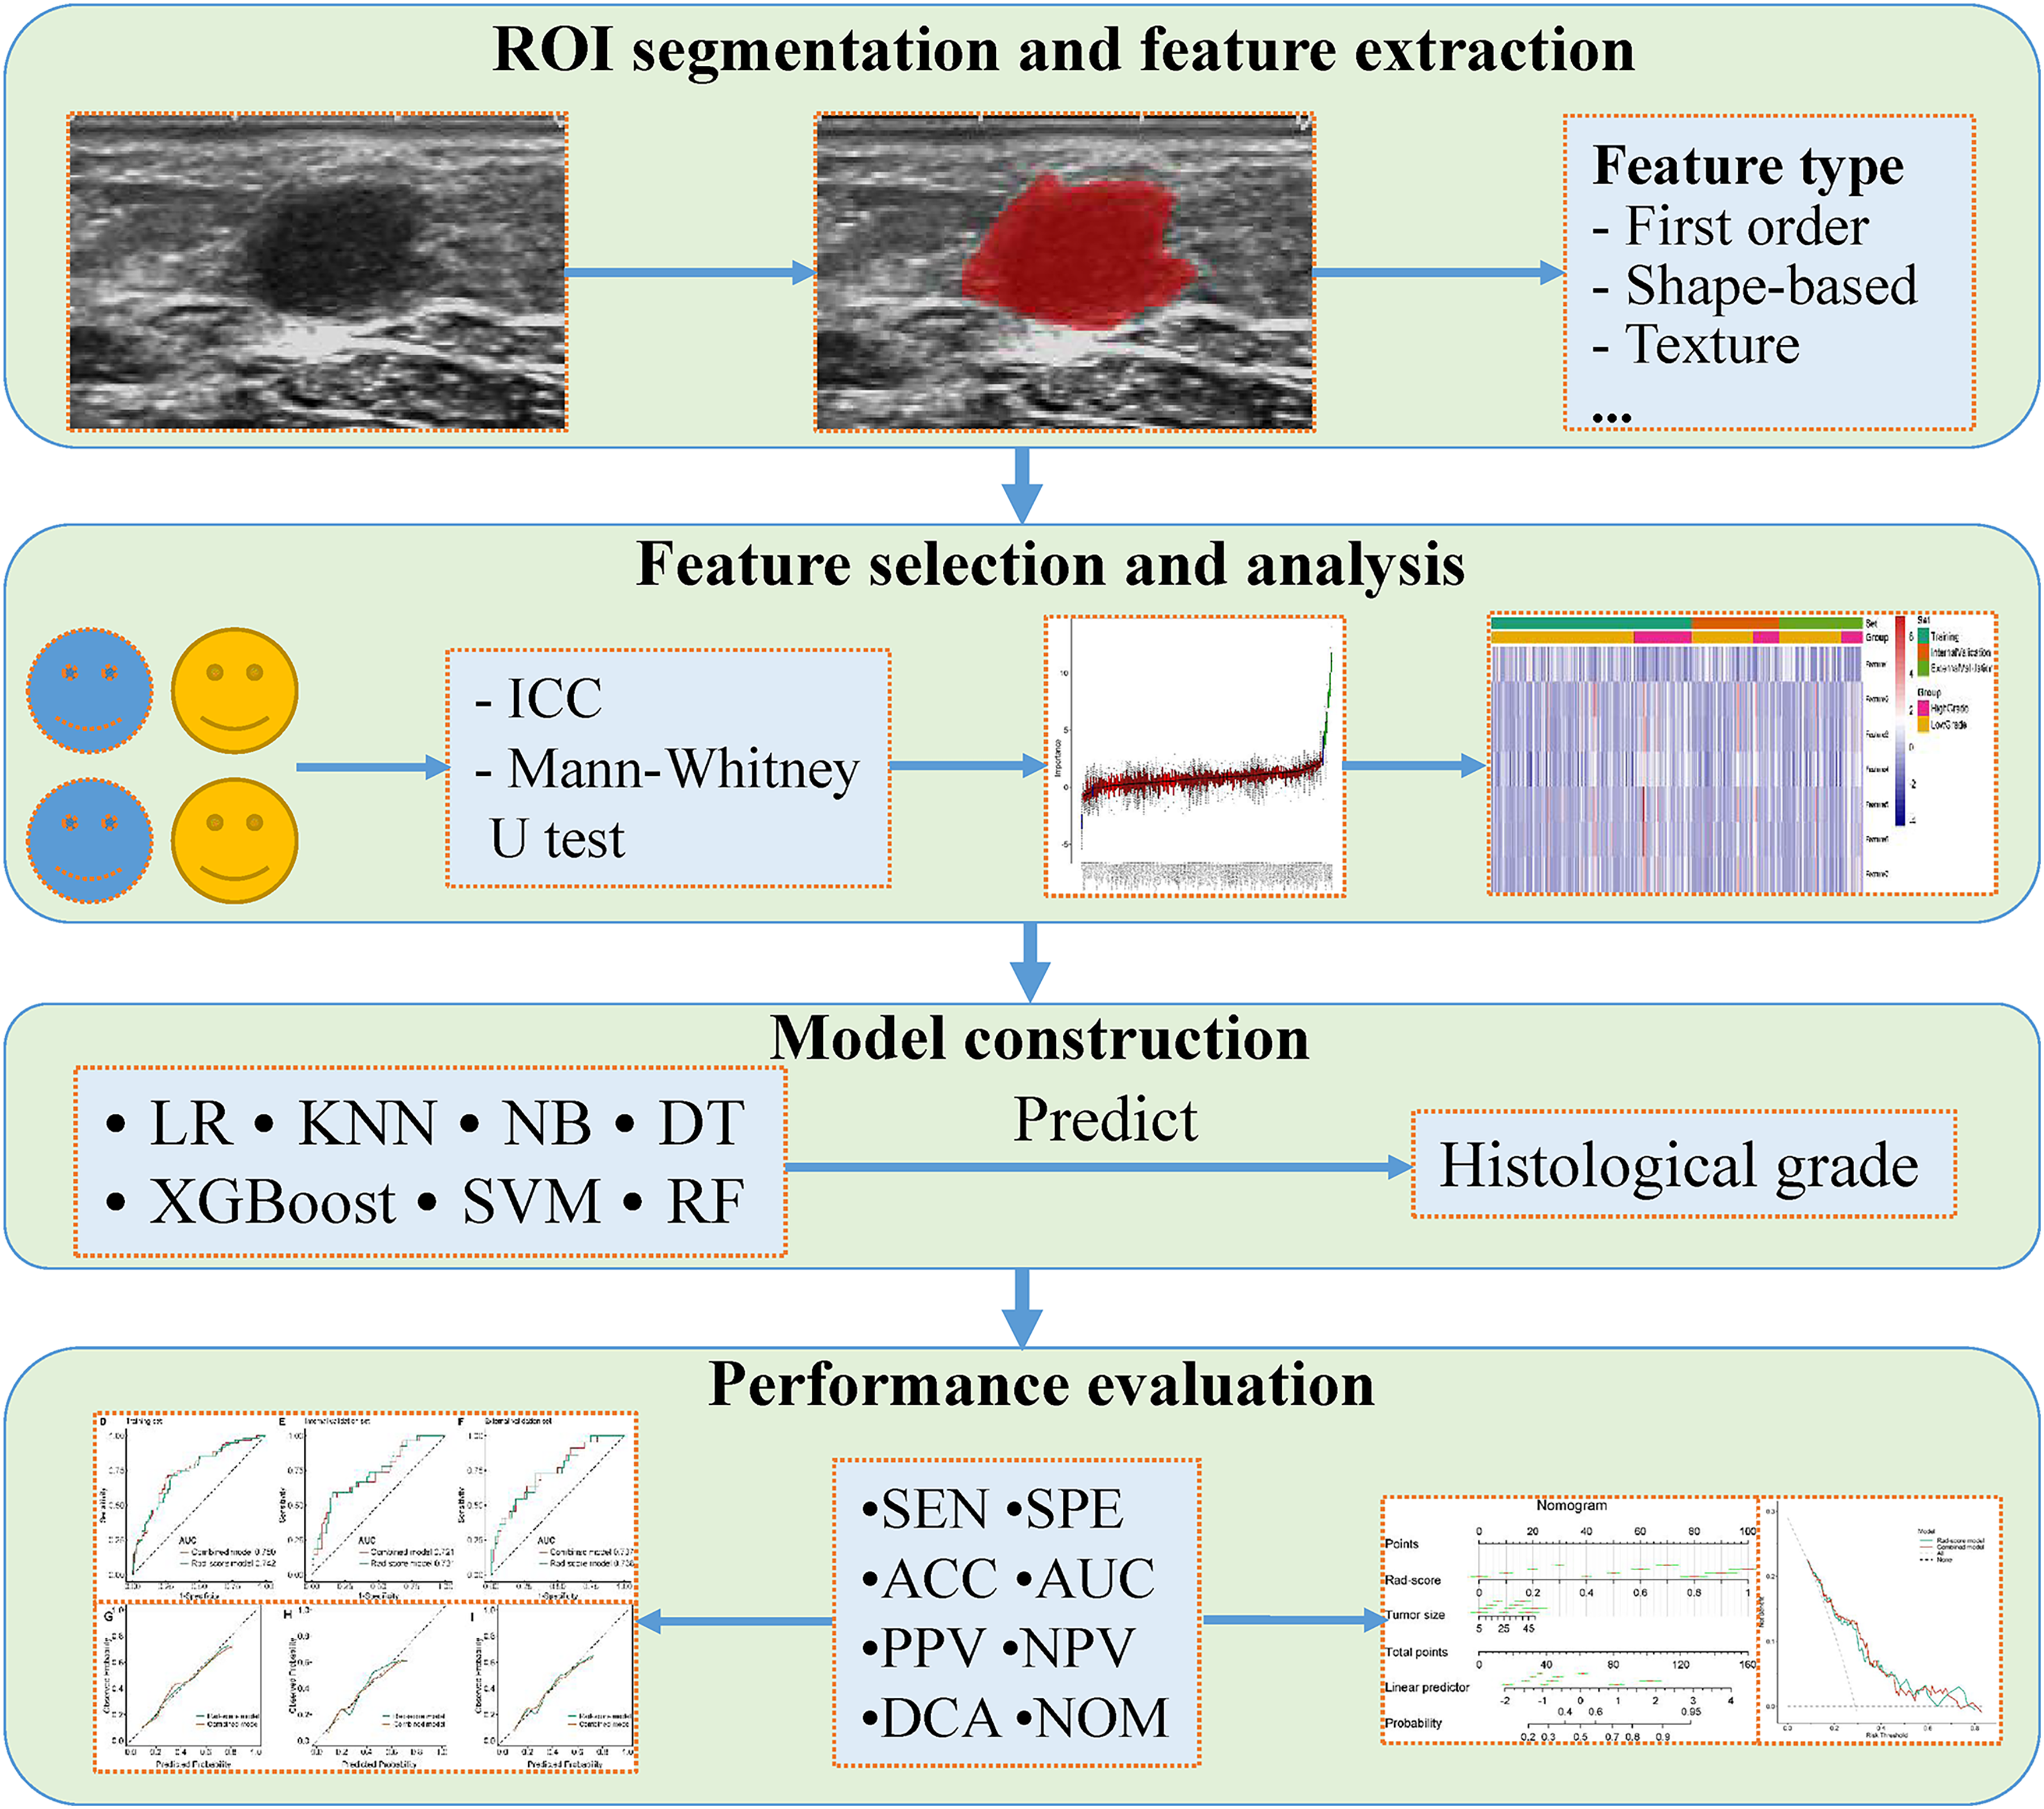
Schematic diagram of the processing and analysis flowchart. Abbreviations: ACC, accuracy; AUC, area under the curve; DCA, decision curve analysis; DT, decision tree; ICC, intraclass correlation coefficient; KNN, k-nearest neighbors; LR, logistic regression; NB, naive Bayesian; NOM, nomogram; NPV, negative predictive value; PPV, positive predictive value; RF, random forest; ROI, region of interest; SEN, sensitivity; SPE, specificity; SVM, support vector machine; XGBoost, extreme gradient boosting.
Statistical Analysis
R software (version 3.5.1; www.r-project.org) was used to perform the statistical analysis and data processing. P value < .05 (2-sided) was considered to be statistically significant. Continuous variables with normal distribution are expressed as mean ± standard deviation, while continuous variables with non-normal distribution are expressed as median (interquartile range). The Student's t test was applied to compare clinical-pathological characteristics with a normal distribution, while Mann-Whitney U test was used to characteristics with an abnormal. Categorical variables such as histological grade and histological types were represented as N and were compared using chi-square test or Fisher's exact test.
Results
Clinical-Pathological Characteristics
The baseline clinical-pathological characteristics of patients with BC in the training, internal, and external validation sets are presented in Table 1. A total of 297 of 383 patients with invasive BC were included in the training and internal validation sets, and 86 patients were enrolled in the external validation set. A total of 147 patients with BC were low-grade invasive BC, accounting for 71.0% in the training set. Overall, compared with high-grade group, patients in low-grade group had the following significant clinical-pathological characteristics: smaller tumor size, lower Ki-67 index, and higher proportion of ER + and PR + tumors (all the P value < .05). There were significant differences in statistics between high- and low-grade groups in tumor location, Ki-67 index and proportion of ER + and PR + tumors in the internal validation set. Patients in low-grade group had lower Ki-67 index and smaller tumor size in the external validation set.
The Baseline Characteristics of the Enrolled Patients in the Training Set, Internal Validation Set and External Validation Set.
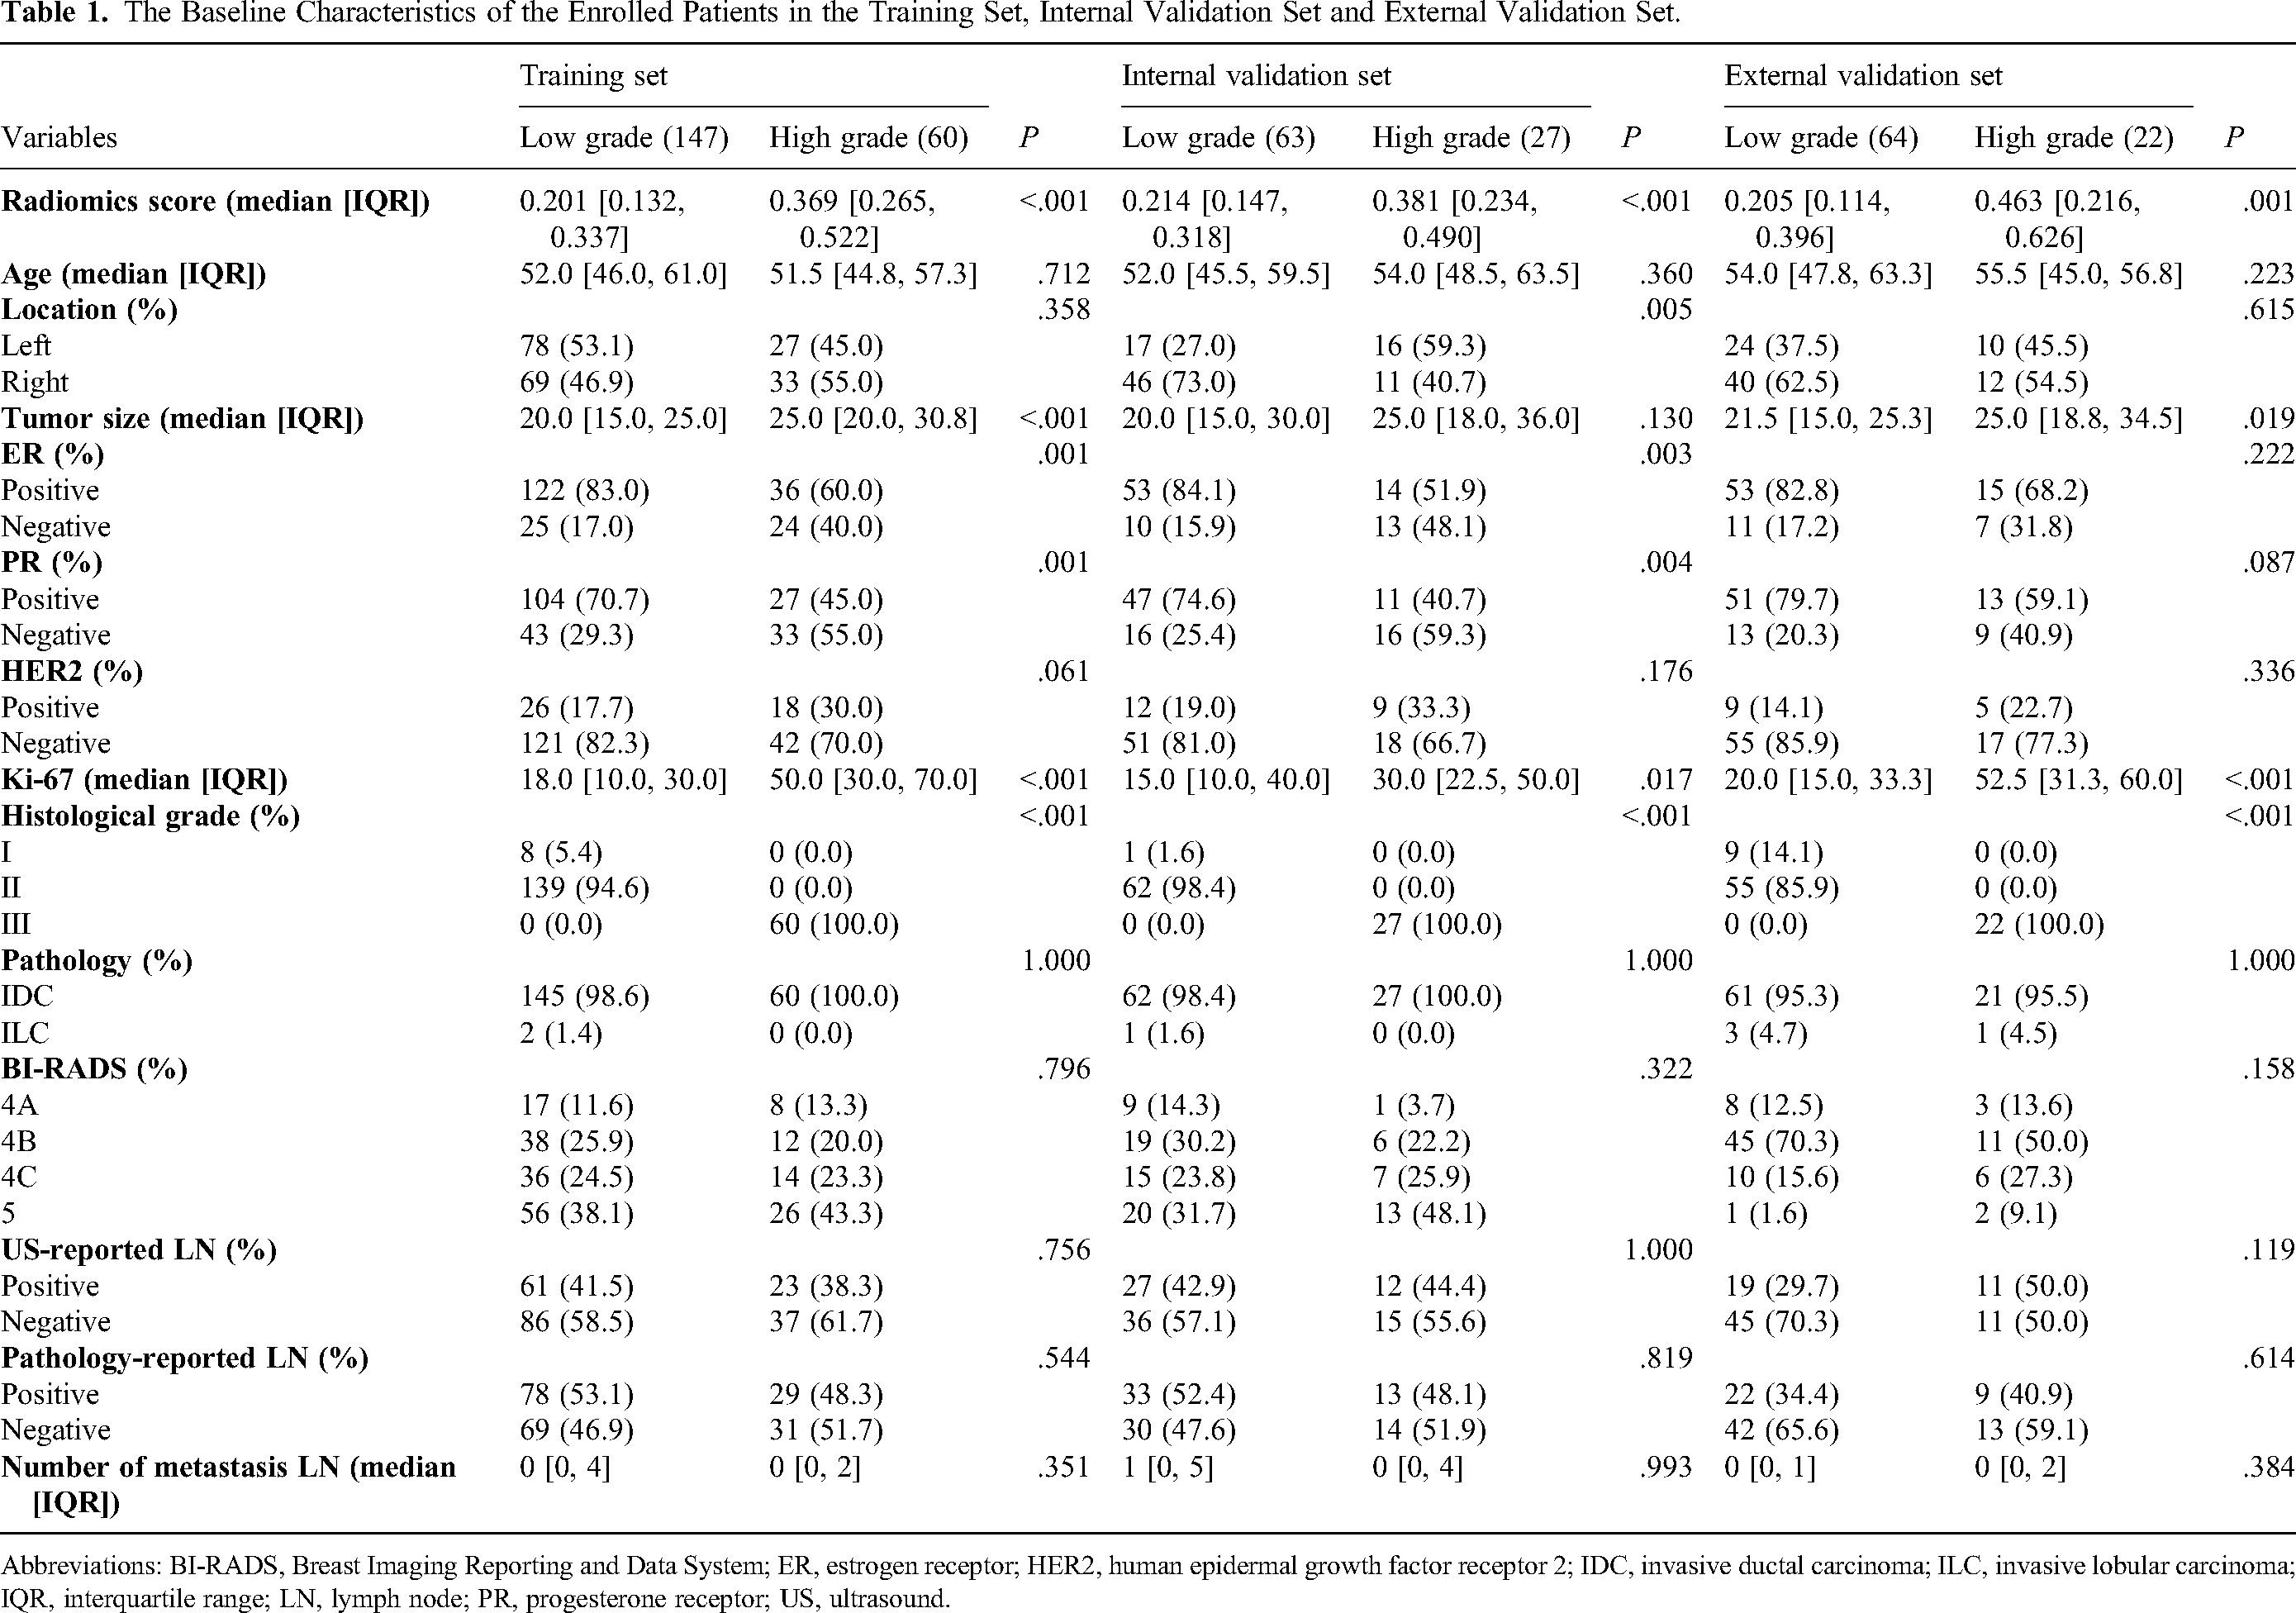
Abbreviations: BI-RADS, Breast Imaging Reporting and Data System; ER, estrogen receptor; HER2, human epidermal growth factor receptor 2; IDC, invasive ductal carcinoma; ILC, invasive lobular carcinoma; IQR, interquartile range; LN, lymph node; PR, progesterone receptor; US, ultrasound.
Radiomics Feature Extraction and Selection
A total of 788 radiomics features were extracted from each patient. Then, 765 robust features with ICCs > 0.75 were obtained and used for dimension reduction, which were consistent with our prior study. 17 In the training set, the Mann-Whitney U test on the 765 robust features was performed, and 206 features with P < .05 were retained. Finally, 7 radiomics features were finally screened out by utilizing Boruta method shown in Figure 3.

Feature selection using the Boruta algorithm. The x-axis represents ultrasound radiomics features by name, while the y-axis indicates their importance scores evaluated by the Boruta algorithm, aiding in understanding their significance within the dataset.
Independent Clinical Factor
Univariable regression analysis of the association between the clinical factors and the histological grade of invasive BC in the training set only detected tumor size that had statistical difference, with an odds ratio (OR) of 1.06 (95% confidence interval [CI], 1.03-1.09; P < .001) (Table 2). Multivariable regression analysis was waived as only one significant clinical factor was detected in univariable regression analysis.
Univariable Logistic Regression Analysis in the Training Set.

Abbreviations: BI-RADS, Breast Imaging Reporting and Data System; CI, confidence interval; OR, odds ratio; Ref., reference.
Machine Learning Classifiers and Radiomics Score Calculation
Seven machine learning classifiers were trained on the basis of the selected features in the training set and tested in the internal and external validation sets. The performance of the 7 machine learning models is summarized in Table 3. The results unveiled that the models could differentiate patients with BC with high histological grade from those with low histological grade. Moreover, the comparison of AUCs between any pair of the models in the 3 sets was performed respectively, and the DeLong test was used to calculate the P values (Figure 4).

The statistical comparison of area under the curve values using the DeLong test among 7 machine learning classifiers in the training set, internal validation set, and external validation set. Abbreviations: DT, decision tree; KNN, k-nearest neighbors; LR, logistic regression; NB, naive Bayesian; RF, random forest; SVM, support vector machine; XGB, extreme gradient boosting.
Diagnostic Performance of the 7 Machine Learning Classifiers in the Training Set, Internal Validation Set, and External Validation Set.
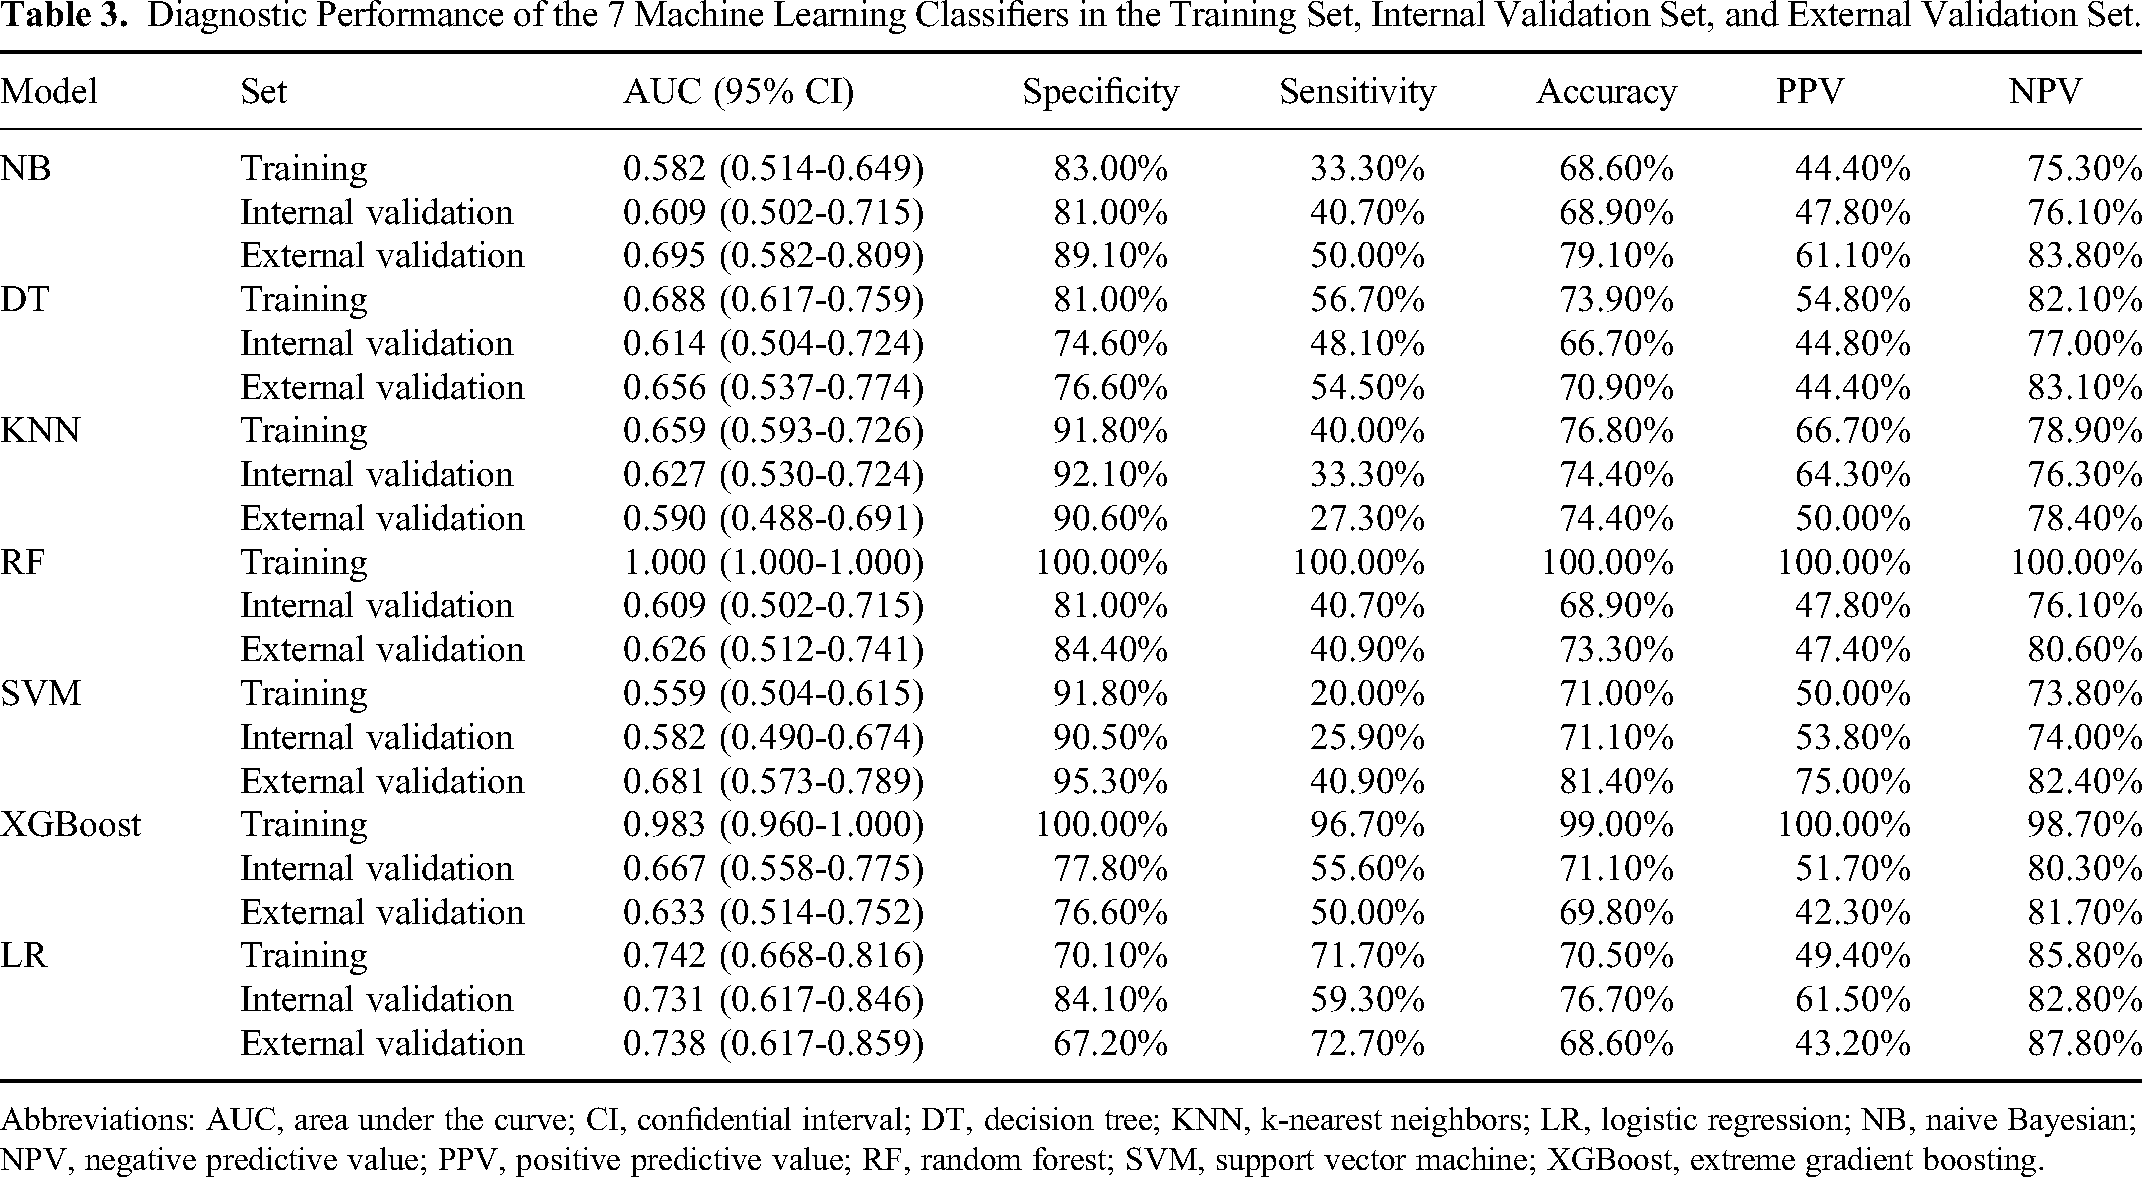
Abbreviations: AUC, area under the curve; CI, confidential interval; DT, decision tree; KNN, k-nearest neighbors; LR, logistic regression; NB, naive Bayesian; NPV, negative predictive value; PPV, positive predictive value; RF, random forest; SVM, support vector machine; XGBoost, extreme gradient boosting.
The logistic regression classifier performing best in the internal and external validation sets was determined as the Rad-score model. Figure 5 shows the regression coefficients of the logistic regression algorithm. By adopting the regression coefficients of the Rad-score model to weight each radiomics feature, the probability of high histological grade of BC based on the selected 7 radiomics features was quantitatively predicted and considered as Rad-score.

Feature coefficients in predicting high histological grade of invasive breast cancer according to the Rad-score model.
The medians of Rad-score had statistical difference between the low- and high-grade groups in the training set, and the same results were achieved in the internal and external validation sets (Table 4 and Figure 6A-C).

Raincloud plots, receiver operating characteristic curves, and calibration curves in the training set (A, D, G), internal validation set (B, E, H), and external validation set (C, F, I).
Rad-Scores for the Training Set, Internal Validation Set, and External Validation Set.
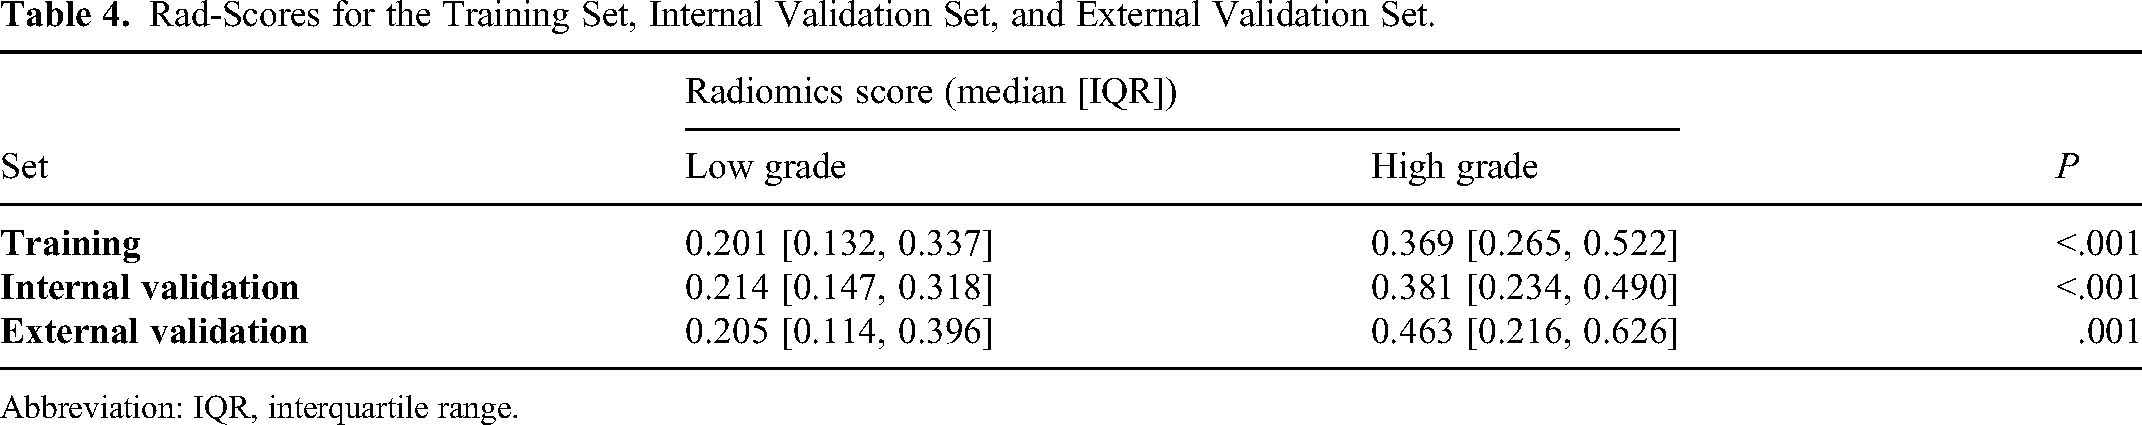
Abbreviation: IQR, interquartile range.
Establishment of Combined Model and Comparison of Models
The combined model was developed by integrating the tumor size into the Rad-score model and the performance of the Rad-score and combined models for predicting high histological grade was revealed (Table 5 and Figure 6D-F). The combined model achieved satisfactory discrimination, with AUCs of 0.750 (95% CI: 0.677-0.824), 0.721 (95% CI: 0.604-0.838), and 0.737 (95% CI: 0.616-0.857) in the training, internal, and external validation sets, respectively. The combined model yielded higher AUC for high histological grade in the training set; meanwhile, the Rad-score model had the slightly higher predictive ability in the internal and external validation sets. There was no significant difference in the ROC curves of the 2 models in the training, internal, and external validation sets (DeLong test, P = .307, P = .381, P = .987).
Diagnostic Performance of the Rad-Score Model and Combined Model in the Training Set, Internal Validation Set, and External Validation Set.

Abbreviations: AUC, area under the curve; CI, confidential interval; NPV, negative predictive value; PPV, positive predictive value.
The 10-fold cross-validation was conducted to test the stability and reliability of the Rad-score model and combined model in the training set, which yielded mean AUCs of 0.728 and 0.745, demonstrated the predictive power of the 2 models was reliable and stable.
Clinical Application of Prediction Models
The calibration curve for the Rad-score model and the combined model was tested by utilizing the Hosmer-Lemeshow method, and had no significantly statistical differences as all the P values > .05 in the training set (P = .789; P = .513), internal validation set (P = .405; P = .430) and external validation set (P = .378; P = .868), revealing well consistency between the observed and predicted results (Figure 6G-I). Moreover, we used the tumor size and Rad-score to build a nomogram based on training set to discriminate the high grade from low grade of invasive BC (Figure 7). In the nomogram plot, each variable value of the patients is positioned along its corresponding axis, with a straight line drawn upwards to determine the point corresponding to the Rad-score and tumor size. These points are then summed to derive the total point, which is then projected downwards onto the probability axis, indicating the probability of a patient being diagnosed with high histological grade invasive BC. Using this nomogram, we obtained a median probability of predicting high histological invasive BC of 0.2226, with a maximum of 0.9128 and a minimum of 0.0725, on the external validation set. Additionally, a box plot (Figure 8) has been included to illustrate the predicted probabilities for each patient in the external validation set. In addition, decision curve analyses of the combined model and Rad-score model are revealed in Figure 9.

Nomogram for predicting high histological grade of invasive breast cancer. Clinicians can add up corresponding scores using the plot and obtain the high histological grade probability. The red bar represents the range where the variable's value falls, while the green bar delineates the 95% confidence interval of these values.

The probability distribution of high and low histological grade invasive breast cancers in the external validation set.

Decision curve analysis for the Rad-score model and combined model.
Discussion
In the current study, we developed a new method for predicting the histological grade of invasive BC. We used ultrasound radiomics and machine learning classifiers to develop accurate prediction models for histological grade. We analyzed 788 quantitative ultrasound features to determine their value in predicting the histological grade of invasive BC by high-throughput radiomics analysis. As a result of using the Boruta method, we were able to screen out 7 radiomics features as imaging markers to develop machine learning prediction models. Seven advanced machine learning classifiers were used to establish 7 models for predicting the histological grade, which were all assessed and validated. The logistic regression classifier performing best was determined as the Rad-score model, with AUC values of 0.742, 0.731, and 0.738 in the training, internal, and external validation sets, respectively. In addition, combined with the clinical-pathological information, the data regarding size of tumor, BI-RADS, site of tumor, age, and axillary lymph node metastasis was collected and analyzed by univariate logistic regression analysis. Finally, tumor size was identified as an independent factor, combining with the Rad-score to develop the combined model, and the AUC values in the training, internal, and external validation sets were 0.750, 0.721, and 0.737, respectively. However, there was no statistical difference between the Rad-score and combined model. Our findings demonstrated that both the Rad-score model and combined model could accurately predict the histological grade in patients with invasive BC. To our knowledge, it is the first study to incorporate ultrasound radiomics features with clinical factor (tumor size) in the prediction of histological grade of invasive BC.
The histological tumor grades were found to be associated with lymph node invasion and different subtype of hormone receptor according to Zodinpuii et al. 29 Similarly, Zheng et al 30 found that a high histological grade of invasive BC was more likely to be present in patients with positive axillary lymph nodes, large tumor size (more than 2 cm), HER2 positivity, lymphovascular invasion, and Basal-like BC. However, only the clinical factor of tumor size showed significant difference between the low- and high-grade BC in this investigation. Furthermore, the ER, PR, and Ki-67 of pathological information had statistical difference between the low- and high-grade groups shown in Table 1. The ER, PR, and Ki-67 here were referred to the postoperative pathological information, but it was difficult for us to get them prior to surgery since this is a prediction study. Therefore, predicting histological grade of invasive BC adopting radiomics features and clinical factors might be more successful and effective.
In recent years, radiomics, first proposed by Lambin et al in 2012, 9 has developed rapidly. It can be used to diagnose and predict diseases noninvasively and is universally considered as a breakthrough in the field of radiomics for personalized cancer management.17‐20 In Mao et al's study, 25 a radiomics model on the basis of contrast-enhanced spectral mammography was developed and validated in order to pre-operatively discriminate the low- from high-grade invasive BC. The combined radiomics model on the basis of 28 radiomics characteristics demonstrated the most superior power for pre-operatively predicting histological grade in patients with invasive BC, acquiring AUCs of 0.88 and 0.80 in the training and test sets. It is important to note that despite the positive findings, the study above had a few shortages. First, as a result of the limited radiomic features and small sample size, it is unlikely that the conclusion could be generalized. Second, there were no clinical-pathological characteristics referred, which have been demonstrated to be relative to the histological grade. Third, multicenter research is necessary to improve high-level evidence for clinical use in this study, which is a single-center study. A study by Wang et al 31 evaluated 901 patients with invasive BC and pre-operative magnetic resonance imaging (MRI) scans. Based on the radiomics model, the AUC values for histological grade prediction were 0.761 in the training set and 0.722 in the validation set which suggested that radiomics model based on MRI was capable of predicting the histological grade of invasive BC. However, this study was a single-center study and the model was not tested by the external validation cohort, which might make the model unrepresentable. In the Fan et al's study, 32 167 patients with invasive ductal carcinoma were assembled, and radiomics features from the dynamic contrast-enhanced MRI and images with T2 weights were fused using a canonical correlation analysis. The highest AUC value for predicting the histological grade in the validation cohort was 0.803. Despite some significant findings, there was a smaller sample size in the dataset than in ours and the robustness of predictive models needs to be further validated in future studies using a large external dataset.
After feature screening, these 7 features played an important role in correctly classifying the 2 groups, which included shape feature, texture feature, and wavelet features. In addition, according to the findings, texture and wavelet features were the most significant, particularly the wavelet features, which accounted for the majority of high-weight features. It is possible to quantify intratumoral heterogeneity at different scales with the wavelet transformation, which is often invisible to the naked eye. 33 Furthermore, texture features have the advantage of retaining the spatial features of the lesions and can quantify the subtle differences in image pixel values and their arrangement. 34 A significant amount of radiodiagnostic experience is required for a separate imaging diagnosis and there are large subjective differences between observers. In contrast, radiomics quantifies all image features and develops an objective model to make the classification results more objective. Thus, radiomics may be an auxiliary tool for doctors in identifying these 2 histological grades, and may aid doctors in making quick differential diagnoses.
There remained a few limitations in this study. First, this study had a small sample size, which needs to be increased. By doing so, machine learning classifiers will be less susceptible to data bias; on the other hand, it may enhance the learning ability of the machine learning model by providing more training data. Second, it is not clear whether other planes of the tumor such as transverse cross-sectional plane, or peritumoral regions could also be applied for differential diagnosis. 35 There is still a need for further research in this area. Third, a radiomics analysis was performed only on images of the largest tumor diameter in 2 dimensions. Whereas, as compared to a model based on features of the whole tumor volume, radiomics analysis of single slices may miss some important information. 36 A 3-dimensional model should be developed in future studies for prediction of the histological grade in patients with BC.
Conclusions
In summary, we developed and validated the Rad-score model and the combined model to effectively distinguish different histological grade of invasive BC. Thus, the models may provide an effective diagnostic reference for histological grade identification in routine clinical use.
Footnotes
Abbreviations
Author Contributions
LG and YJ examined the experiment and wrote this article. JW provided help with the data analysis. ZW and DX revised this article. DX provided the research platform.
Declaration of Conflicting Interests
The authors declared no potential conflicts of interest with respect to the research, authorship, and/or publication of this article.
Ethics Approval
The research involving human participants underwent comprehensive examination and obtained the official approval of the Institutional Review Board at Dongyang People's Hospital (Approval No. 2024-YX-111) and Zhejiang Cancer Hospital (Approval No. IRB-2022-548). The informed consent was waived because of the retrospective nature of this study.
Funding
The authors disclosed receipt of the following financial support for the research, authorship, and/or publication of this article: This study was funded by Research Program of National Health Commission Capacity Building and Continuing Education Center (CSJRZC2021JJSJ001).