
Abstract
Introduction
Since the response of patients with rectal cancer (RC) to neoadjuvant therapy is highly variable, there is an urgent need to develop accurate methods to predict the post-treatment T (pT) stage. The purpose of this study was to evaluate the utility of multi-parametric MRI radiomics models and identify the most accurate machine learning (ML) algorithms for predicting pT stage of RC.
Method
This retrospective study analyzed pretreatment clinical features of 171 RC patients who underwent 3 T MRI prior to neoadjuvant therapy and subsequent total mesorectal excision. Tumors were manually drawn as regions of interest (ROI) layer by layer on high-resolution T2-weighted image (T2WI) and contrast-enhanced T1-weighted image (CE-T1WI) using ITK-SNAP software. The most relevant features of pT stage from CE-T1WI, T2WI, and fusion features (combination of clinical features, CE-T1WI, and T2WI radiomics features) were extracted by the Least Absolute Shrinkage and Selection Operator method. Clinical, CE-T1WI radiomics, T2WI radiomics, and fusion models were established by ML multiple classifiers.
Results
In the clinical model, the LightGBM algorithm demonstrated the highest efficiency, with AUC values of 0.857 and 0.702 for the training and test cohorts, respectively. For the T2WI and CE-T1WI models, the SVM algorithm was the most efficient; AUC = 0.969 and 0.868 in the training cohort, and 0.839 and 0.760 in the test cohort, respectively. The fusion model yielded the highest predictive performance using the LR algorithm; AUC = 0.967 and 0.932 in the training and test cohorts, respectively.
Conclusion
Radiomics features extracted from CE-T1WI and T2WI images and clinical features were effective predictors of pT stage in patients with rectal cancer who underwent neoadjuvant therapy. ML-based multi-parameter MRI radiomics model incorporating relevant clinical features can improve the pT stage prediction accuracy of RC.
Introduction
Colorectal cancer (CRC) is the third most pernicious malignancy worldwide, with an estimated 30%–50% of cases originating in the rectum. 1 Neoadjuvant chemoradiotherapy (nCRT) followed by total mesorectal excision (TME) is the standard treatment for patients with local advanced rectum cancer (LARC). This treatment approach significantly enhances stage reduction and reduces recurrence risk.2,3 The response of patients with rectal cancer to neoadjuvant therapy is highly variable, ranging from pathological complete response (pCR) to minimal or no tumor regression (stable disease), and sometimes even tumor progression.3,4 In rectal cancer patients, a good response to neoadjuvant therapy is associated with favorable prognosis.5,6 Lengthening the interval between neoadjuvant therapy and surgery may increase the chances of achieving pCR and preserving organ function. 7 For patients who exhibit a poor response to neoadjuvant therapy, there is limited clinical benefit, and additional side effects may occur.8,9 The accurate prediction of response prior to initiating neoadjuvant therapy is critical for personalizing treatment plans, avoiding unnecessary treatment, and facilitating timely selection of alternative therapies. However, reliable methods for identifying good and poor response groups prior to completion of neoadjuvant therapy are not currently available, except for pathological evaluation after treatment completion. Therefore, there is an urgent need to develop accurate methods to predict the post-treatment (pT) T stage to guide clinical decision-making.
Magnetic resonance imaging (MRI) is widely acknowledged as the most valuable imaging modality for both local-regional primary staging and post-neoadjuvant therapy for rectal cancer.10,11 However, accurate postoperative staging of the T3 + stage is crucial because it is associated with a higher risk of local recurrence and distant metastasis. 12 Thus, the assessment of the efficacy of neoadjuvant therapy for rectal cancer patients has traditionally been divided into two groups: the T0-T2 group with lower stages and the T3-T4 group with higher stages. However, MRI staging based on visual features is prone to inconsistencies caused by variances in the clinical experience and observers’ personal perspectives. This is reflected in reports of a wide range of accuracies: 59% - 88%.13–15 This is primarily due to the challenges posed by differentiating between inflammation, fibrosis, and tumor invasion in the mesorectum surrounding the rectum after neoadjuvant therapy, leading to inaccuracies in T2 and T3 staging. 16
Recent advances in radiomics have demonstrated significant potential for therapeutic guidance and tumor prognosis in various cancers.17–19 As a subset of artificial intelligence, machine learning (ML) can automatically process large amounts of multidimensional and multifaceted data, offering notable advantages in disease prediction.20,21 Notably, recent research suggests that a multi-modal MRI-based radiomics model can better predict rectal cancer tumor responses to neoadjuvant therapy than single-modality imaging.22,23 However, the reliability of the prediction model requires improvement, due to several limitations, including relatively small samples, absence of integration of important relevant clinicopathological features, and lack of comparison of internal effectiveness (repeatability) across different machine learning models. Since effectiveness is a critical performance indicator, it is necessary to compare different models to establish reliable predictive models for assessing outcomes in patients with rectal cancer following neoadjuvant therapy.
Therefore, the fundamental aim of this study was to forge and substantiate a radiomic model comprising radiomic and clinical features, rooted in multi-parametric MRI, that can accurately predict responses of individuals with rectal cancer undergoing neoadjuvant therapy, further facilitating prudent clinical decision-making. Additionally, the precision of diverse machine learning algorithms was subjected to comparative analysis.
Materials and Methods
Patient Characteristics
This retrospective study was approved by the institutional review board of XX Hospital in compliance with ethical principles derived from the Declaration of Helsinki and its subsequent amendments (the ethical committee approval number: [2020]KYLL(S05)). This study included 171 consecutive patients treated between July 2014 and October 2021. The eligibility criteria for patient enrollment were as follows: (1) diagnosis of a single primary rectal cancer confirmed by pathological examination; (2) administration of standard neoadjuvant therapy in accordance with the protocol, with no previous anticancer treatment in other medical facilities; (3) pretreatment pelvic MRI completed within two weeks before neoadjuvant therapy; (4) underwent TME surgery after neoadjuvant therapy; and (5) complete clinical and pathological data at the time of diagnosis. The exclusion criteria were as follows: (1) concurrent malignancy in another location; (2) incomplete MR study providing insufficient information for accurate tumor staging or exhibiting imaging artifacts that could compromise radiomic analysis; and (3) history of pelvic radiotherapy. The standard neoadjuvant therapy was concurrent chemoradiotherapy: pelvic radiotherapy 45.0–50.4Gy/25–28 fractions, concurrent capecitabine chemotherapy 1600 mg/m2, bis in die, continuous for 2 weeks and stopped for 1 week. The patients were randomly divided into a training cohort (n = 137) and a test cohort (n = 34) in a ratio of 8:2.
Review of the electronic medical charts revealed several clinical risk factors, namely, age, sex, and the serum tumor markers carcinoembryonic antigen (CEA) and carbohydrate antigen 19–9 (CA19-9), which warrant further investigation. Further, rectal tumor reassessment was conducted by two experienced gastrointestinal radiologists, with 10 and 15 years of expertise, respectively. The reassessment process was performed based on baseline MRI scans without access to any medical record information and yielded consistent outcomes. The risk factors associated with baseline MR images include: (1) maximum diameter of the tumor (Diamax, the long diameter of the largest solid tumor on high resolution T2WI); (2) tumor length (TL, the distance from the inferior margin to the superior margin of the tumor); (3) maximum diameter perpendicular to the intestinal wall on T2WI (ThiT2); (4) maximum cross-sectional area of the tumor on T2WI (AeraT2); (5) distance of tumor from the anal verge (Dis); (6) short diameter of the largest lymph node (Lnmax); (7) extent of tumor involvement in the intestinal ring (Circle, 1, 2, 3, 4 respectively indicate the extent of enterospheric invasion); (8) tumor signal (homogeneous is defined as similar signals in more than 75% of tumors on the short axis); (9) tumor spiculation (spiculation, a cord of soft tissue along the edge of a tumor similar to the signal of the tumor); (10) cancerous node (an irregularly shaped tumor nodule in the peripheral mesangium that differs from a lymph node); (11) mural stratification; (12) the status of mesorectal fascia (MRF, positive indicates that the distance between the mesangial fascia around the rectum and any of the tumor itself, metastatic lymph nodes, cancer nodules, or vascular invasion lesions is less than 1 mm); (13) extramural vascular invasion (EMVI, positive findings indicate that either the tumor has infiltrated the rectal wall in a linear pattern or the adjacent vascular lumen exhibits a tumor-like medium signal with dilation and/or irregular vascular contour); (14) extra-mesenteric lymph node (extraMRF, lymph nodes metastasizing beyond the mesangial area around the rectum); (15) baseline clinical T and N stages, American Joint Committee on Cancer (AJCC) eighth edition.
Pathological Assessment
The resected specimens were assessed independently by two pathologists who were blinded to the patients’ clinical outcomes. The assessment followed the AJCC on Cancer TNM staging category (seventh edition), wherein the y prefix indicates the classification after neoadjuvant treatment. This staging system is currently considered the most accurate and standard system for this period. 24 Based on postoperative pathological T staging, ypT0, ypT1, and ypT2 were classified into the lower staging group (ypT0-2), while ypT3 and ypT4 were classified into the higher staging group (ypT3-4).
MR Image Acquisition and Tumor Segmentation
MRI examinations were conducted at a single institution using a 3.0 Tesla MRI scanner (Verio/MAGNETOM Skyra, Siemens, Germany) equipped with an 8-channel phased array body coil. Prior to examination, the intestines were emptied as thoroughly as possible, and the bladder was properly emptied. For patients without contraindications, an intradural injection of racemized anisodamine (5-10 mg) was administered. The protocol consisted of obtaining high-resolution T2-weighted images (T2WI) in oblique axial high-resolution planes and contrast-enhanced T1-weighted images (CE-T1WI). The parameters of the MRI sequences are provided in the Supplemental Materials.
The open-source software ITK-SNAP (http://www.itksnap.org/) was used to segment both CE-T1WI and T2WI images to identify tumors. A radiologist with a decade of experience painstakingly drew the Region of Interest (ROI) in a layer-by-layer fashion along the most salient solid boundary of the tumor for all 171 patients. The volume of interest (VOI) was generated automatically by the computer, carefully circumventing gas in the intestinal cavity and fat surrounding the intestinal wall, while precluding both the cable and burr shadows that were positioned rectum. To perform segmentation on a random selection of 30 patients, another radiologist (with 7 years of experience) utilized the coronal and sagittal planes as references. Both radiologists remained blinded to the clinical information and pathological results, with the exception of surgically confirmed lesion locations.
Radiomics Feature Extraction, Selection and Model Building
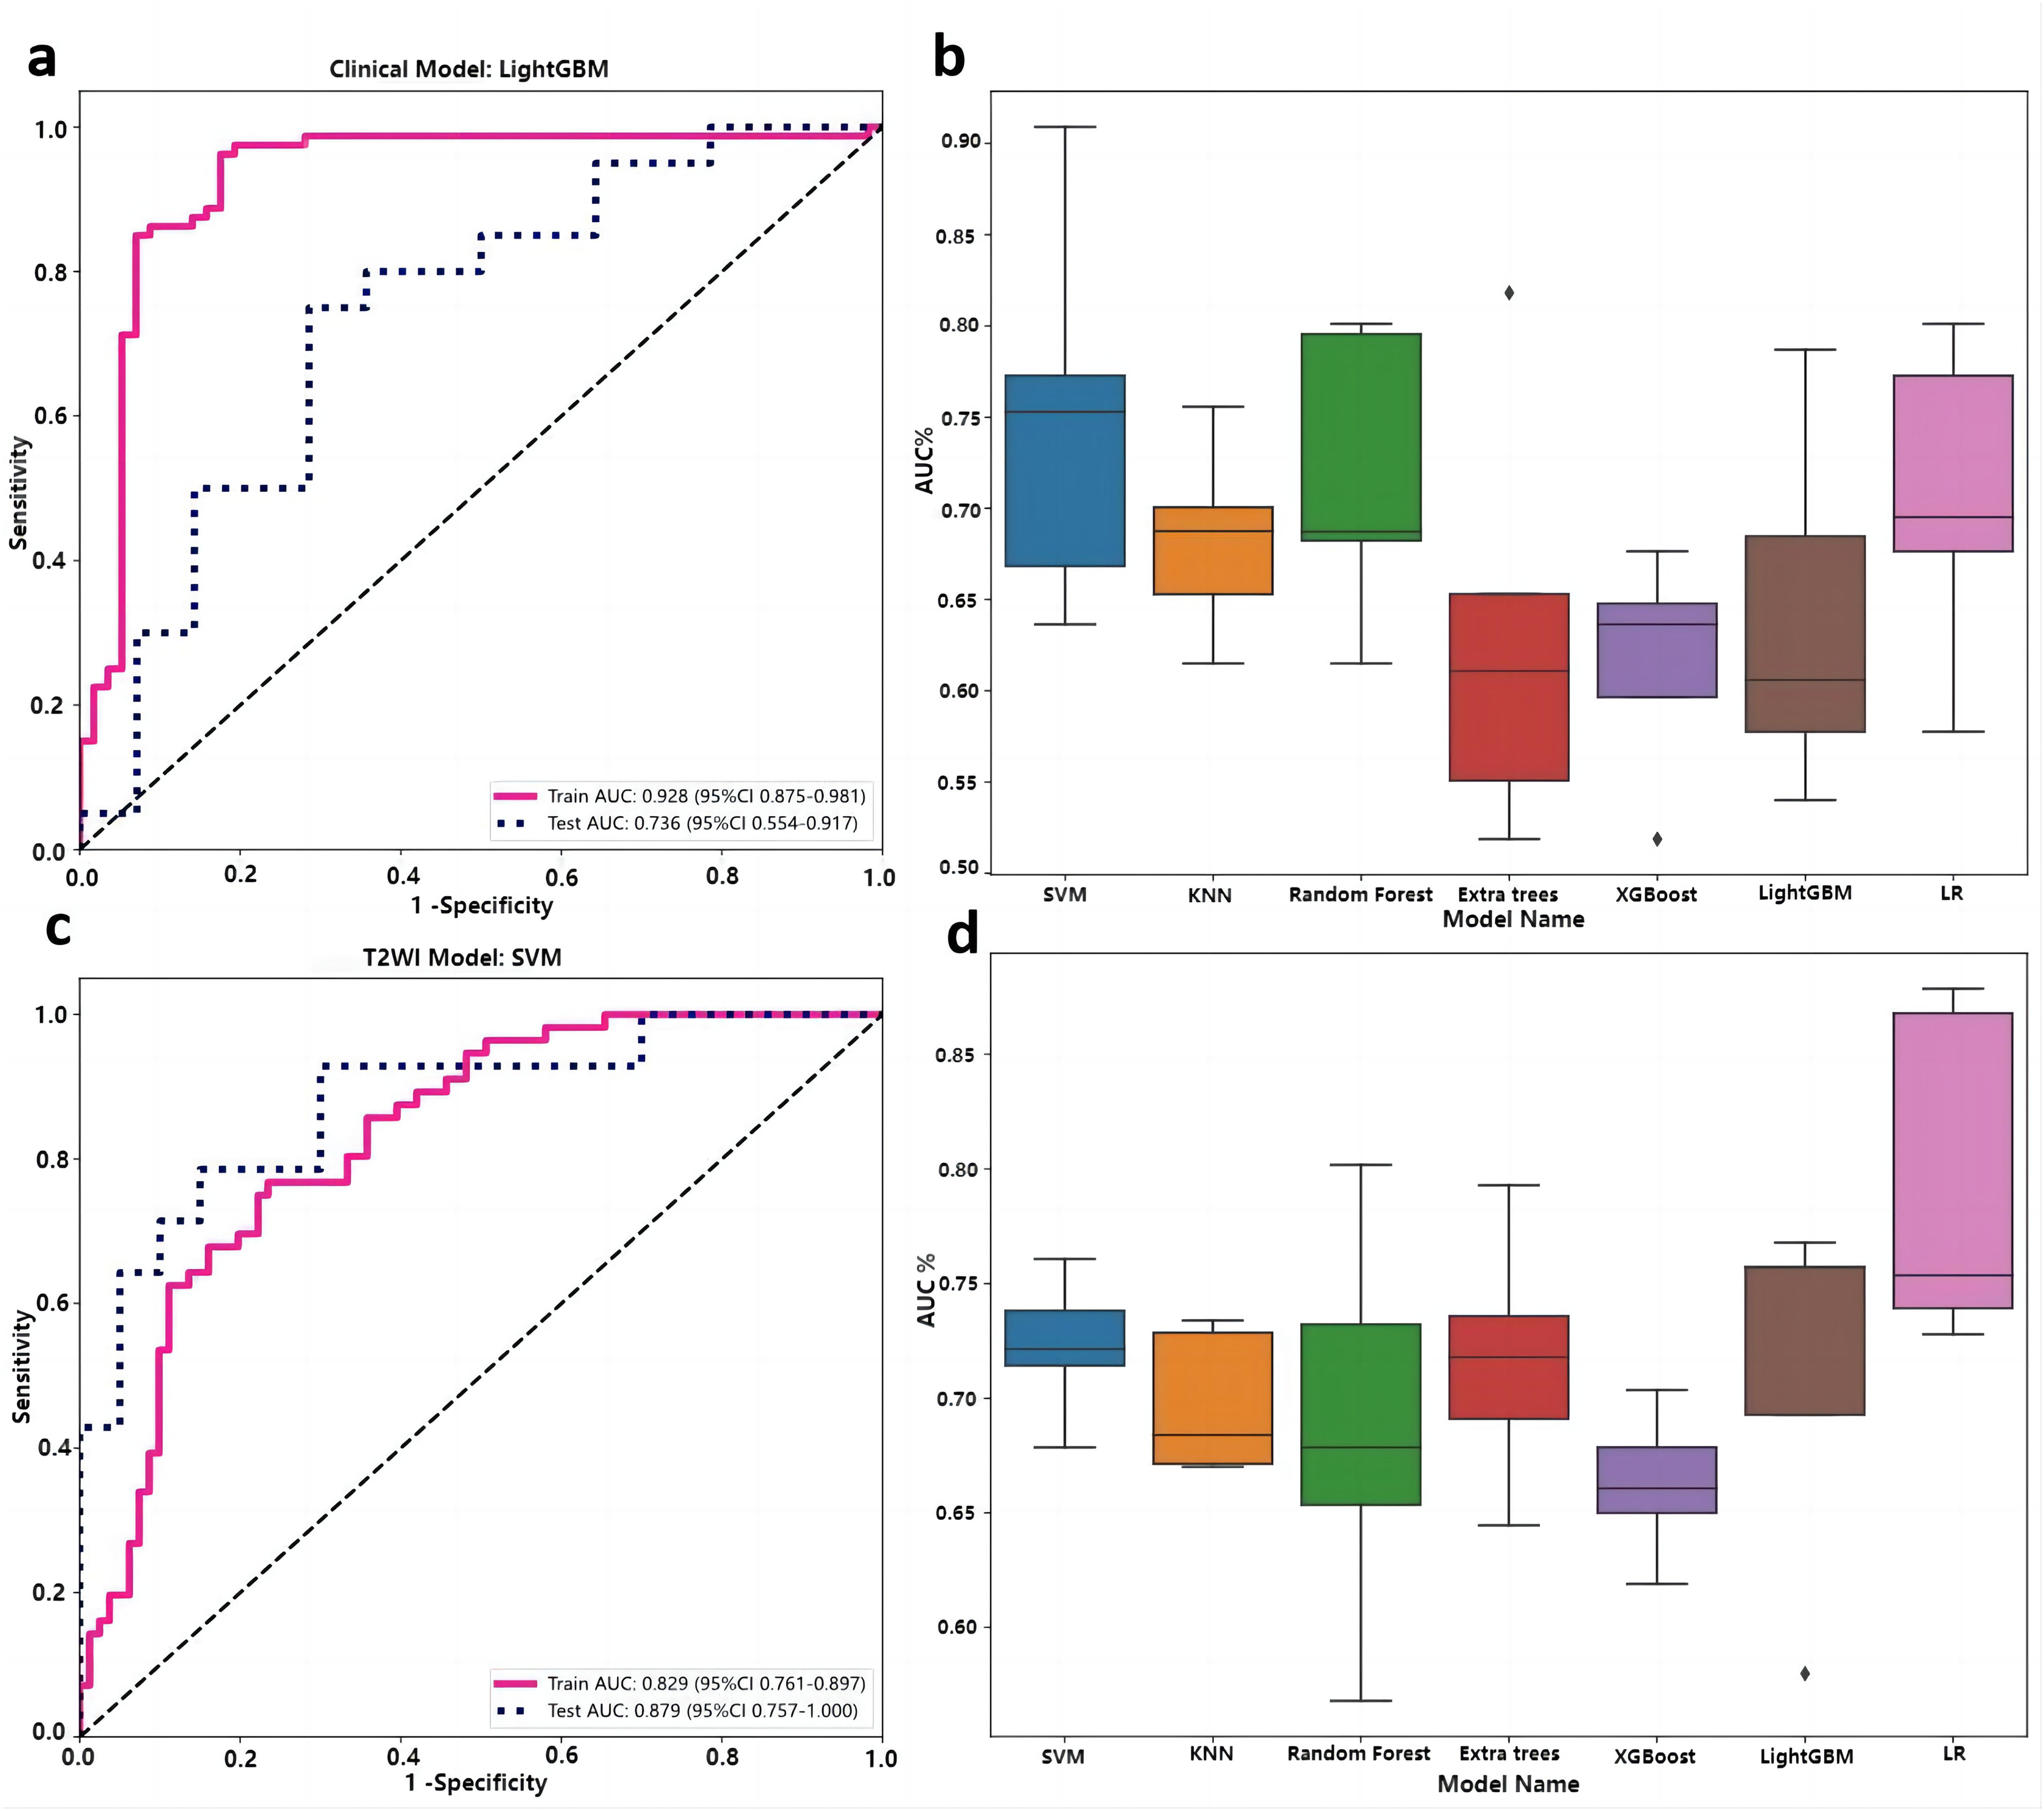
Firstly, the Python-based software Pyradiomics (v3.0.1) was employed to extract 1561 image-based features from both T2WI and CE-T1WI. The extracted features included shape, first-order, and higher-order texture features including the Gray-Level Co-occurrence Matrix (GLCM), Gray-Level Dependence Matrix (GLDM), Gray-Level Run Length Matrix (GLRLM), Gray-Level Size Zone Matrix (GLSZM), and Neighboring Gray Tone Difference Matrix (NGTDM) features. These features are regularized (Z-score) to transform the data to follow N∼(0, 1). Calculate the mean (mean) and variance (std) of each column of features and transform to zero mean and unit variance. Secondly, use the Spearman correlation coefficient to calculate the correlation between features for the extracted features and retain the features with good retention stability (correlation coefficient ≥ 0.9). Through LASSO method using 5-fold cross-validation, radiomics features with non-zero coefficients were selected to construct the radiomics score (RAD score) (Supplementary Figure 1). The data was randomly divided into a training cohort and a validation cohort, and 5-fold cross-validation was adopted to retain the best validation result. Lastly, various data sources such as CE-T1WI radiomics features, T2WI radiomics features, clinical features, fusion features (combination of clinical features, CE-T1WI, and T2WI radiomics features) were fed into the ML multiple classifiers. Support vector machine (SVM), K-nearest neighbor (KNN), random forest (RF), ExtraTrees, eXtreme Gradient Boosting (XGBoost), light gradient boosting machine (LightGBM), and logistic regression (LR) were utilized to construct prediction models for the pT stage. Different algorithm models are verified on the validation set to obtain common verification indicators and result visualizations. To evaluate the prediction models’ validity, 5-fold cross-validation was also performed on the dataset (Figure 1b, Figure 1d, Figure 2b and Figure 2d).

ROC curves of clinical model in the training and test cohorts based on LightGBM algorithm (a), comparison of seven algorithms (b). ROC curves of T2WI radiomics model in the training and test cohorts based on SVM algorithm (c), comparison of seven algorithms (d). ROC, receiver operating characteristic. SVM, support vector machine.
ROC curves of CE-T1WI radiomics model in the training and test cohorts based on SVM algorithm (a), comparison of seven algorithms (b). ROC curves of combined model in the training and test cohorts based on LR algorithm (c), comparison of seven algorithms (d). ROC, receiver operating characteristic. SVM, support vector machine. ROC, receiver operating characteristic. LR, logistic regression.
Statistical Analyses
R software (version 3.5.1; http://www.R-projetcorg) and Python (version 3.7.12) were used for statistical analyses. Chi-square tests were used for the analysis of categorical variables, while the Mann-Whitney U test was used for the analysis of radiomic features. P-values < 0.05 indicated statistically significant differences. The predictive performance of the model was evaluated using a receiver operating characteristic curve, and DeLong tests were used to compare the AUC values between the two models. Further, the adequacy of the model fit was tested using the Hosmer-Lemeshow (H-L) test, while a calibration curve was employed to evaluate the model's consistency and calibration performance. The clinical utility of the models was tested using decision curves.
Results
Patient Characteristics
The clinical and imaging baseline risk factors of patients in both the training and testing cohorts are summarized in Table 1. Among the 171 patients, 71 (41.5%) displayed a low pT stage by achieving ypT (0-2), whereas 100 (58.5%) displayed a high pT stage by achieving ypT (3-4), as determined by pathological assessment.
Clinical Characteristics Between the Posttreatment Lower and Higher T Stage Group

Age, sex, CA19-9, signal, spiculation, extent of tumor involvement in the intestinal ring, and extraMRF did not differ significantly between patients with low pT stage and those with high pT stage (P > 0.05); however, variables such as Diamax, TL, ThiT2, AeraT2, Dis, CEA, cancerous node, mural stratification, MRF status, EMVI status, and clinical T and N stages differed significantly between the two groups (P ≤ 0.05) (Table 1). Multivariate analysis including statistically significant variables from the univariate logistic regression analysis indicated that Lnmax, MRF status, clinical T stage, and N stage were significant predictors of low pT stage probability.
Construction and Validation of Different pT Prediction Models
The SVM, KNN, RF, ExtraTrees, XGBoost, LightGBM, and LR algorithms were employed to construct the clinical, T1WI radiomics, T2WI radiomics, and fusion models. The clinical model showed exceptional classification performance using the LightGBM algorithm, with training and test AUC values of 0.857 and 0.702, respectively (Figure 1 and Table 2). Additionally, the T2WI radiomics model exhibited superior computational efficiency when the SVM algorithm was applied, with training and test AUC values of 0.969 and 0.839, respectively (Figure 1 and Table 2). Similarly, the SVM algorithm exhibited the best predictive capability in the CE-T1WI radiomics model, as evidenced by an AUC of 0.868 and 0.760 for the training and test cohorts, respectively (Figure 2 and Table 2). In contrast, the fusion model demonstrated the highest prediction efficiency with the LR algorithm, exhibiting an AUC of 0.967 and 0.932 for the training and test cohorts, respectively (Figure 2 and Table 2). Assessment of the four distinct pT prognostic models and seven algorithms revealed that the fusion model based on the LR algorithm yielded the highest efficacy for pT prediction (Figure 3).

ROC curves of four prediction models based on the LR algorithm in the training cohort (a) and test cohort (b). ROC, receiver operating characteristic. LR, logistic regression.
Predictive Performances of Each Model in the Training and Test Cohorts

The Delong test indicated a considerable increase in the AUC value of the training cohort of the fusion model based on the LR algorithm compared with the clinical, T1WI radiomics, and T2WI radiomics models. This significance was noted only when the test cohort was compared with the clinical model (Table 3 and Figure 3). The calibrated fusion model based on the LR algorithm exhibited a strong agreement with the observed clinical outcomes (Figure 4). Notably, our findings suggest that employing this model to identify the pT stage can be paramount for effectively determining the necessity of treatment among patients with estimated threshold probabilities ranging from 0.0 to 1.0, in the training cohort (Figure 5).
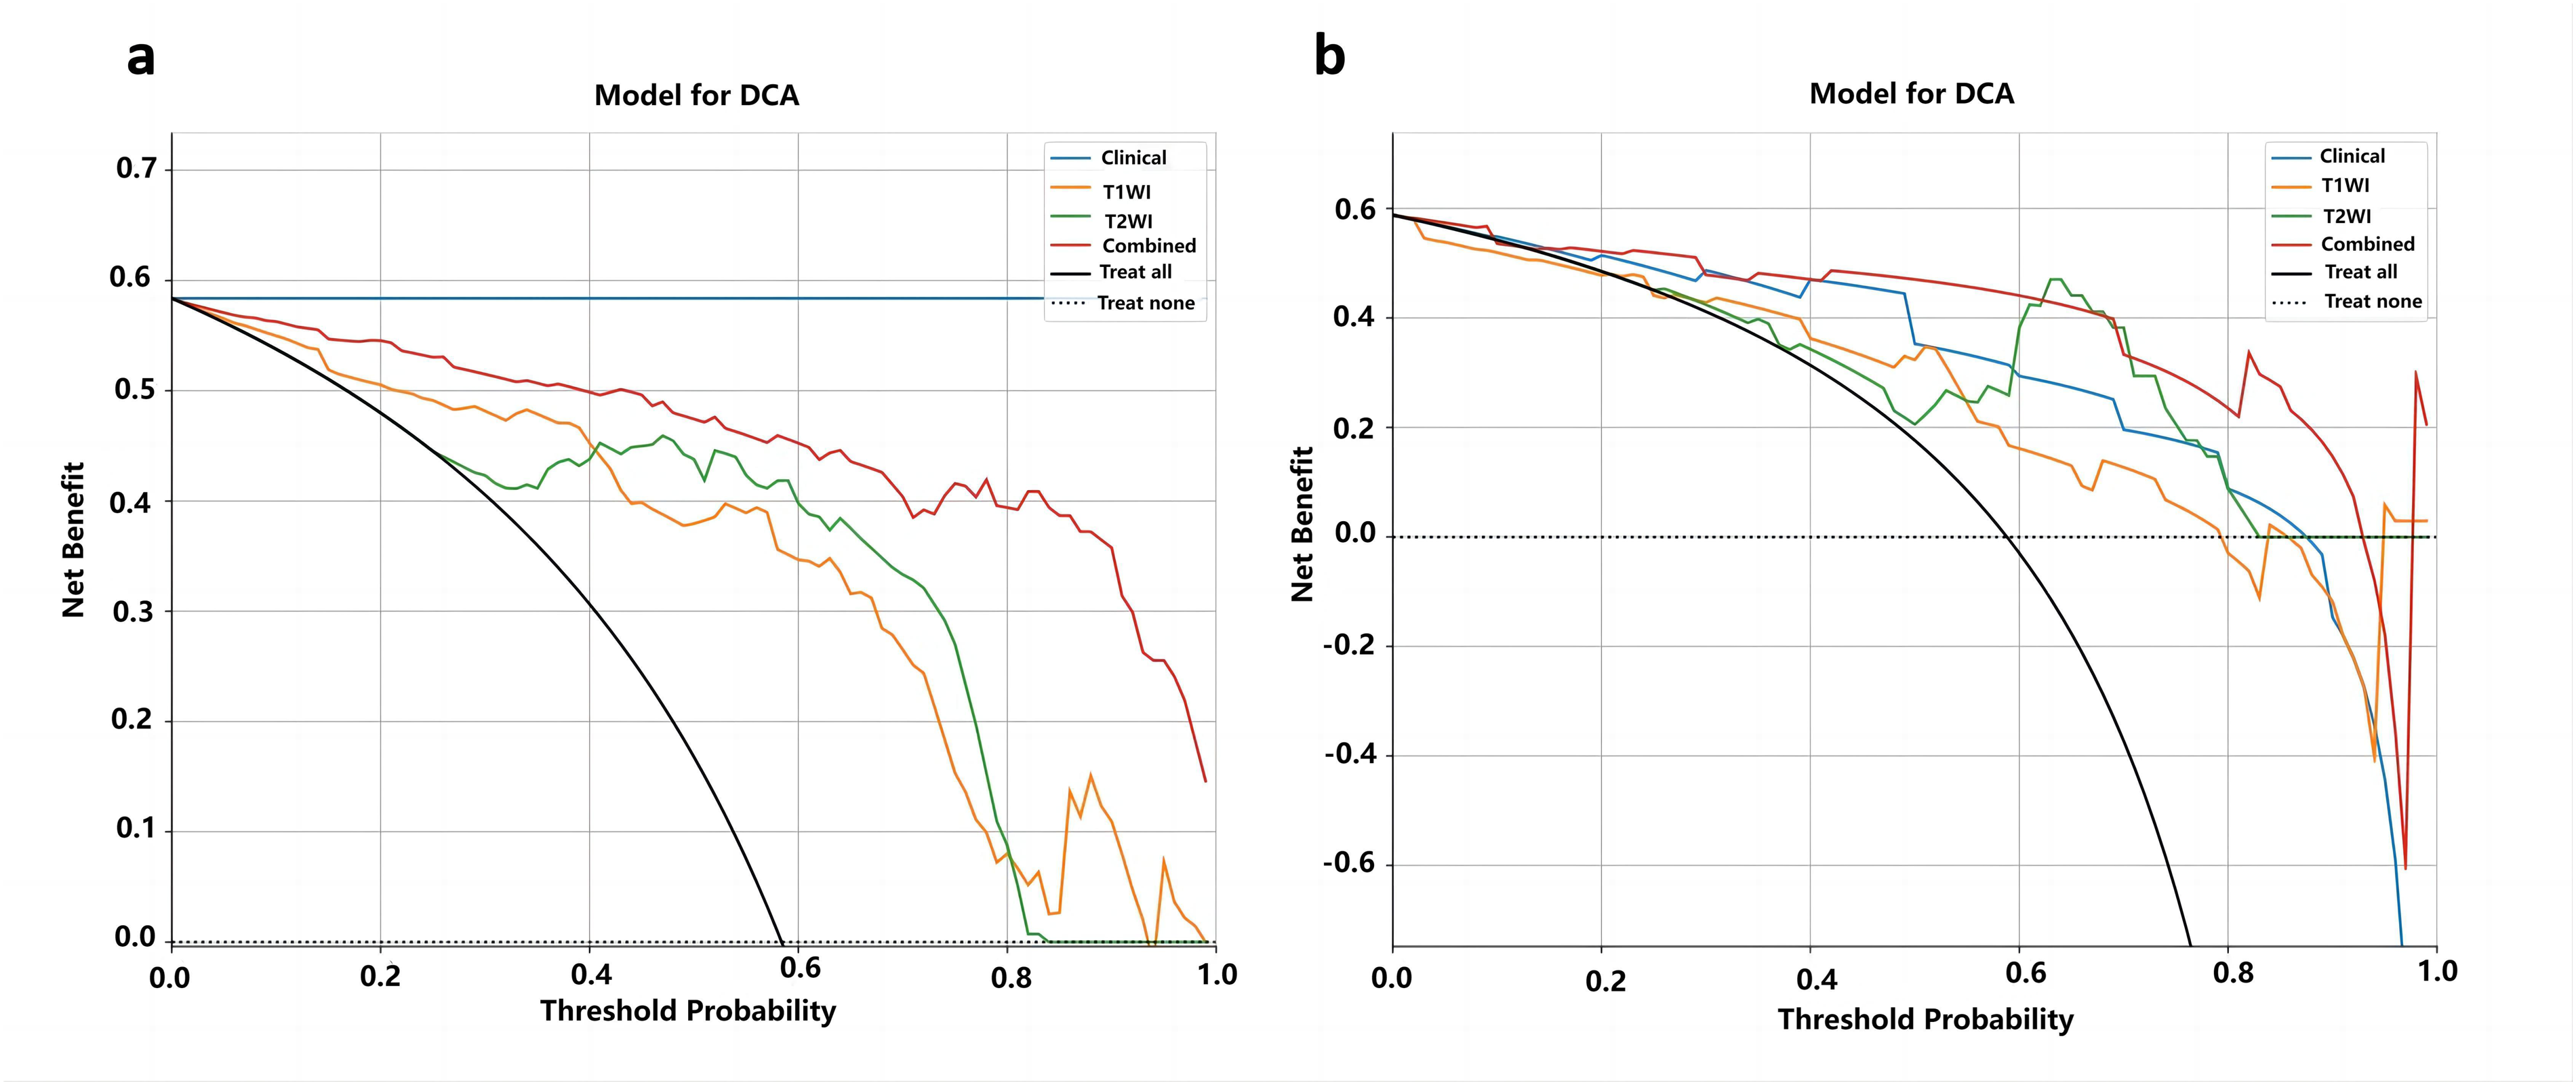
Decision curve analysis of the four models based on LR algorithm in the training cohort (a) and test cohort (b). The predicted threshold probability is represented on the x-axis and the net benefit is represented on the y-axis in our model. A model's clinical usefulness is contingent on its ability to provide higher net benefits than the “all” or “none” approach. It is evident that our integrated model exhibits significantly higher net benefits compared to default schemes across the majority of threshold probabilities in both cohorts.

Calibration curves of the four models based on LR algorithm in the training cohort (a) and test cohort (b).
Delong Test Between Each Model Based on LR Algorithm

Discussion
Both the clinical model and the T2WI and CE-T1WI radiomics models exhibited notable predictive efficacy in predicting the pT stage following neoadjuvant therapy in patients with rectal cancer. Compared with the clinical, T2WI and CE-T1WI radiomics models, the fusion model, which combined clinical features with multi-parameter MRI radiomics features using the LR algorithm, demonstrated superior efficacy, with an AUC of 0.967 in the training cohort and 0.932 in the test cohort. Notably, various algorithms produced differing results across different prediction models, with optimal performance identified in the LightGBM algorithm for the clinical model, SVM for the T2WI and CE-T1WI models, and the LR algorithm in the fusion model.
In the context of predicting neoadjuvant responses in rectal cancer, recent research has confirmed the superiority of features obtained from multi-parameter MRI over those obtained from single-mode imaging techniques,25,26 owing to the combined evaluation of anatomical and functional tumor characteristics offered by the former. Radiomics and machine learning techniques have the potential to further enhance this advantage. 27 Consistent with previous findings, the present study demonstrated the superior predictive performance of a fusion model over a single model for determining the pT stage of rectal cancer following neoadjuvant therapy. The multi-parameter model used in this study was selected for high-resolution T2WI sequences and axial T1WI enhanced sequences for selection. High-resolution T2WI sequences are deemed essential for accurately staging rectal cancer because they provide clear images of solid tumor components and pelvic lymph node metastasis. 28 T1WI enhanced sequences are widely employed in evaluating rectal cancer staging and have the potential to predict rectal cancer prognosis, survival, and T stage. For instance, a previous MR study using an internal rectal coil demonstrated that T1WI enhanced the accuracy of T3 tumor diagnosis. 29 Additionally, studies indicate that axial T1WI enhanced radiomics features are superior to high-resolution T2WI sequences in predicting rectal cancer survival, 30 whereas incorporating both T1WI enhanced sequences and high-resolution T2WI sequences can significantly improve the diagnostic performance of EMVI status in rectal cancer. 31 Therefore, it is speculated that T1WI enhanced images could provide extensive information on tumor heterogeneity and angiogenesis and that the integration of T1WI enhanced sequences into the multi-parameter radiomics model may significantly improve predictive efficacy. While previous studies utilized high-resolution T2WI sequences and DWI in the construction of multi-parameter imaging models for neoadjuvant therapy response prediction in rectal cancers,32–34 conventional apparent diffusion coefficient (ADC) and DWI images, as well as DCE images, are more prone to distortion and sensitivity artifacts, impeding reliable tumor segmentation and data extraction and making the construction of stable models even more challenging. Additionally, the long scanning time and intricate post-processing of DCE-MRI further limit its clinical applicability. 35
Machine learning-based radiomics methods integrate high-dimensional features that are challenging for radiologists to comprehend through visual inspection,36,37 thus, exhibiting potential as the most precise predictive methodology. Commonly employed ML techniques include KNN, LR, RF, SVM, and Decision Trees (DT). Despite the widespread use of these algorithms in classification and regression tasks, there is no uniform standard for determining the most suitable classifier for a given application. Unlike other studies that aimed to predict pT stage using a single ML algorithm,20,34 the present study sought to compare the effectiveness of different algorithms. The present results demonstrate that the LightGBMs and LR algorithms achieved the best efficiency in the clinical and fusion models, respectively, whereas the SVM algorithms showed the best efficiency in the T2WI and CE-T1WI radiomics models. This finding suggests that diverse prediction models may possess distinct optimal algorithms for predicting the treatment response of a particular disease; however, alternative prediction models may also share the same optimum algorithm. A previous review, encompassing 48 studies and investigating 49 diseases, aimed at evaluating the proficiency and suitability of machine learning algorithms for anticipating disease risks, revealed that despite the common usage of the SVM algorithm, the RF algorithm exhibited higher precision. 38 Additionally, the review highlighted that two of the five algorithms yielded high-level accuracy for a single disease, consistent with the present and previous 39 studies.
Regarding the algorithm applied in this study, ExtraTrees, XGBoost and LightGBMs algorithms are based on DTs that can be used for both classification and regression tasks. 40 Similar to ExtraTrees and XGBoost, LightGBMs are a type of gradient boosting algorithm, and the basic idea is to set target outcomes for the next model in a sequence that minimizes the prediction error. 41 In contrast to other algorithms, the SVM algorithm is a supervised machine-learning algorithm that draws upon statistical learning theory, 41 boasting the ability to proficiently manage multiple feature spaces and mitigate the risk of overfitting. The limitations of the SVM algorithm include its susceptibility to noise in the data and its inherent complexity in interpreting the resulting models, variable weights, and impacts. 42 It is worth noting that the LR algorithm was superior to the RF, SVM, DT algorithms, and DT derivatives when comparing the model-building efficiency of the different algorithms in the present study. The LR algorithm is widely used as a well-established and effective supervised classification method.43,44 The main advantages of the LR algorithm include easy implementation, model updating, and probabilistic interpretation of model parameters. 38 These findings underscore the superiority of the fusion model based on the LR algorithm as a reliable predictor of the condition in question. However, the limitations of the LR algorithm, including its inability to capture nonlinear relationships between variables and overconfidence in the key components of its logical model, cannot be ignored. 38 However, some algorithms, such as the KNN and RF algorithms, do not show corresponding superiority. These results may have been influenced by wide variations in the data and scope of the included disease prediction studies.
This study has some limitations. Firstly, it was a single-center retrospective study with a modest sample, which could potentially cause selection bias. Thus, our findings require further substantiation in larger, preferably multi-center cohorts to enhance the reliability of the results. Secondly, traditional manual delineation of the region of interest is time-consuming and involves a heavy workload, which can lead to poor repeatability and stability and affect the accuracy of the texture features. Therefore, semiautomatic or automatic segmentation of the ROI represents a crucial area for future research. Thirdly, the information presented in pathological images and genomes holds the potential for prognostic prediction. Therefore, larger and well-designed prospective studies incorporating multiple sources of information should be conducted in the future. Lastly, in order to strengthen the research, future studies will be dedicated to comparing the current research with deep learning-based radiomics and exploring the use of ensemble methods and NAS (Neural Architecture Search) to optimize model performance.
Conclusion
The multi-parametric MRI radiomics model, based on clinical features, axial T1WI enhancement, and high-resolution T2WI radiomics features, can improve the accuracy of predicting the T stage after neoadjuvant therapy for rectal cancer, potentially providing a basis for the personalized treatment of rectal cancer.
Supplemental Material
sj-docx-1-tct-10.1177_15330338241305463 - Supplemental material for Prediction of T Stage of Rectal Cancer After Neoadjuvant Therapy by Multi-Parameter Magnetic Resonance Radiomics Based on Machine Learning Algorithms
Supplemental material, sj-docx-1-tct-10.1177_15330338241305463 for Prediction of T Stage of Rectal Cancer After Neoadjuvant Therapy by Multi-Parameter Magnetic Resonance Radiomics Based on Machine Learning Algorithms by Tingting Nie, MD, Zilong Yuan, MS, Yaoyao He, MD, Haibo Xu, PhD, Xiaofang Guo, PhD, and Yulin Liu, PhD in Technology in Cancer Research & Treatment
Footnotes
Acknowledgments
This work was supported by the Cancer Research Program of National Cancer Center (NCC201917B05) and the Special Project of Biomedical Research Center of Hubei Cancer Hospital (2022SWZX06).
Author Contributions
Yulin Liu, Haibo Xu and Zilong Yuan have made a substantial contribution to the concept or design of the article; Yaoyao He, Xiaofang Guo have made a substantial contribution to the acquisition, analysis, or interpretation of data for the article; Tingting Nie drafted the article or revised it critically for important intellectual conten. They approved the version to be published. They have agreed to be accountable for all aspects of the work in ensuring that questions related to the accuracy or integrity of any part of the work are appropriately investigated and resolved.
Data Availability Statement
The datasets used and/or analysed during the current study available from the corresponding author on reasonable request.
Declaration of Conflicting Interests
The authors declared no potential conflicts of interest with respect to the research, authorship, and/or publication of this article.
Funding
The authors disclosed receipt of the following financial support for the research, authorship, and/or publication of this article: This work was supported by the Cancer Research Program of National Cancer Center (NCC201917B05), a Special Project of Biomedical Research Center of Hubei Cancer Hospital(2022SWZX06), a Hubei Province Chutian Talents Program medical and health personnel project, a National key Research and Development Program of China (2022YFC2410000), and Hubei Provincial Key Technology Foundation of China (2021ACA013).
Ethics Approval Statement
This retrospective study was approved by the institutional review board of Hubei Cancer Hospital in compliance with ethical principles derived from the Declaration of Helsinki and its subsequent amendments (the ethical committee approval number: [2020]KYLL(S05)).
Supplemental Material
Supplemental material for this article is available online.
References
Supplementary Material
Please find the following supplemental material available below.
For Open Access articles published under a Creative Commons License, all supplemental material carries the same license as the article it is associated with.
For non-Open Access articles published, all supplemental material carries a non-exclusive license, and permission requests for re-use of supplemental material or any part of supplemental material shall be sent directly to the copyright owner as specified in the copyright notice associated with the article.