
Abstract
Introduction
A lung tumor can deform and move significantly owing to respiratory motion,1,2 which can be up to 3 cm in the superior-inferior (SI) direction, resulting in a huge impact on a radiotherapy outcome. 3 Even if an isotropic 5 mm margin from a clinical target volume (CTV) was generated for respiratory motion compensation, planning target volume (PTV) D95 deviations up to 26% for fractional doses and 14% for total doses in lung stereotactic body radiotherapy were observed. 4 Accurate respiratory motion management can better protect organs at risk (OAR) while maintaining PTV coverage and adequate dose delivery. 5 To better manage the respiratory motion of the tumor, the location of the tumor should be tracked with high spatial and temporal accuracy. 6
Extensive motion tracking approaches have been proposed and successfully implemented in clinics.7–11 However, there are limitations with respect to the generality of direct tumor tracking techniques, for example, invasiveness of percutaneous implantation, the risk of pneumothorax or bleeding, 12 clinically acceptable radiation dose for imaging, 13 and migration of the marker. 14 A more clinical and practical tracking approach is to correlate the internal motions with external motions detected by external respiratory surrogates.10,13,15,16 This is because the external/internal correlation has been evaluated in both linear correlation algorithms and complex models such as support vector regression17,18 and principal component analysis. 19
However, respiratory motion and the motion characteristics of a lung tumor vary with each individual.20,21 The external/internal correlation between external and internal respiratory motion has nothing to do with tumor clinical characteristics such as tumor location, pulmonary function, and size, as well as patient breathing pattern, and other information.20,22 Other findings suggest that external respiratory motion waveforms do not always accurately correspond to the tumor motion in lung cancer patients, 23 and an external surrogate may not be sufficient to predict complex tumor motion.24,25 This may lead to the target location being missing when an external surrogate is used to guide treatment in lung cancer patients. Consequently, an individual technology of respiratory motion management is recommended.
In this case, we should not ignore individual differences between patients and use a streamlined tumor movement management plan without additional clinical workload. It is necessary to clarify the tumor motion of a specific patient to determine whether motion management is required and further management methods. The objective of our study is to find an accurate and efficient method to determine the external/ internal correlation for specific patients. The correlation can be assessed based on phase shift 26 and the normalization of real-time position management trace data for direct comparison with the fiducial location. 27 In our previous study, the correlation was calculated considering the Spearman correlation coefficient (SCC) and SCC after support vector regression fitting. 22 However, these methods all require significant additional data acquisition and processing. In the study, we report a novel approach to predict the correlation based on CT radiomic features through machine learning. Radiomics is a means to quantify the radiographic phenotype of a solid tumor via the high-throughput extraction and mining of quantitative features from images acquired from modalities such as CT and magnetic resonance imaging (MRI). 28 The information contained in these features is multidimensional and can be used for precision diagnosis, 29 radiation damage assessment, and prognosis analysis.30,31 In addition, there have been studies pertaining to respiratory motion on imaging via radiomics and the robustness of radiomic features.32–34 In this study, we further examined the potential of CT radiomic features in predicting external/internal correlations.
Materials and Methods
Patients and Treatment
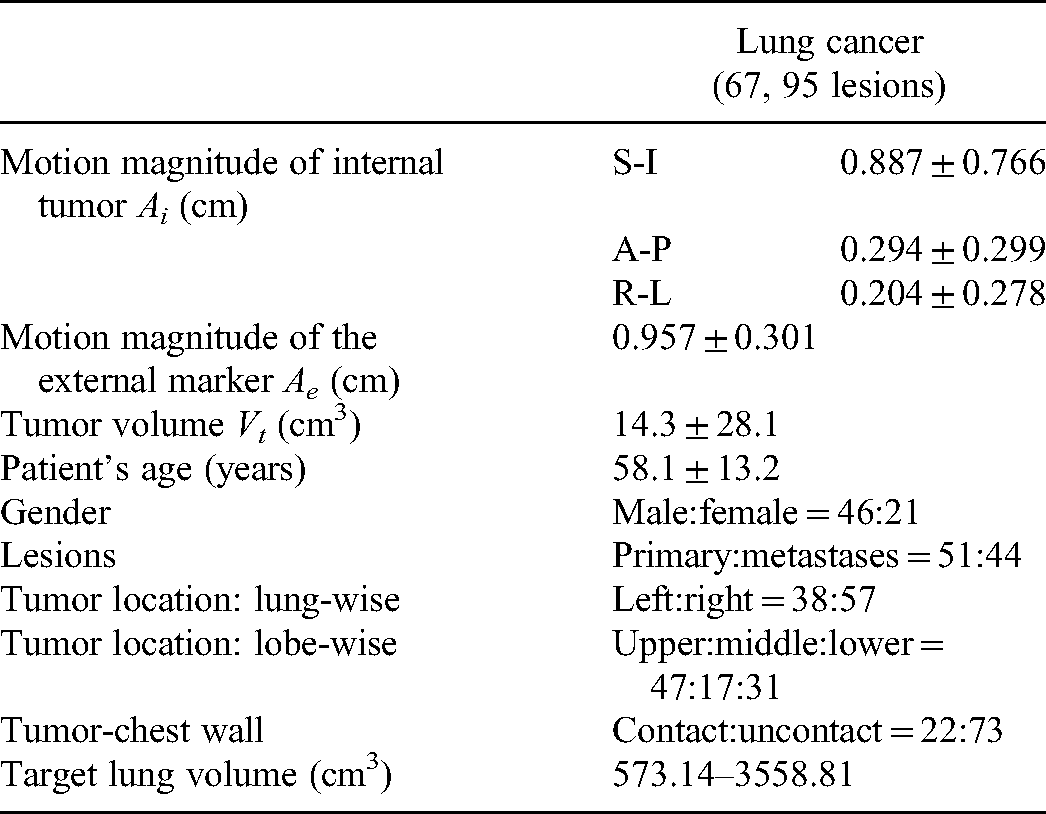
The study was approved by the ethics committee of West China Hospital with no need for patient consent (No. 2021-86) and registered with the Chinese Clinical trial Registration Center with the registration number “ChiCTR2100042714.” The basic characteristics of 67 patients with lung tumors treated at West China Hospital, between July 2020 and June 2021, were collected (Table 1) to perform a retrospective analysis, with all patient data being anonymized. Patients were treated with image-guided radiation therapy with 54–60 Gy in 2-Gy fractions over 5.5–7 weeks. This study conformed to TRIPOD statements. 35
Basic Characteristics of the 67 Lung Cancer Patients.
All patients underwent a full 4DCT scan in the treatment position under free breathing, which was performed using a Revolution CT instrument (GE Healthcare, Milwaukee, WI, USA). The Varian real-time position management system (Varian Medical Systems, Palo Alto, CA, USA) was used to obtain patient external motion coordinate data. The multiple sets of external real-time motion coordinate data were grouped according to the corresponding respiratory phase, and the average value was used as the external motion data of the phase. Afterward a 4DCT reconstruction with a slice thickness of 3 mm for region of interest (ROI) contouring and treatment planning was performed.
ROI Segmentation and Evaluation of External/Internal Correlation
A radiation oncologist contoured the gross target volume (GTV) of 10 respiratory phases on a 4DCT based on the Raystation treatment planning system V4.7.6 (RaySearch Laboratories AB, Stockholm, Sweden). Internal tumor motion data are acquired from 4DCT. After CTV contouring, the coordinates of the tumor centroid (Px, Py, and Pz) corresponding to 10 respiratory phases were obtained, which were used as internal tumor motion magnitude. According to ESTRO ACROP consensus guideline, 36 employ 0 mm GTV-to-CTV margins. The CTVs are fused on the average intensity projection (AIP) CT to generate 1 internal target volume (ITV). The results were reviewed, edited, and approved by the responsible radiation oncologist, according to our clinical routine. The ITV is the ROI for feature extraction (Figure 1(a)). For patients with multiple tumors, we obtained the internal motion data for each tumor. In this way, we obtained 95 lung ROIs.

Schematic representation of the radiomics workflow. (a) After image preprocessing, the ROI segmentation was performed. (b) Radiomic features including shape features, statistics features, textural features, and transform-based features were extracted. (c) Flowchart of feature engineering based on LightGBM-RFECV.
The external/ internal correlation was calculated using SCC, which is a nonparametric technique for evaluating the degree of linear association or correlation between 2 independent variables. 37 An SCC value equal to 1 indicates a perfect correlation. The correlation values calculated varied from 0.007 to 0.988, indicating the variability between individual patients. This study mainly focused on the tumor motion in the SI direction because the largest lung tumor motion has been observed in the SI direction (ranging from 3 to 46 mm). 38
Feature Extraction
A set of 1218 radiomic features were extracted from ROIs using pyradiomics v3.0.1, which is Imaging Biomarker Standardization Initiative (IBSI)-compliant.
39
The feature definitions described by IBSI are available in a separate document by Zwanenburg et al.
39
All the CTs voxels were resampled to
Feature Engineering
In this study, light gradient boosting machine-based recursive feature elimination (LightGBM-RFE) was used to select features. The RFE is a feature selection method that fits a model and removes the weakest feature (or features) according to a designated feature ranking standard. Recursion is necessary because for certain measures the relevance of the feature may change substantially when the step-wise elimination process is carried out under a different subset of features. The LightGBM-based RFE algorithm can be expressed as follows:
The training set was denoted by Step 1: Train a LightGBM model on the initial features set and rank the features by minimizing the mean absolute error. Step 2: Determine the feature with smallest ranking criterion and eliminate it. Step 3: Update the feature rank. Step 4: Repeat Steps 1–3 until the feature F is empty or the desired number of features remained.
As deciding the number of features should be retained from the feature rank of LightGBM-RFE can have a critical impact, the linear LightGBM-RFE with a stratified-5-fold cross-validation strategy (LightGBM-RFECV) was used to find the minimum feature rank on which the LightGBM model can achieve best performance. The flowchart of the feature selection using LightGBM-RFECV is shown in Figure 1(c).
The feature importance was evaluated based on the R2 score, which represents the proportion of the variance for a dependent variable that is explained by an independent variable or variables in the model. R2 score was calculated using the following formula:
Radiomics-Based Predictive Model Building
Based on the radiomic datasets, the classification models were developed using LightGBM. The LightGBM embedded feature dimensionality reduction technology used weak classifiers for training, having high speed and accuracy. Models 0.7, 0.8, and 0.9 were built with classification thresholds with SCC values of 0.7, 0.8, and 0.9, respectively. Kernel Shapley Additive exPlanations (SHAP) were used in 3 models to assess the impact of radiomic features on correlation prediction outcomes. SHAP assigns each feature an importance value for a particular prediction, which is calculated separately without considering any general information regarding the entire model. Kernel SHAP requires fewer evaluations of the original model to obtain similar approximation accuracy. 40 Features with high absolute SHAP values have high importance, whereas low values indicate low importance.
Due to the small sample size, most of the radiomic studies did not use a validation dataset. 41 To improve the stability of the model, the test set was split by stratified sampling to ensure that the test set does not participate in the training of the model (the same class ratio is preserved throughout all folds). The remaining data were partitioned into 5 equally sized folds. Five iterations of training, validation, and testing were performed subsequently wherein each of the subsamples acted as a validation set (once) and as a part of the training set (4 times). The above training process was performed 5 times to obtain stable results. To avoid the impact of class imbalance on the performance of the model, under- and oversampling are used to render the number of positive and negative samples as close as possible. This can be achieved by sampling a small number of samples from the majority class and multiple times from a minority class, respectively. 42 A hyperparameter selection process was used to decide the best set of hyperparameters achieving the highest balanced accuracy and perform an evaluation of model performance. Figure 2 shows the schematic diagram of the training method.

Illustration of the structure for a stratified 5-fold cross-validation method.
Statistical Analyses
Model classification forecasting performances were evaluated using: receiver operating characteristic (ROC) curves, AUC, positive predictive values, negative predictive values, sensitivities, specificities, balanced accuracies, and F-score values. According to the predicted external/internal correlation values, the samples can be classified into 4 types: (1) true positive (TP): both the SCC and predicted value were classified as 1; (2) true negative (TN): both the SCC and predicted value were classified as 0; (3) false positive (FP): the SCC value was classified as 0 while the predicted value was classified as 1; (4) false negative (FN): the SCC value was classified as 1 while the predicted value was classified as 0. The sensitivities and specificities were calculated as follows:

Results
Feature Selection
The selected features with top averaged R2 scores after feature engineering in each model are shown in Figure 3. For model 0.7, 16 features out of 1218 features were selected. 18 features were selected in model 0.8 while for model 0.9, 13 features were selected. There were 12 common features in the 3 models. Texture features were selected most frequently, including the GLCM, GLSZM, and the GLDM feature while only a few first-order and shape features contributed to the model. No clinical feature was selected.
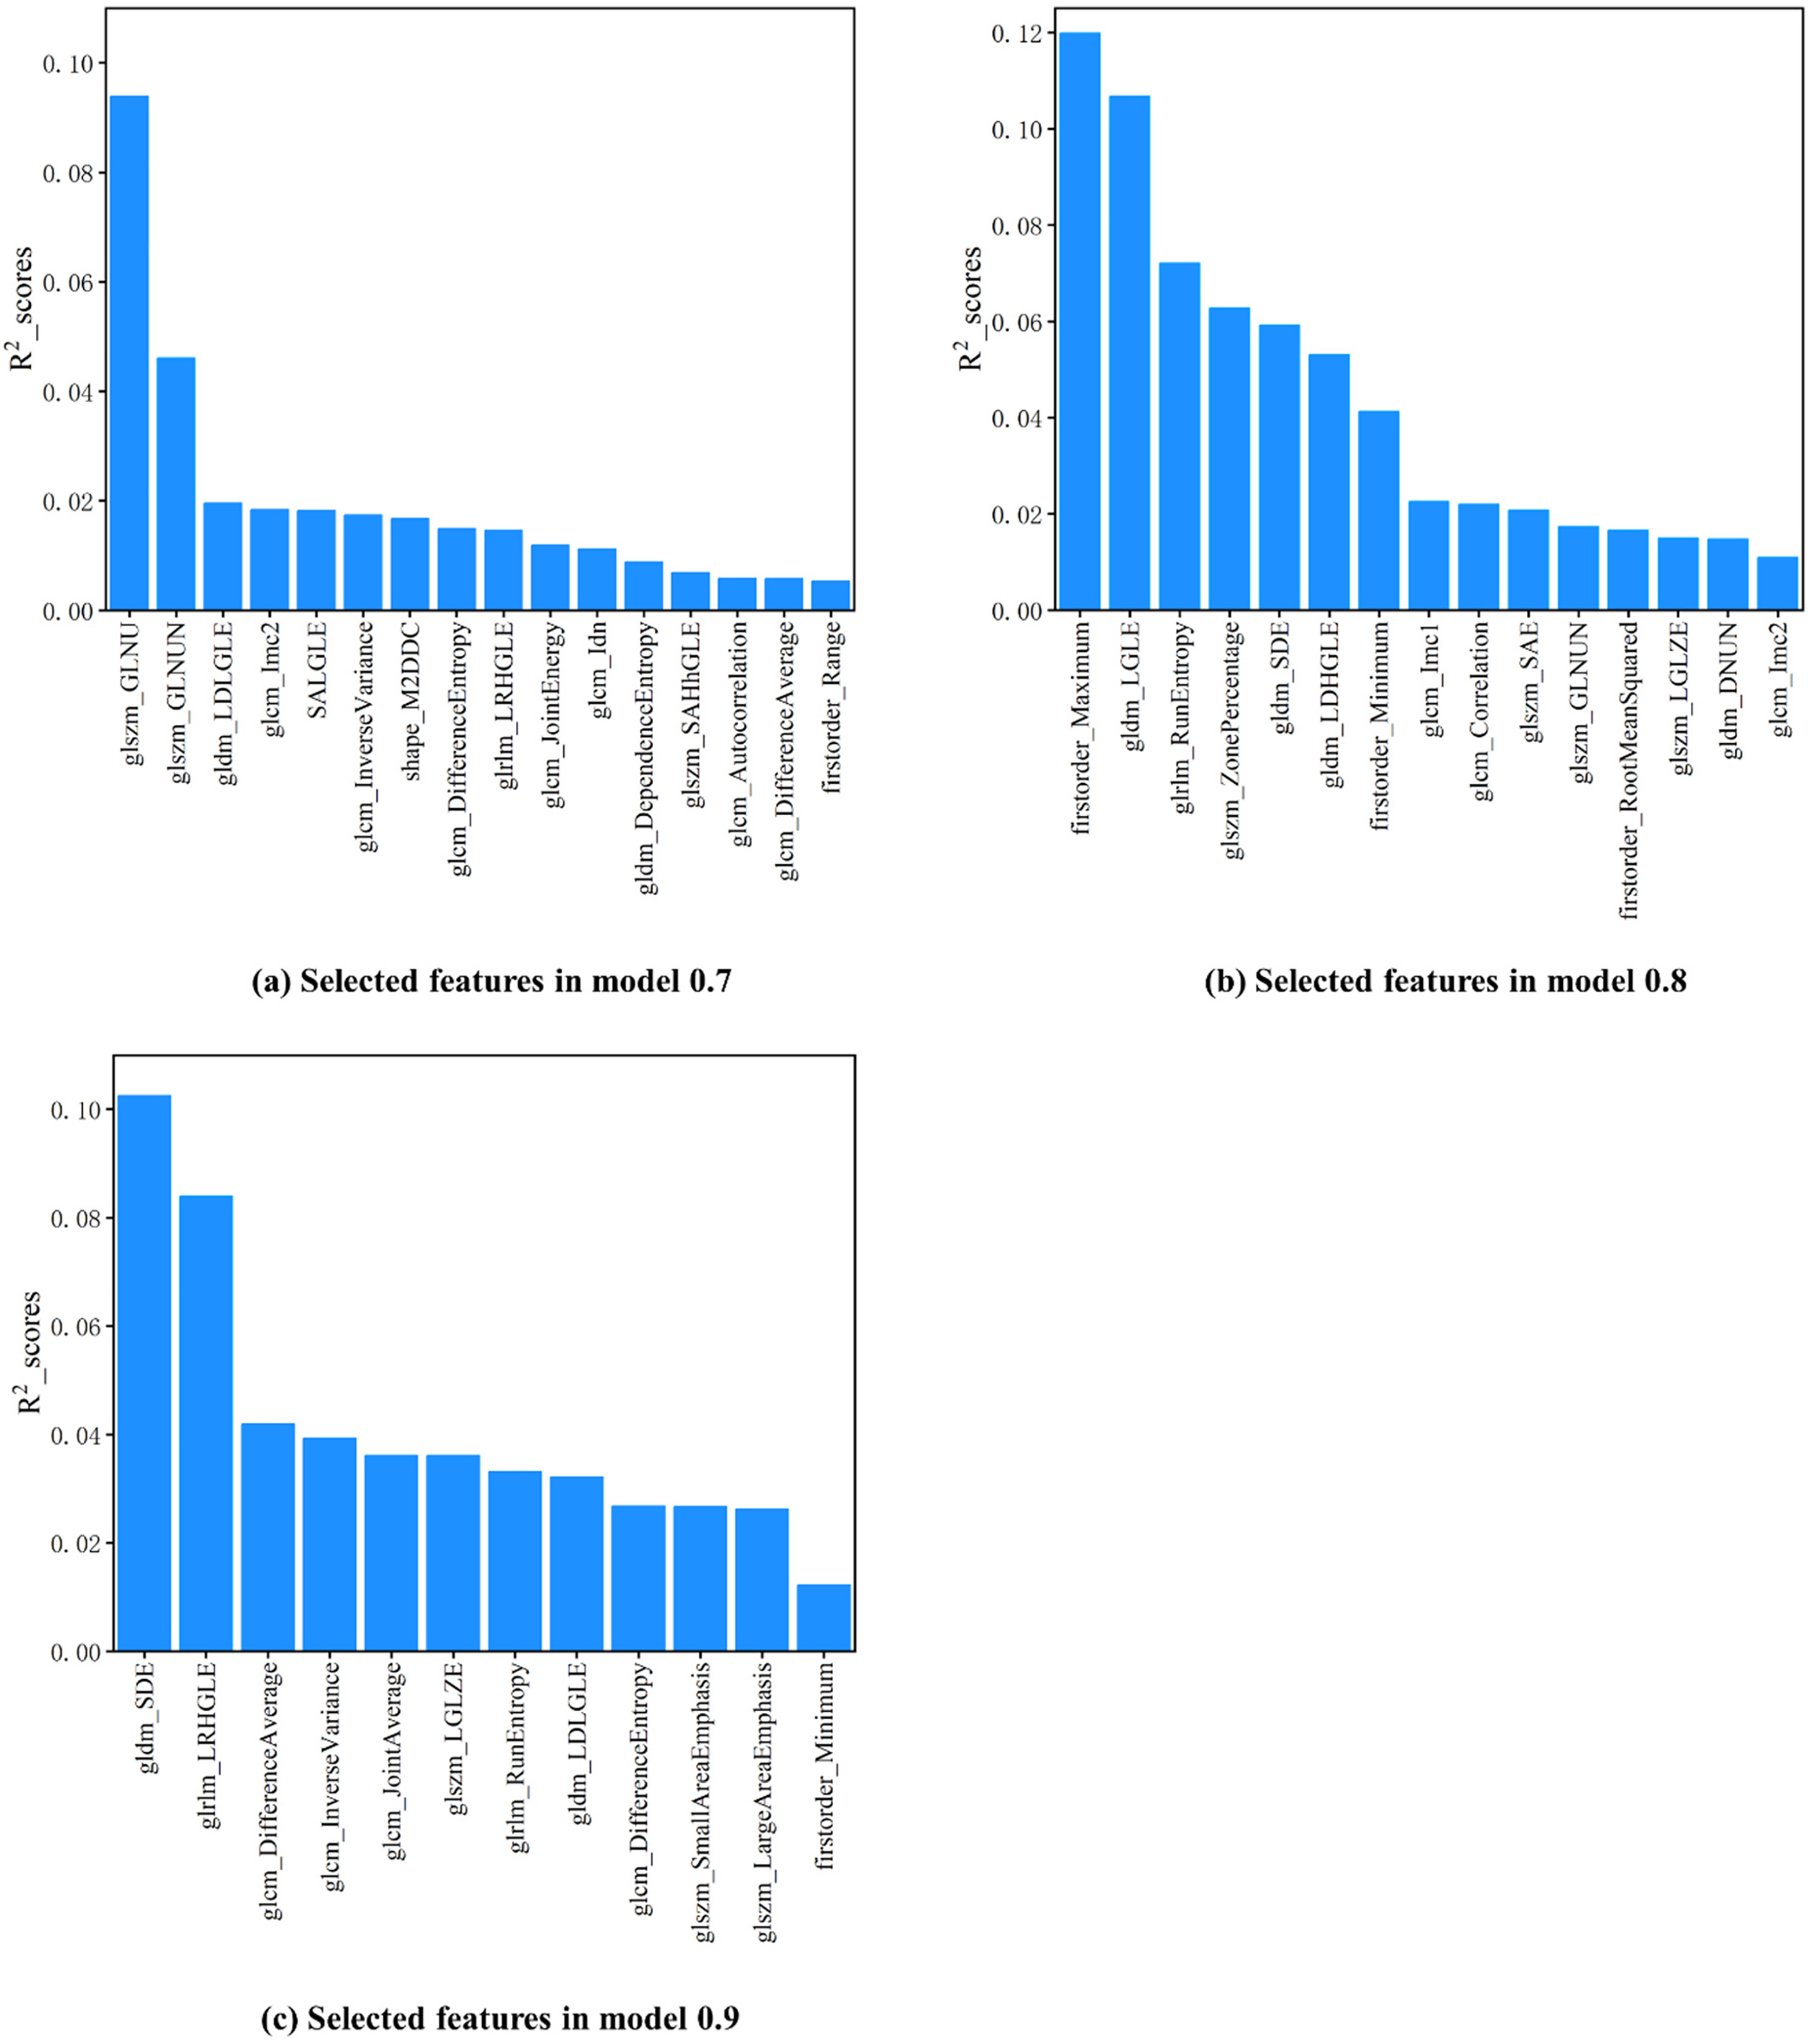
Feature importance ranks in the 0.7, 0.8, and 0.9 models obtained by LightGBM-RFECV are shown in (a–c). The R2 scores were averaged over 5 rounds of independent tests.
During the 5 rounds of independent tests, certain features consistently showed high predictive potential for the correlation coefficient between the internal tumor and the external surrogate (CCIE) in each model, and they are as follows: the GLSZM-Gray-level nonuniformity and the GLDM-Large dependence low gray-level emphasis for model 0.7; the first-order maximum and the GLDM-Low gray-level emphasis for model 0.8; the GLDM-Small dependence emphasis and the GLRLM-Long run high gray-level emphasis for model 0.9.
The results evaluating the influence of radiomic features on the CCIE prediction using Kernel SHAP in the 3 models are shown in Figure 4. Colored plots represent SHAP values, and blue and red plots represent lower and higher values, respectively. The SHAP value ranking of features is slightly different from the importance ranking. In the plots of the first-order maximum from model 0.8, the color distribution is opposite to the SHAP value distribution, indicating that the prediction CCIE tends to be negative with a higher maximum. On the contrary, for the GLDM-SDE from model 0.9, red points are distributed in the range of the positive SHAP values, indicating that the CCIE is more likely to be predicted as positive with higher GLDM-SDE.

Summary plots of Kernel Shapley additive explanations (SHAP) in the 3 models. The influence of each selected feature on a prediction is shown as colored plots. The blue and red plots represent lower and higher values of the features, respectively.
Performance of the Radiomics Models
The difference in the performance of the models is summarized in Table 2. When the threshold was 0.7, owing to uneven sample distribution, more than 80% of the samples were negative samples. To improve the performance of the model, undersampling and oversampling methods were used to balance the positive and negative samples. The sensitivity of the final model was 0.800 and the specificity was 0.771. It can be seen from the obtained results that compared to 0.7, when the threshold was set to 0.8, the sensitivity and specificity of the model improved, with the sensitivity and the specificity being 0.829 and 0.936, respectively. The sensitivity of the model continued to increase (0.864 for model 0.9) as the threshold increased, while the specificity showed a downward trend to 0.839.
Prediction Performance of Different Radiomic Models.
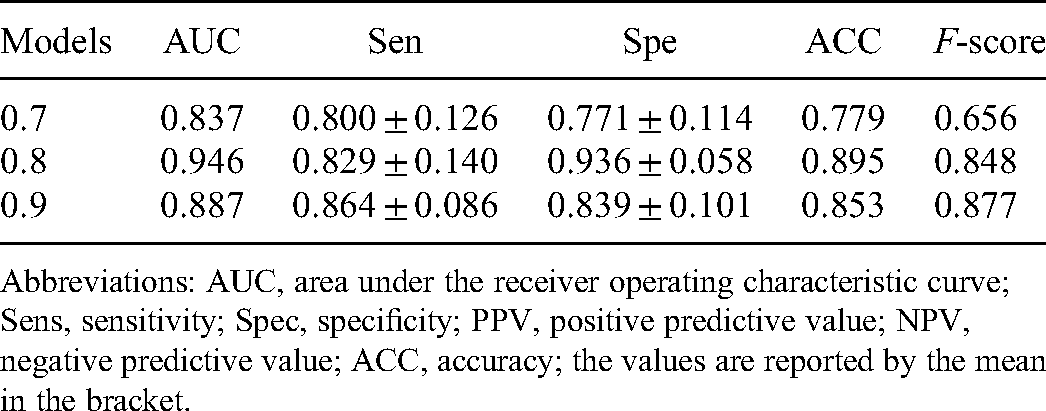
Abbreviations: AUC, area under the receiver operating characteristic curve; Sens, sensitivity; Spec, specificity; PPV, positive predictive value; NPV, negative predictive value; ACC, accuracy; the values are reported by the mean in the bracket.
The 5-fold combined ROC curves for the 3 models are shown in Figure 5. Model 0.7 demonstrated a performance with an AUC of 0.837, and model 0.8 achieved the best performance with an AUC of 0.946. Model with a threshold of 0.9 achieved an average performance with an AUC of 0.887. The model performance in each fold is provided in Supplementary File 1.

ROC curves of the 3 machine learning models. The area under this curve is a measure of the overall predictive utility of the model. The dashed line matching to an AUC of 0.5 indicates performance equal to random guessing.
Discussion
In this study, we emphasized the necessity to determine the external/internal correlation for specific patients and propose a new process to predict the correlation individually via radiomic features specific to a patient. According to our clinical routine, all lung tumor patients accept a 4DCT scan under free breathing for treatment planning, which helps to obtain the motion range of the tumor during respiration. Therefore, the AIP CT generated by a 4DCT contains tumor motion edges within one respiratory cycle and presents this information in imaging with the intensity-spatial distribution of the ROI.
There were 31 radiomic features selected in total, including one shape feature (shape-Maximum 2D diameter column), 4 first-order features, and 24 texture features. First-order features show the ROI voxel intensities distribution based on first-order histograms. Texture features consider the local intensity-spatial distribution in the ROI and provide statistical interrelationships between voxels, which compensate for the loss of information related to the first-order features. Moreover, it has been proven that the texture features extracted by radiomics are not affected by tumor position, size, orientation, and brightness. 44 The features selected for developing the model were highly consistent with those inferred to be sensitive to respiratory motion. Thus, tumor motion information was demonstrated to be obtainable by radiomics. 26
The radiomic pipelines, including image acquisition, feature extraction, and statistical analyses, vary widely across different studies 27 ; therefore, the radiomic features must be focused upon. 45 A radiomic features stability study found that a 4DCT dataset can be used as an alternative to eliminate most of the unstable features as the first step in a feature selection procedure. 46 All features used in our work have a concordance correlation coefficient value above 0.85, signifying a high repeatability and robustness according to their results.
A feature engineering procedure reduces the complexity of the model. 47 It improves the interpretability of the model as well as the predictive ability. The LightGBM-based RFECV method that we used in this work helped reduce data redundancy by lowering the dimensions of features. 48 Hence, the method increased the ratio between the input data dimensions and the filtered feature dimensions, further reducing overfitting. 35 We used a test set for the evaluation of the supervised feature engineering process to avoid overestimated classification predictive results. The feature importance ranking was consistent during the cross-validation.
There is no relevant research to refer to as the gold standard for the demarcation of the correlation between the external motion and the internal tumor motion. We had to establish 3 models with different classification thresholds (0.7, 0.8, and 0.9) for classification forecasting. To reduce the probability of misjudging low-correlation patients as high-correlation and improve the sensitivity of the model in low-correlation samples, we marked low-correlation samples as positive samples. The ratio of positive to negative samples was approximately 1:4 when the threshold was set to 0.7. To improve the performance, we adopted undersampling and oversampling methods to optimize sample distribution. As the classification threshold increases, more samples are marked as positive samples, which ameliorates the sample distribution. From this process, the sensitivity is improved, and the specificity is slightly reduced. For a comprehensive consideration of sensitivity and specificity, the optimal classification threshold should be set to 0.8.
The external/internal correlation cannot simply be derived from patient respiratory and tumor characteristics. The existing exploratory research of the correlation mainly focuses on the measurements of the movement of the whole thoracoabdominal surface49–51 and improving the accuracy of the correlation through various algorithms. Yu 15 established a 3D voxel model obtaining rich respiratory features of thoracoabdominal torsos, which enhanced the accuracy of tumor motion correlations. Liu et al developed a support vector classification for predicting liver tumor tacking errors based on the features extracted from delivery system log files and achieved good accuracy (AUC = 0.87) at a 2 mm threshold. 52 Okawa et al predicted thoracoabdominal tumor tracking errors within 2.1 mm according to a patient's respiratory waveform. 53 In this study, we developed a model based on tumor radiomic features to achieve similar accurate predictions of external/internal correlation at thresholds of 0.8 and 0.9. Obtaining this information assists in making more appropriate tumor motion tracking strategy decisions and increases treatment profits. Furthermore, as an exploratory study, the overall framework can allow the combination of more advanced correlation measurement methods and other information data, such as body surface movement characteristics. In addition, we included all patients who satisfied the inclusion criteria, and the sample size was sufficient for model training. The inclusion of more samples may result in performance improvements, which need to be further verified. For a patient whose external/internal correlation is predicted to be high, we recommend using external surrogate position monitoring for indirect tumor tracking. It can reduce both the intrafraction setup uncertainty and prospectively predict the upcoming position of the tumor during treatment, which in return will ensure an adequate dose to the target and a reduced dose to OAR.54,55 For patients with unsatisfactory correlation, we recommend using other tumor motion tracking methods according to current clinical technology, such as fiducial marker, 56 fluoroscopy imaging, 57 and AI-based motion prediction. 58
There are several limitations of our study. First, our study has a small sample size, with only 67 patients enrolled. Abundant imaging features extracted in radiomics increase the risk of overfitting, and the inclusion of more samples may result in performance improvements, which need to be further verified. 59 Second, there is no consensus of standardized implementations of the radiomic workflow; wide variation in clinical imaging acquisition parameters can affect image noise and texture and consequently the radiomic features’ value. 60 Furthermore, indirect tumor tracking methods require a constant internal/external correlation in clinical practice. 61 There are variations among motion amplitudes and among tumor positions from day to day, 62 and the impact of such variations on the stability of the external/ internal correlation will limit the accuracy of our model and thus requires further study. The stability of the correlation can be guaranteed by acquiring robust motion data. The external/ internal correlation calculated from the body surface motion data (obtained by the audiovisual biofeedback technology) has no statistical difference between before and during treatment, which can be used to ensure the stability of the external/ internal correlation. 63 In addition, appropriate breathing training and voice guidance for patients during the simulated 4DCT period and fractionated treatments can also improve the CCIE stability. 64 In future work, we will further explore the stability of the external/internal correlation. We will look for features that may reflect changes in the external/internal correlation and build a model with predictive stability over interfractions.
Conclusion
In this study, we determined that the external and internal lung tumor respiratory motion correlation can be reflected by CT radiomic features. We provided a machine learning framework to achieve accurately classified predictions of the correlation, which can assist in determining the motion management strategy for lung tumor patients.
Supplemental Material
sj-pdf-1-tct-10.1177_15330338221143224 - Supplemental material for Machine Learning Radiomics Model for External and Internal Respiratory Motion Correlation Prediction in Lung Tumor
Supplemental material, sj-pdf-1-tct-10.1177_15330338221143224 for Machine Learning Radiomics Model for External and Internal Respiratory Motion Correlation Prediction in Lung Tumor by Xiangyu Zhang, Xinyu Song, Guangjun Li, Lian Duan, Guangyu Wang, Guyu Dai, Ying Song, Jing Li and Sen Bai in Technology in Cancer Research & Treatment
Footnotes
Acknowledgments
Not applicable.
Author Contribution
Xiangyu Zhang and Xinyu Song contributed equally to this work.
Declaration of Conflicting Interests
The author(s) declared no potential conflicts of interest with respect to the research, authorship, and/or publication of this article.
Ethical Approval
This study was approved by the ethics committee of the West China Hospital with no need for patient consent (No. 2021-86) and registered by the Chinese Clinical trial Registration Center with registration number “ChiCTR2100042714.”
Funding
The author(s) disclosed receipt of the following financial support for the research, authorship, and/or publication of this article: This work was supported by the National Natural Science Foundation of China (grant numbers 81972848, 81472807, and 81803056), and the Sichuan Science and Technology Program (grant number 2021YFS0143).
Supplemental Material
Supplemental material for this article is available online.
References
Supplementary Material
Please find the following supplemental material available below.
For Open Access articles published under a Creative Commons License, all supplemental material carries the same license as the article it is associated with.
For non-Open Access articles published, all supplemental material carries a non-exclusive license, and permission requests for re-use of supplemental material or any part of supplemental material shall be sent directly to the copyright owner as specified in the copyright notice associated with the article.