
Abstract
Introduction
The concept of radiomics was first introduced in 2012 by the Dutch scholar Lambin. 1 It is characterized by its ability to transform medical images into quantitative data to generate biological information and perform correlation analysis and exploration with pathological diagnosis, disease classification, treatment response, clinical benefit, and survival rate. 2 The general workflow of radiomics can be summarized into five steps: image acquisition, image segmentation, feature extraction, feature screening, and model building and evaluation.1,3 With the development of computational hardware and machine learning algorithms, significant progress has been made in obtaining quantitative information from images and relating it to clinical features, and the concept of radiomics has been born. 4 Compared to traditional imaging, radiomics is a multi-disciplinary and multi-image technique. 3 Radiomics improves diagnosis and treatment accuracy by mining these quantitative features from medical images in a high-throughput manner and building models based on these features for use in systems supporting clinical diagnosis and treatment.5,6 Currently, radiomics has been widely used for the diagnosis and treatment of breast cancer, kidney cancer, lung cancer, liver cancer, and other diseases, showing promising potential and value.7–13
The study of radiomics is currently receiving increasing attention from researchers. However, the proliferation of publications in this area has made it more and more difficult for most researchers to stay abreast of new research. So far, only a few reviews or meta-analyses have summarized an aspect of radiomics, while important information has been omitted, such as the contributions of researchers and institutions, as well as future research hotspots and priorities.14–16 Bibliometric analysis has been widely used in the medical field as a method to analyze and visualize all literature published in each research area quantitatively and qualitatively.17–19 Therefore, to have a deeper understanding of the relevant content of radiomics, our study will summarize the information of the countries, institutions, and authors with the highest output through bibliometric analysis, and to analyze the overall knowledge structure of the literature based on radiomics from 2012 to 2022, to find the current research hotspots and empire-points. Help researchers who are about to or already engaged in radiomics research.
Methods
Database and Searching Strategy
This paper is based on Web of Science Core Collection (WoSCC), which is one of the most comprehensive and influential literature databases. WoSCC contains a large number of academic papers and research literature which has become the source of original data for literature research. This study retrieved all publications in radiomics from the WoSCC database and downloaded them on October 25, 2022. The literature search was carried out by two researchers separately to ensure the authenticity and stability of the search results. The search strategy is as follows: topic=(“radiomic$”), types are limited to articles, languages are limited to English. Among the various publication types, only original articles published in English are included. Of the literature retrieved, 1104 non-articles and 286 non-English language publications were excluded. Select the title of the literature, keywords, abstracts, publication journal name, publication year, author name, publication country, affiliation, etc export and save in TXT format (including the full text and cited literature) for further analysis. To avoid the impact of the WOS database update, all data searches and data downloads were conducted on October 25, 2022. Finally, a total of 6428 articles were included in the criteria.
Data Extraction and Analysis
Our research used software such as VOSviewer (version 1.6.18), CiteSpace (version 6.1.3), Tableau(version 2022), Microsoft Excel, and RStudio's free online platforms (http://bibliometric.com) for bibliometric analysis and visualization. VOSviewer is a widely used document analysis tool that provides three visual maps, namely network visualization, overlay visualization, and density visualization. 20 In our research, VOSviewer was used for co-occurrence analysis, including country/region, author and institution, author keywords, journals, and references. The size of the node indicates the number of publications, the thickness of the line indicates the strength of the relation, and the color of the node indicates the different clusters or time periods. CiteSpace is another data analysis and visualization software developed by Chen and others. 21 In contrast to the VOS viewer, CiteSpace focuses specifically on the connections between knowledge domains. In this paper, CiteSpace is used for co-citation analysis of authors and citations, as well as citation bursts of keywords or references. 22 The number of published papers at different stages also largely indicates the degree and trend of research in a certain field.
Results
Annual Growth Trend of Publications
A search of the WoSCC database yielded 6428 articles on radiomics published between 2012 and October 2022. As shown in Figure 1, the annual production has increased steadily since 2016 and will peak in 2021. The least number of articles were published in 2012, with an annual average of 495. Import the data into Microsoft Excel and insert the line chart. A statistically significant relationship was observed between the year and the number of publications by fitting the data (R2 = 0.9394). Based on the predicted curve, we estimate that the number of publications on radiomics will reach 2700 by the end of 2023.
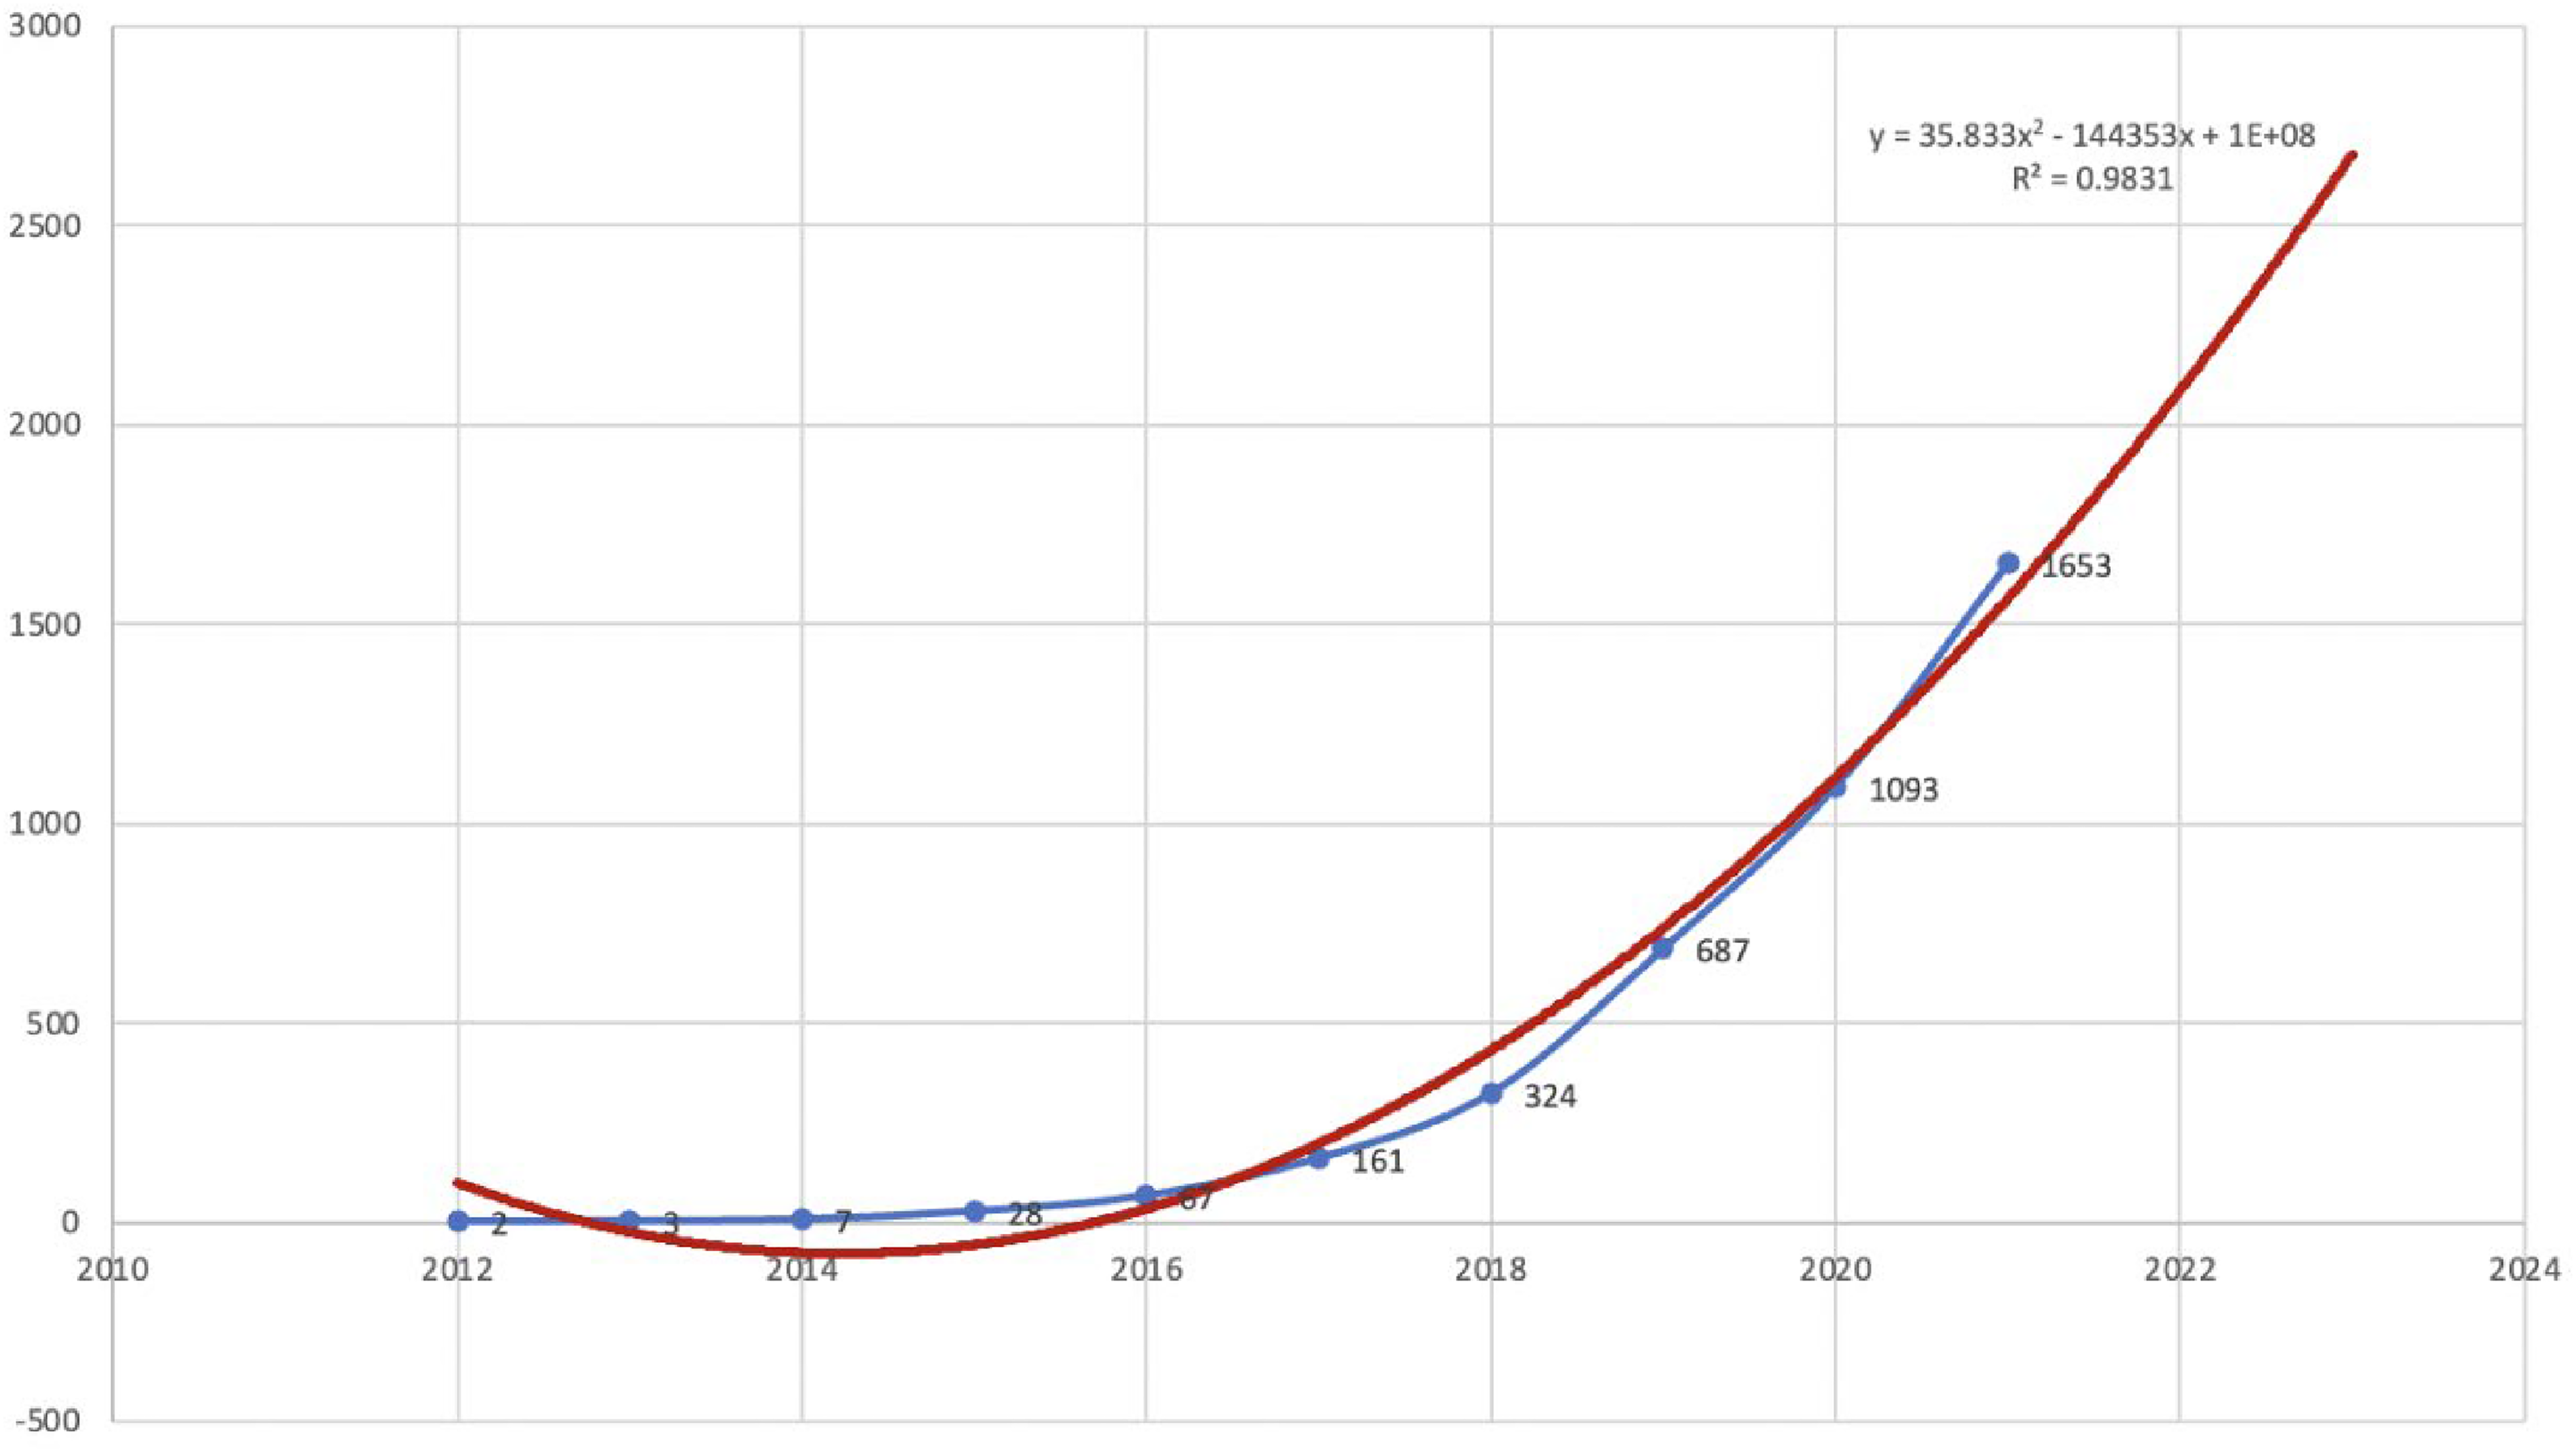
Polynomial curve fitting for radiomics publication growth.
Countries/Regions and Institutions Analysis
We imported all the saved txt files into VOSviewer (version 1.6.18) and analyzed a total of 6428 articles from 71 countries. The top 10 countries with the largest output are shown in Table 1. It is clear that China ranks first in this field with 2871 publications, far surpassing other countries. Then import the data into Tableau and simply adjust the automatically generated world map to get Figure 2(A). According to the map, we can see that the top three countries in terms of production are China, the United States, and Italy. However, the total number of citations in the United States reached 35,205, ranking first. Taken together, they prove that the United States is the most advanced country in the world in the field. In addition, as can be seen from the country cooperation map generated by VOSviewer (Figure 2(B)), it is observed that cooperation between many countries and regions, especially between China and the United States, Canada and Germany, is very close.

(A) Countries/ Regions distribution map. (B) Published map of country cooperation. (C) Publications of the top 10 institutions.
Top 10 Countries.

Install the “bibliometrix” package in RStudio and import all txt files into RStudio's free online platforms. A total of 4827 institutions participated in the publication of this literature, as shown in Figure 2(C), Fudan University of China ranked first, followed by Sun Yat-sen University, and the top six are all from China. Seven of the top 10 are Chinese institutions, accounting for a large proportion of the published literature. The others are Maastricht University in the Netherlands, the Sloan Kettering Cancer Center in the United States, and the University of Texas MD Anderson Cancer Center. Moreover, cooperation between institutions is more extensive than between countries. Fudan University has close cooperation with many Chinese universities and research institutes, the Chinese Academy of Sciences, and institutions in other countries such as the Netherlands and the United States.
Authors and Co-Cited Authors
More than 20,000 researchers are involved in radiomics research. We used “bibliometrix” package in RStudio to generate the top 10 author publications. Among them, Tian Jie (n = 180) is the author with the most published articles, followed by Liu Zhaoyu (n = 116) and Zhang Yang (n = 115). As shown in Figure 3(A), among them, Tian Jie published 62 articles in 2019, with an average of 783 citations per year, and 55 articles in 2020, with an average of 357 citations per year. We use VOSviewer to generate the co-authorship and citation networks between authors. A total of 24, 646 authors were selected, with the threshold set at 15 published articles, and 162 authors were selected for analysis. Figure 3(B, C) shows that Tian Jie, AERTS HJWL, and LAMBIN P are the key authors of multiple research clusters and play an important role in related fields of radiomics. At the same time, there is little collaboration and communication between different research clusters. There is a very close symbiotic relationship between authors and co-cited authors.

(A) The top 10 authors of the publication. (B) A network of co-authors. (C) A network of co-cited authors.
Journals and Co-Cited Academic Journals
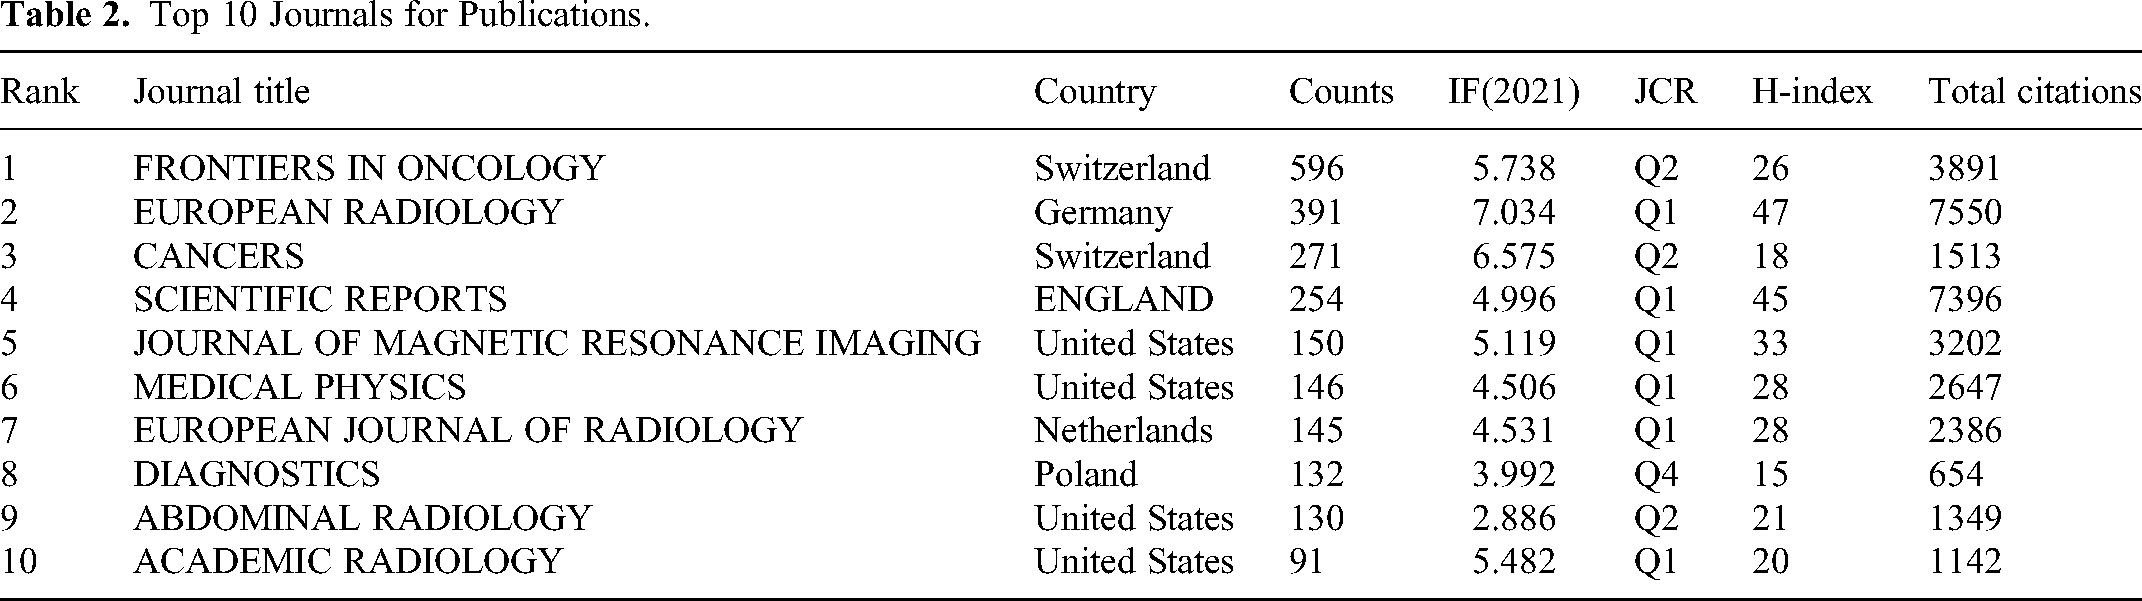
The “bibliometrix” package in RStudio is used to obtain journal results for all articles in the field of radiomics. A total of 749 academic journals have included articles related to radiomics. The results obtained are summarized in Table 2, about 36% of the publications were published in the top 10 journals. The journal with the most publications is 《FRONTIERS IN ONCOLOGY》 with a number of 596, IF of 5.738, H-index of 26 and total citations of 3891. This was followed by 《EUROPEAN RADIOLOGY》 with 391 publications, 7.034 IF, 47 H-index and 7550 total citations. It is worth noting that《DIAGNOSTICS》 also made the top 10 list, but with relatively low metrics. All top 10 journals had higher IF (defined as >3.00) except 《ABDOMINAL RADIOLOGY》. This suggests that 《ABDOMINAL RADIOLOGY》 should improve the magazine's impact and quality of future articles, as well as maintain the number of published articles. In all journals, a threshold of six articles was set and 147 journals were selected for analysis. As shown in Figure 4, there is also a forward reference relationship among the major magazines.

Citation analysis of journals.
Top 10 Journals for Publications.
Analysis of References and Co-Cited References
The research included 6428 papers, 150 of which were cited over 100 times. Table 3 lists the top 10 most-cited articles, among which the first article is “Radiomics: Images Are More than Pictures, They Are Data” published by Robert J. Gillies in 2015 has been cited a whopping 3366 times. Second on the list is “Decoding tumour phenotype by noninvasive imaging using a quantitative radiomics approach” by AERTS HJWL in 2014, it has been cited 2528 times. In third place is “Radiomics: extracting more information from medical images using advanced feature analysis” by LAMBIN P in 2012, it has been cited 2348 times. In VOSviewer, select the Co-citation: cited references analysis button. Then, we set the minimum number of citations to 80, and the results showed that 203 of the 121736 citations reached the threshold. As shown in Table 4 and Figure 5(A), the top three most-cited documents have 2,408, 1693 and 1653 citations, respectively. The data was imported into CiteSpace software and selected for references analysis. Figure 5(B) summarizes the top 25 references with the strongest citation bursts. The citation burst in this study began in 2014 due to the publication of the 2012 paper by Lambin P and continued until 2017. In 2014, Aerts HJWL 23 published a paper with the strongest strength, up to 241.79. In addition, other highly valued articles have been frequently cited in recent years,24–26 so it can be inferred that radiomics will remain a hot topic in the next few years.

(A) Co-citation analysis of cited references. (B) The top 25 references with the strongest citation bursts. (The years between “beginning” and “end” represent the more influential periods of reference. A light green year means the reference has not yet occurred, a dark green year means the reference has less influence, and a red year means the reference has more influence).
The top 10 Most-Cited Articles.

The top 10 Most co-Cited References.

Analysis of Keywords
We used VOSviewer for author keyword analysis and got a total of 7220 author keywords. We summarized the top 20 most frequent author keywords and made Figure 6(A) in Excel. The first three keywords are radiomics, machine learning and MRIs, which are all consistent with the content of our study. Using VOSviewer, set the minimum number of occurrences to 12,209 author keywords across all author keywords to reach the threshold. The overlay visualization map is automatically generated for the above 209 author keywords, as shown in Figure 6(B), with the keywords color-coded according to the chronological order in which they appear. As can be seen, radiomics is in the center of the visual map. MRI and CT is most popular by 2020. Since 2021, research hotspots in the field of radiomics have shifted to deep learning, nomogram, ultrasound,f-18-fdg, machine learning, covid-19, etc, indicating that research in these fields is currently booming.
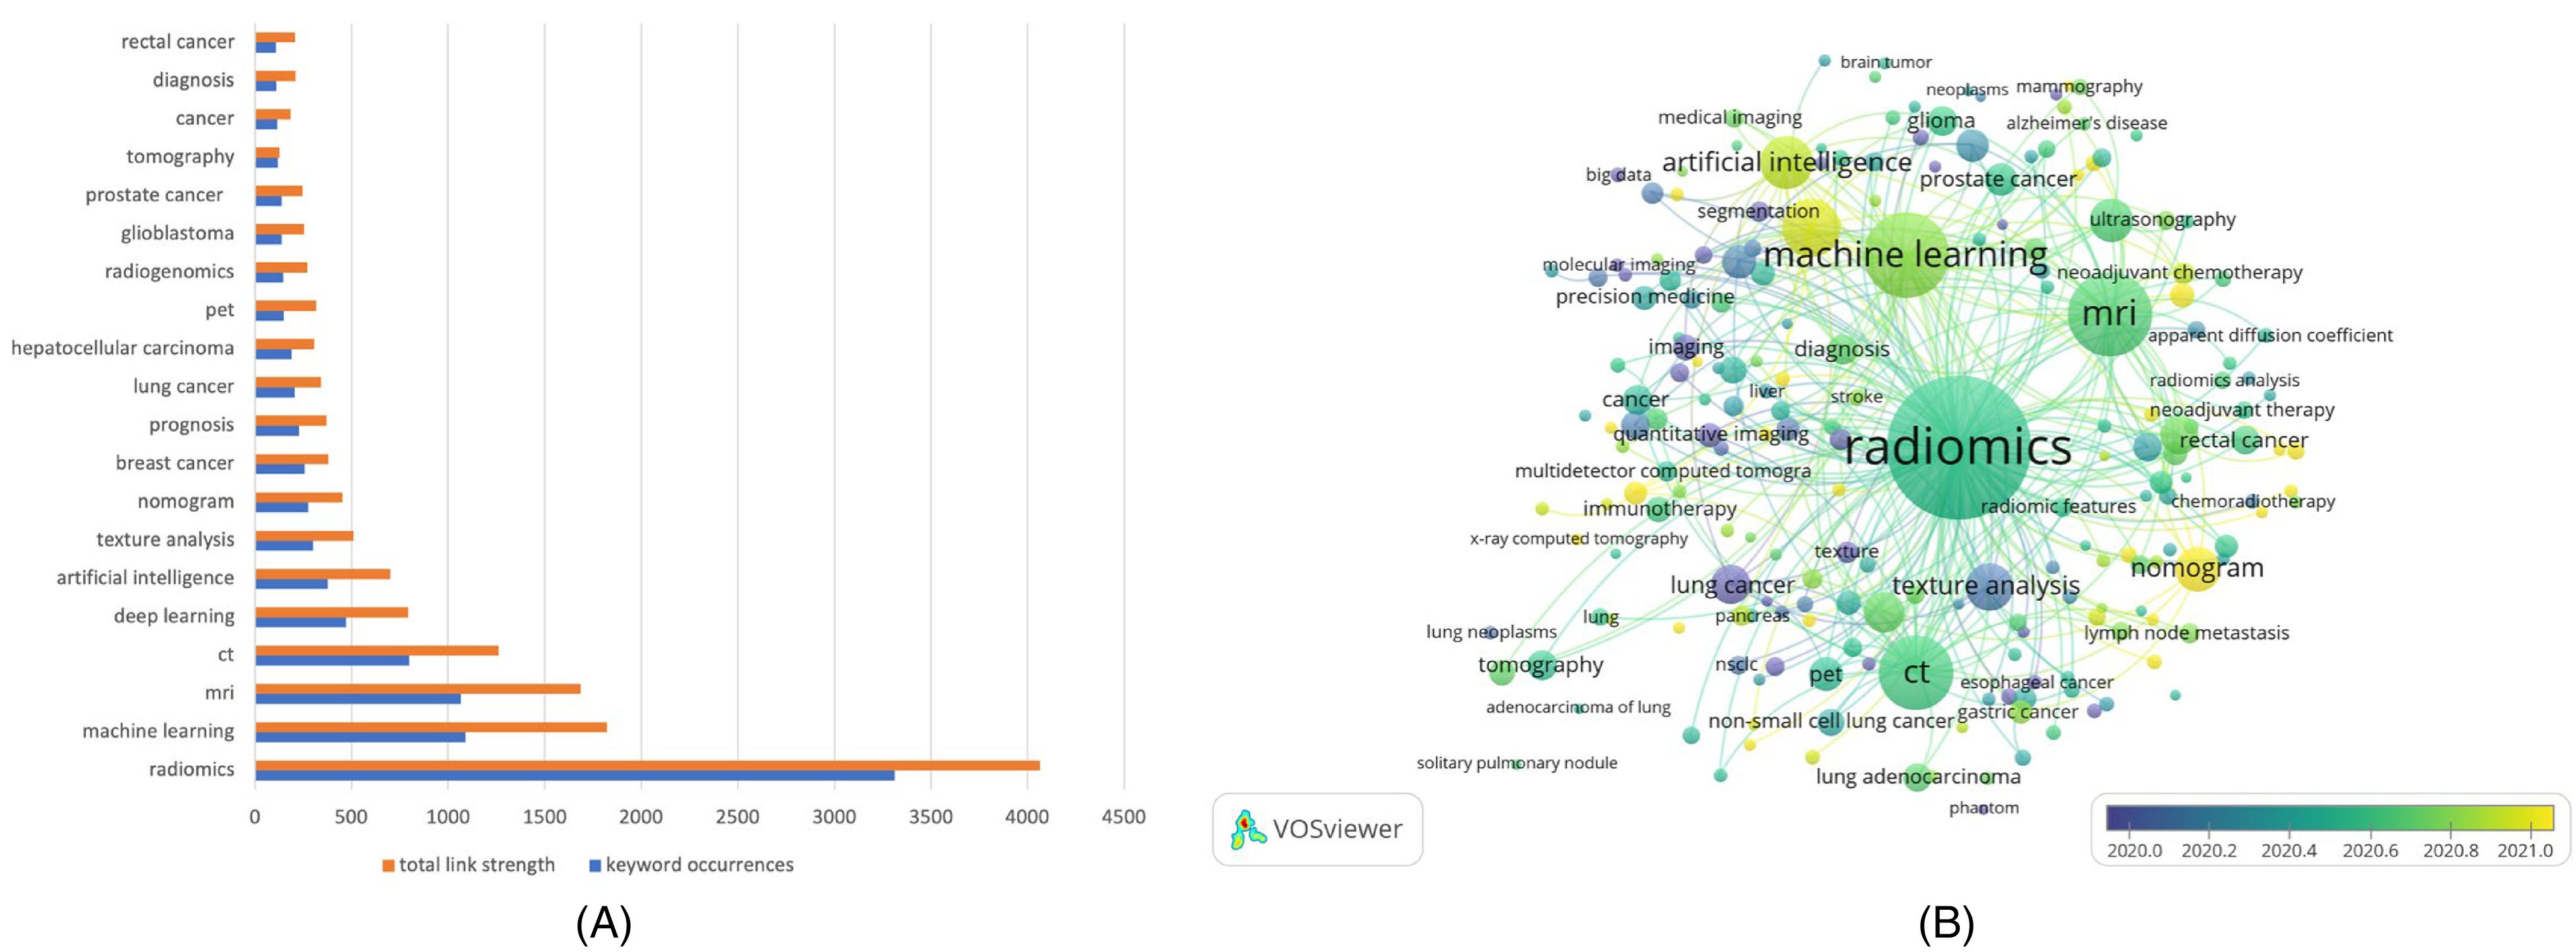
(A) Top 20 most frequently used keywords. (B) Keywords time network.
Discussion
In an age of exploding information, it's hard to stay sensitive to hot spots. Therefore, literature retrieval and knowledge updating are necessary tasks for researchers. Bibliometric analysis can reflect current research status and predict future research trends. In this study, 6428 radiomics-related articles published in the WOSCC database between 2012 and October 2022 were included, and various aspects such as number of documents, countries, institutions, authors, journals, citations, keywords, and literature contents were analyzed. This paper summarizes the application and development of radiomics through bibliometrics and visualization analysis. In this paper, we present the trends of radiomics in the world and forecast the hotspots in this area.
Currently, there are only a few works in the literature that comprehensively analyze the field of radiomics. Kocak et.al 27 published an article on research trends in artificial intelligence (AI) and radiomics last year. Although AI and radiomics are both new technologies in the field of medicine, scholars may use both in their research. However, according to the results obtained in this study, a large amount of space is expounding on the content related to AI, and the research related to radiomics is relatively light, which fails to comprehensively expound the development trend of radiomics from various aspects. In terms of the number and countries of publications in the field of radiomics, our study is generally consistent with the results of this study. At the same time, our research involves almost all aspects of the included radiomics-related literature, which can more accurately analyze the research trends and hot spots of radiomics. Another Stefania Volpe et al 28 studied the hot spots in the field of radiomics from 2012 to 2021, but their search strategy only included one word “radiomics” and ignored “radiomic.” In addition, this study only used “bibliometrix” package in RStudio to analyze data, which may have the problem of data analysis bias. Our study incorporates all data including “radiomics” and “radiomic” before October 25, 2022 and is more complete in content. In this paper, multiple software is used to analyze the data at the same time, and the results are more objective. Haoran Ding et al 29 have also done research on radiomics in oncology. Compared with this study, the aspects involved in our study are not limited to oncology, and the research hotspots of radiomics are comprehensively analyzed from various aspects.
The volume of research literature, to a certain extent, reflects the progress in this field.
Publications based on radiomics have been increasing between 2012 and 2022, especially in the last 7 years, thanks to the proposal and application of various new deep learning frameworks.30,31 The increasing trend in the number of publications and citation frequency of related studies on radiomics indicates that research in this area has gradually gained wider support and attention.32,33
The number of related articles published in China and the total number of citations in the United States, respectively, are among the highest in the world, making a great contribution to the development of the related field of radiomics. The map of the country's cooperation network shows that China has relatively close cooperation relations with the United States, Canada, and Germany. Closer exchanges between countries with higher academic standards have contributed to the publication of more and more valuable academic papers. Excellent research institutions are critical to the academic level of a country. 34 China has seven of the top 10 institutions in terms of publication volume, and the close cooperation between these institutions has resulted in a large amount of scientific research output in the field of radiomics in China. It is necessary for academic institutions in every country to enhance their academic standing. In the future, agencies should pay more attention to international cross-border cooperation.
In the bibliometric analysis of authors, Tian Jie is the first author with a high number of publications, followed by Liu Zhaoyu and Zhang Yang, who have published a total of 311 articles. Hugo J.W.L. Aerts, Director of the Medical Artificial Intelligence (AIM) Initiative at Harvard Medical School, is a leader in the field of medical AI and leader of major research initiatives supported by NIH. 35 We find that Tian, AERTS, HJWL, and LAMBIN P are key authors in linking multiple research clusters, which explains their high citation rates and their importance in the related field of radiomics. Teams of these scholars can lead to more comprehensive and in-depth research, and their academic sharing will also encourage more researchers to commit to the field.
Academic journals are one of the symbols that reflect the value of research content, and it provides rich and reliable information to the researchers when they are searching for literature. 36 Apart from the number of publications, IF, JCR partition, H-index, and total citations are also important indicators to assess the academic status of a journal 20. The journals listed in Table cover mainly medical imaging and oncology. Most papers in this field have been considered for publication in the above journals. It can be found that most of the top 10 journals are in Q1 or Q2. As these journals are professional journals with high visibility and influence, it is easier for the academic community to publicize their views in the field of science and provide a platform for discussion and exchange with their peers, thus furthering their academic level and scientific research capabilities. In addition, journals have relatively short review periods. As a result, researchers are more willing to submit articles to them. Given the volume and quality of research, these journals are likely to be the main publishing channels for future research in this field.
Citation frequency and co-citation frequency of citations are important metrics to assess the social status and academic impact of academic papers in bibliometrics. The more frequently a document is cited, the more attention it receives and the greater its academic impact. 37 The number 1 article describes the radiomics process, its challenges, and its potential power to facilitate better clinical decision-making, especially in the care of cancer patients. Its research value has also been widely recognized by researchers. All of these studies have been intensively explored in the early stages of the development of the field of radiomics and thus have been widely cited. In addition, other highly cited literature has laid the foundation for subsequent related studies and is of significant reference value. These studies represent the mainstream direction of radiomics research in recent years, facilitate researchers to carry out and grasp research, and show that these documents have a driving effect on radiomics. Burst detection is a method used to calculate the sharp increase in popularity of a reference or keyword over a particular period, which can effectively identify hotspots or topics. 38 Our strongest citation burst indicates that the first citations in this field started in 2012 and will continue until 2020. This set the stage for a series of follow-up studies. Our results show that most of the surge in citations continues, with the most recent beginning in 2018 and resulting from multiple studies. Among them, the strongest intensity value was a study published in the 《European Journal of Cancer》 in 2012 by LAMBIN P et al His research team is committed to mining as much meaningful information as possible in the initial stages of the development of radiomics and has achieved good results, laying a certain foundation for future development of radiomics.
Keywords highly summarize the core content of the paper and are also the most important part of bibliometrics analysis. Research hotspots and frontiers in the field can be visually presented through keyword analysis of the vast literature in the related fields. 39 In the co-occurrence graph of high-frequency subject words, the nodes are larger and have more occurrences, the lines between nodes represent the relationship between high-frequency subject words, and the thicker the line, the stronger the relationship, and vice versa. The analysis of high-frequency keywords and keyword co-occurrences shows that the current hot topics in radiomics are mainly focused on nomogram, machine learning, deep learning, AI, ultrasound, F-18-FDG, covid-19, radiogenomics, and other aspects.40–44 These hotspots are scattered around the distribution of lung, kidney, stomach, brain tumors, lymph node metastases, and other related oncological diseases. The results demonstrate the wide range of applications of radiomics in various neoplastic disease systems.45–48
With the development of science and technology, new technologies such as machine learning and deep learning have emerged accordingly, and it has become a trend to use radiomics to improve the diagnostic level of diseases. With the further development of AI and the promotion of deep learning algorithms, convolutional neural networks have become an indispensable algorithm for processing and analyzing medical images, especially radiological images.49–52 However, current AI is mostly based on deep learning and lacks superior interpretability, which is questioned by some clinicians, which hinders the practical application of AI models in clinical practice. Therefore, developing explainable deep learning algorithms is the key to make this AI better applied in clinical practice.
The focus of radiomics has shifted from MRI and CT to ultrasound and nuclear medicine. Radiomics in ultrasound and nuclear medicine has also become an emerging research direction in the medical field. Compared with large medical examination equipment, ultrasound has the characteristics of convenience, non-radiation, repeatable operation, and the development of its radiomics is an inevitable choice. The development of radiomics in the field of nuclear medicine provides a new way to improve the diagnosis rate and comprehensive evaluation of tumors, while reducing the number of invasive procedures for patients. All of the above indicate that the development of radiomics has brought new opportunities for clinical practice and technological advances, contributing to the improvement of medical care and the quality of life of patients.
Due to the COVID-19 outbreak around the world in 2019, the application of radiomics in COVID-19 has also risen. Due to the COVID-19 outbreak around the world in 2019, the application of radiomics in COVID-19 has also risen. By analyzing the lung CT images of COVID-19 patients, radiomics can extract imaging features related to the disease, evaluate the scope, severity, therapeutic effect and distribution of the lesions, and provide objective indicators for clinicians to evaluate the condition, and provide a basis for the next treatment plan. Through the analysis of a large number of imaging data of COVID-19 patients, the epidemiological characteristics and transmission rules of the disease can be revealed, providing references for public health decision-making. Radiomics can provide new methods and ideas for clinical studies of COVID-19 and help researchers better understand the pathogenesis, progression, and outcome of the disease.
In the era of rapid medical development, we try to improve our understanding of diseases based on differences in clinical, imaging, pathological, and other manifestations. Precision medicine, imaging first, so we have higher expectations for the field of radiomics. The days of diagnosing diseases by radiographic imaging alone are over. Many papers indicate that multi-modality fusion techniques, such as radiomics, genomics, and proteomics, will be an important development trend in the future.53–56
To sum up, the development of radiomics has improved the entire medical system in many ways. In terms of clinical practice, traditional imaging diagnosis mainly relies on the subjective experience of doctors. Through quantitative analysis of medical images, radiomics can provide more disease-related information, reduce the subjectivity of diagnosis, help doctors more accurately diagnose diseases, evaluate treatment effects, and predict the prognosis of diseases. In terms of healthcare policy, with radiomics technology, doctors can reduce the occurrence of misdiagnosis and missed diagnosis, improve medical efficiency and quality, help doctors better formulate treatment plans and drug dosages, reduce unnecessary medical intervention and drug use, and thus reduce medical costs. At the same time, doctors can better understand the distribution and prevalence of diseases, to formulate more reasonable medical resource allocation policies and improve the utilization efficiency of medical resources. In addition, radiomics can provide healthcare policymakers with information about disease burden, treatment effectiveness, and healthcare costs, thereby supporting them in making more scientific and rational healthcare policies. In terms of technological progress, the development of radiomics has promoted the innovation of medical imaging technology, such as the development of more efficient image analysis algorithms and the improvement of image quality. At the same time, radiomics can provide new biomarkers and research methods for clinical research, help to deeply understand the occurrence and development mechanism of diseases, and provide a basis for the development of new drugs and the improvement of treatment methods.
Conclusion
Our results show that radiomics has become a hot research topic in the last decade and is still growing rapidly. It will soon be widely available for clinical diagnosis. The key focus of future radiomics research is on the interpretation of deep learning models, as well as the development of multimodal fusion models.
Limitations
Although this study provides a relatively comprehensive and objective bibliometric analysis, there are some limitations. First, we only looked at the literature in the WOSCC database. As a result, not all publications are included, and metrics such as publication volume and citations may be underestimated. Second, the analysis based on WOSCC database ignored non-English literature, and the conclusions may be biased. Finally, we only analyzed literature published in the first 10 months of 2022, and some recently published articles will be underestimated due to their low frequency of citations in the short time after publication. Over time, the addition of new literature may change the original data of the bibliometric data, leading to different conclusions.
Footnotes
Acknowledgements
This work was supported by Liaoning Natural Science Foundation: 2022-YGJC-52.
Contributions
Conception and design: Liang Sang; administrative support: Liang Sang and Xuemei Wang; provision of study materials or patients: Liang Sang and Xuemei Wang; collection and assembly of data: Minghui Zhang, Yan Wang, and Mutian Lv; data analysis and interpretation: Minghui Zhang, Yan Wang, and Mutian Lv; manuscript writing: all authors; final approval of manuscript: All authors.
Declaration of Conflicting Interests
The authors declared no potential conflicts of interest with respect to the research, authorship, and/or publication of this article.
Ethical Approval
Institutional Review Board approval was not required because the subjects were not humans.
Funding
The authors disclosed receipt of the following financial support for the research, authorship, and/or publication of this article: This work was supported by the Natural Science Foundation of Liaoning Province, (grant number 2022-YGJC-52).
Reporting Checklist
The authors have completed the PRISMA 2020 Checklist.