
Abstract
Keywords
Introduction
Cancer is one of the major public health crises at present, claiming more than 10 million lives with 19.3 million new incidences in 2020. 1 Increasing numbers of people are being diagnosed with cancer every day, and by 2040, global cancer-related deaths are estimated to touch 28 million. 1 Compared to developed countries, the status of cancer in developing countries may be more serious. Several genetic, epigenetic, and environmental risk factors contribute to cancer, including poor diet, lack of regular physical activity, smoking, use of oral contraceptives, exposure to ultraviolet radiation, and hormonal imbalance. 2 Because of the increasing frequency of cell divisions in mammals, there is an increased likelihood of genetic anomalies that also contribute to malignancy.3,4
Tumor necrosis factor-α induced protein 8 (TNFAIP8/TIPE) is a potent suppressor of TNF-α-mediated apoptosis, which is activated by nuclear factor kappa B (NF-κB). 5 TNFAIP8 is a protein family with four known members that convey high degrees of sequence homology and are critical regulators of immunological homeostasis, inflammation, cancer development, proliferation, and cell death. Moreover, its expression is elevated in numerous types of cancers. It has been found that the messenger RNA (mRNA) and protein for TNFAIP8 are highly concentrated in a wide variety of malignancies such as bladder, blood, bone, breast, cervix, colon, esophagus, endometrium, stomach, liver, lung, ovary, pancreas, prostate, and thyroid glands. 6
Among the members, TNFAIP8 is the first discovered protein of this family, which is thought to be correlated with tumorigenesis. Oncogenesis has been linked to the TNFAIP8 death effector domain, which is capable of inhibiting caspase-mediated apoptosis. Moreover, TNF-α-induced caspase activation and apoptosis are inhibited by the TNFAIP8. Three single nucleotide polymorphisms (SNPs), including rs11064, rs1045241, and rs1045242 of the TNFAIP8 gene, are present in the 3′-untranslated region (3′-UTR) region, which act as a binding site for microRNAs (miRNAs) to regulate gene expression, whereas rs3813308 C > G variant resides in the 5′-flanking region of the TNFAIP8 gene.
The signaling molecule tumor necrosis factor, alpha-induced protein 8 like 1 (TNFAIP8L1), a TNFAIP8 gene family member, has antiapoptotic and prooncogenic properties, which are critical in developing tumors and the immune system's ability to fight cancer. The variant rs1060555 is localized in the 3′-UTR of the TNFAIP8L1 gene on chromosome 19. 7 Moreover, it is a vital polymorphism for developing various gynecological cancers, including breast and cervical cancers.8–11
Chromosome 14q32 contains the tumor necrosis factor, alpha-induced protein 2 (TNFAIP2) gene, which encodes 654 amino acid residues, and more than 13,000 nucleotides of TNFAIP2 are encoded by its 11 exons and 10 intergenic regions. 12 TNF-α induces human endothelial cells to produce more of the TNFAIP2 gene, a consequential responder to the B94 protein. 13 When TNFAIP2 was coimmunoprecipitated with actin, it was found to be involved in producing actin-based protrusions in nasopharyngeal carcinoma-TW02 cells.14,15 SNP rs8126 T > C was found to be located in the miR-184 binding region and rs710100 G > A was found to be located in the miR-155 binding area of the TNFAIP2 gene, and studies showed that human cancer risk could be linked to these SNPs.13,16
One of the most effective methods of reducing cancer burden is early identification and treatment, tobacco and alcohol management, vaccination injection, and a balanced diet of fruits and vegetables. 17 A few studies have looked at the relationship between TNFAIP8 (rs11064, rs1045241, rs1045242, and rs3813308), TNFAIP8L1 (rs1060555), and TNFAIP2 (rs710100 and rs8126) gene polymorphisms and cancer risk. However, these results were ambiguous and conflicting. This meta-analysis aimed to determine whether or not these variants are associated with the risk of cancer.
Methods and Materials
The present meta-analysis was performed following the updated guidelines of the Preferred Reporting Items for Systematic Reviews and Meta-analyses (PRISMA) 2020. 18 We have also registered the meta-analysis at the International Platform for Registration of Systematic Review and Meta-analysis Protocols (INPLASY; available at https://inplasy.com/, registration number: INPLASY202270073).
Literature Search Strategy
PubMed, Science Direct, Google Scholar, EMBASE, and CNKI databases were explored for related articles using designated key phrases spanning from January 2022 to April 2022. Key phrases include: “cancer,” “TNFAIP8,” “TNFAIP8L1,” “TNFAIP2,” “TNFAIP2 polymorphisms and cancer,” “TNFAIP8L1 polymorphisms and cancer,” “TNFAIP8 polymorphisms and cancer,” “rs11064 and cancer,” “rs1045241 and cancer,” “rs1045242 and cancer,” “rs3813308 and cancer,” “rs1060555 and cancer,” “rs710100 and cancer,” and “rs8126 and cancer.” There was no language restriction for including the studies.
Selecting Literature and Assessing Eligibility
Two authors (KKB and MAB) searched and selected publications from databases and conducted an extensive assessment of titles, abstracts, and full-text of articles to determine their eligibility for inclusion in a meta-analysis. The PRISMA flow diagram depicts the entire procedure of study selection (Figure 1). Another 2 authors (MAA and MSI) solved any disputes concerning the literature selection.

Preferred Reporting Items for Systematic Reviews and Meta-analyses (PRISMA) flow diagram of the study selection process.
Only the studies that investigated TNFAIP8 (rs11064, rs1045241, and rs1045242), TNFAIP8L1 (rs1060555), and TNFAIP2 (rs710100, rs8126) gene polymorphisms and cancer risk were included. To corroborate the association, every study must provide information on one of the specified SNPs. Furthermore, studies must contain genotypic and allelic frequencies of both cases and controls and an odds ratio (OR) with 95% confidence intervals (CIs) and p-value for inclusion.
Studies without the selected polymorphism of TNFAIP8, TNFAIP8L1, or TNFAIP2 genes were excluded from this study because they were deemed ineligible. Studies that lacked or had incomplete data on a control population were omitted from this meta-analysis. Furthermore, review articles, letters, and correspondents were also excluded.
Extracting Data and Assessing Methodological Standard
Study ID, publication year, country, ethnicity, cancer type, genotyping technique, sample size (cases and controls), as well as genotypic data for selected SNPs were collected for each study. The Newcastle–Ottawa Scale (NOS) standard and the Jadad scale were employed to assess specified observational cohort studies 19 and determine sampling accuracy in controlled trials with randomization. 20
Statistical Analysis, Trial Sequential Analysis, and In-Silico Analysis
Review Manager software (RevMan version 5.4) was employed for all statistical analyses. The association of genetic polymorphisms and cancer risk was estimated using 7 distinct genotypic models, including the codominant 1-3 models (COD1, COD2, and COD3), dominant model (DM), overdominant model (ODM), recessive model (RM), and the allele model (AM). The χ2-based I2-statistic and Q-test were performed to determine whether there was any possible heterogeneity. If the p-value is low (p < .1) or I2 is >50%, the Q-test shows considerable heterogeneity. The sensitivity analysis was conducted by excluding the studies one by one. By constructing funnel plots, we determined if there was any publication bias. The publication bias was determined using Begg–Mazumdar's test and Egger’s regression test. The random effects model was used for pooled OR estimation. When the p-value is <.05, the association was considered statistically significant. Bonferroni correction was also conducted for the p-values, and a p-value of <.007 is considered statistically significant. Moreover, we performed trial sequential analysis (TSA) to evaluate whether the case number is enough to produce a significant outcome 21 and analyzed the levels of mRNA expression 22 of the included polymorphisms by applying the Genotype-Tissue Expression (GTEx, release v7 and human genome build 37) portal (https://gtexportal.org/home/). We constructed violin plots to visualize the gene expression.
Results
Characteristics of the Included Articles
Overall, 6909 cancer patients and 7087 controls from 14 studies were enrolled in this study. Four studies presented genotypic data of both rs1106411,23–25 and rs1045241,23,24,26,27 whereas 2 studies provided genotypic data of rs104524223, 24 and rs3813308.11,25 Three, 6, and 5 studies provided genotypic information on the rs1060555,7,11,25 rs710100,12,14,25,28–30 and rs8126,12,14,28,31,32 respectively (Table 1). The studies were on 9 cancers, the most common of which is cervical cancer, with 3034 patients, and the least common is ovarian cancer, with just 210 cancer patients. A total of 1077 cases of head and neck squamous cell carcinoma have been reported, while 978 cases have been identified in terms of gastric cancer. Others were esophageal cancer, non-Hodgkin lymphoma, endometrial cancer, colorectal cancer, and diffuse large B-cell lymphoma which accounted for 588, 514, 226, 212, and 114 cases, respectively. According to the quality assessment by NOS, the maximum included studies scored ≥6 (high quality) (Table S1).
Characteristics of Included Studies for the Meta-Analysis of the Association of TNFAIP8 (rs11064, rs1045241, rs1045242, and rs3813308), TNFAIP8L1 rs1060555, and TNFAIP2 (rs710100 and rs8126) Polymorphisms with Cancer Risk

Abbreviations: CC, cervical cancer; CRC, colorectal cancer; DLBCL, diffuse large B-cell lymphoma; EC, endometrial cancer; ESCC, esophageal cancer; GC, gastric cancer; HNSCC, head and neck squamous cell carcinoma; NHL, non-Hodgkin lymphoma; OC, ovarian cancer; PCR-RFLP, polymerase chain reaction-restriction fragment length polymorphism.
Association of TNFAIP8 Polymorphisms with Cancer
Four studies evaluated the association of rs11064 polymorphism with cancer risk. For this polymorphism, 4 different genetic models such as COD2 (GG vs AA: OR = 2.30, 95% CI = 1.52–3.47, p = 7.83 × 10⁻⁵), COD3 (GG vs GA: OR = 2.10, 95% CI = 1.37–3.22, p = .0006), RM (GG vs GA + AA: OR = 2.24, 95% CI = 1.48–3.37, p = .0001), and AM (G vs A: OR = 1.47, 95% CI = 1.03–2.12, p = .037) significantly increased the probability of developing cancer. The p-values of the COD2, COD3, and RM remained significant after the Bonferroni correction. The COD1 and ODM failed to demonstrate a statistically significant link with cancer (p > .05; Table 2 and Figure 2). For rs1045241, 2 genetic models, COD1 (TC vs CC: OR = 1.27, 95% CI = 1.06–1.5, p = .009) and ODM (TC vs TT + CC: OR = 1.24, 95% CI = 1.04–1.48, p = .018) showed a significant correlation with cancer (Table 2 and Figure 3).

Forest plot for the meta-analysis of the association of TNFAIP8 rs11064 polymorphism with cancer risk.

Forest plot for the meta-analysis of the association of TNFAIP8 rs1045241 polymorphism with cancer risk.
Meta-Analysis of the Association of TNFAIP8 (rs11064, rs1045241, rs1045242, and rs3813308), TNFAIP8L1 rs1060555, and TNFAIP2 (rs710100 and rs8126) Polymorphisms with Cancer Risk.

Abbreviations: OR, odds ratio; 95% CI, 95% confidence interval. Bold values indicate statistically significant (p < .05).
*Indicates significant after Bonferroni correction.
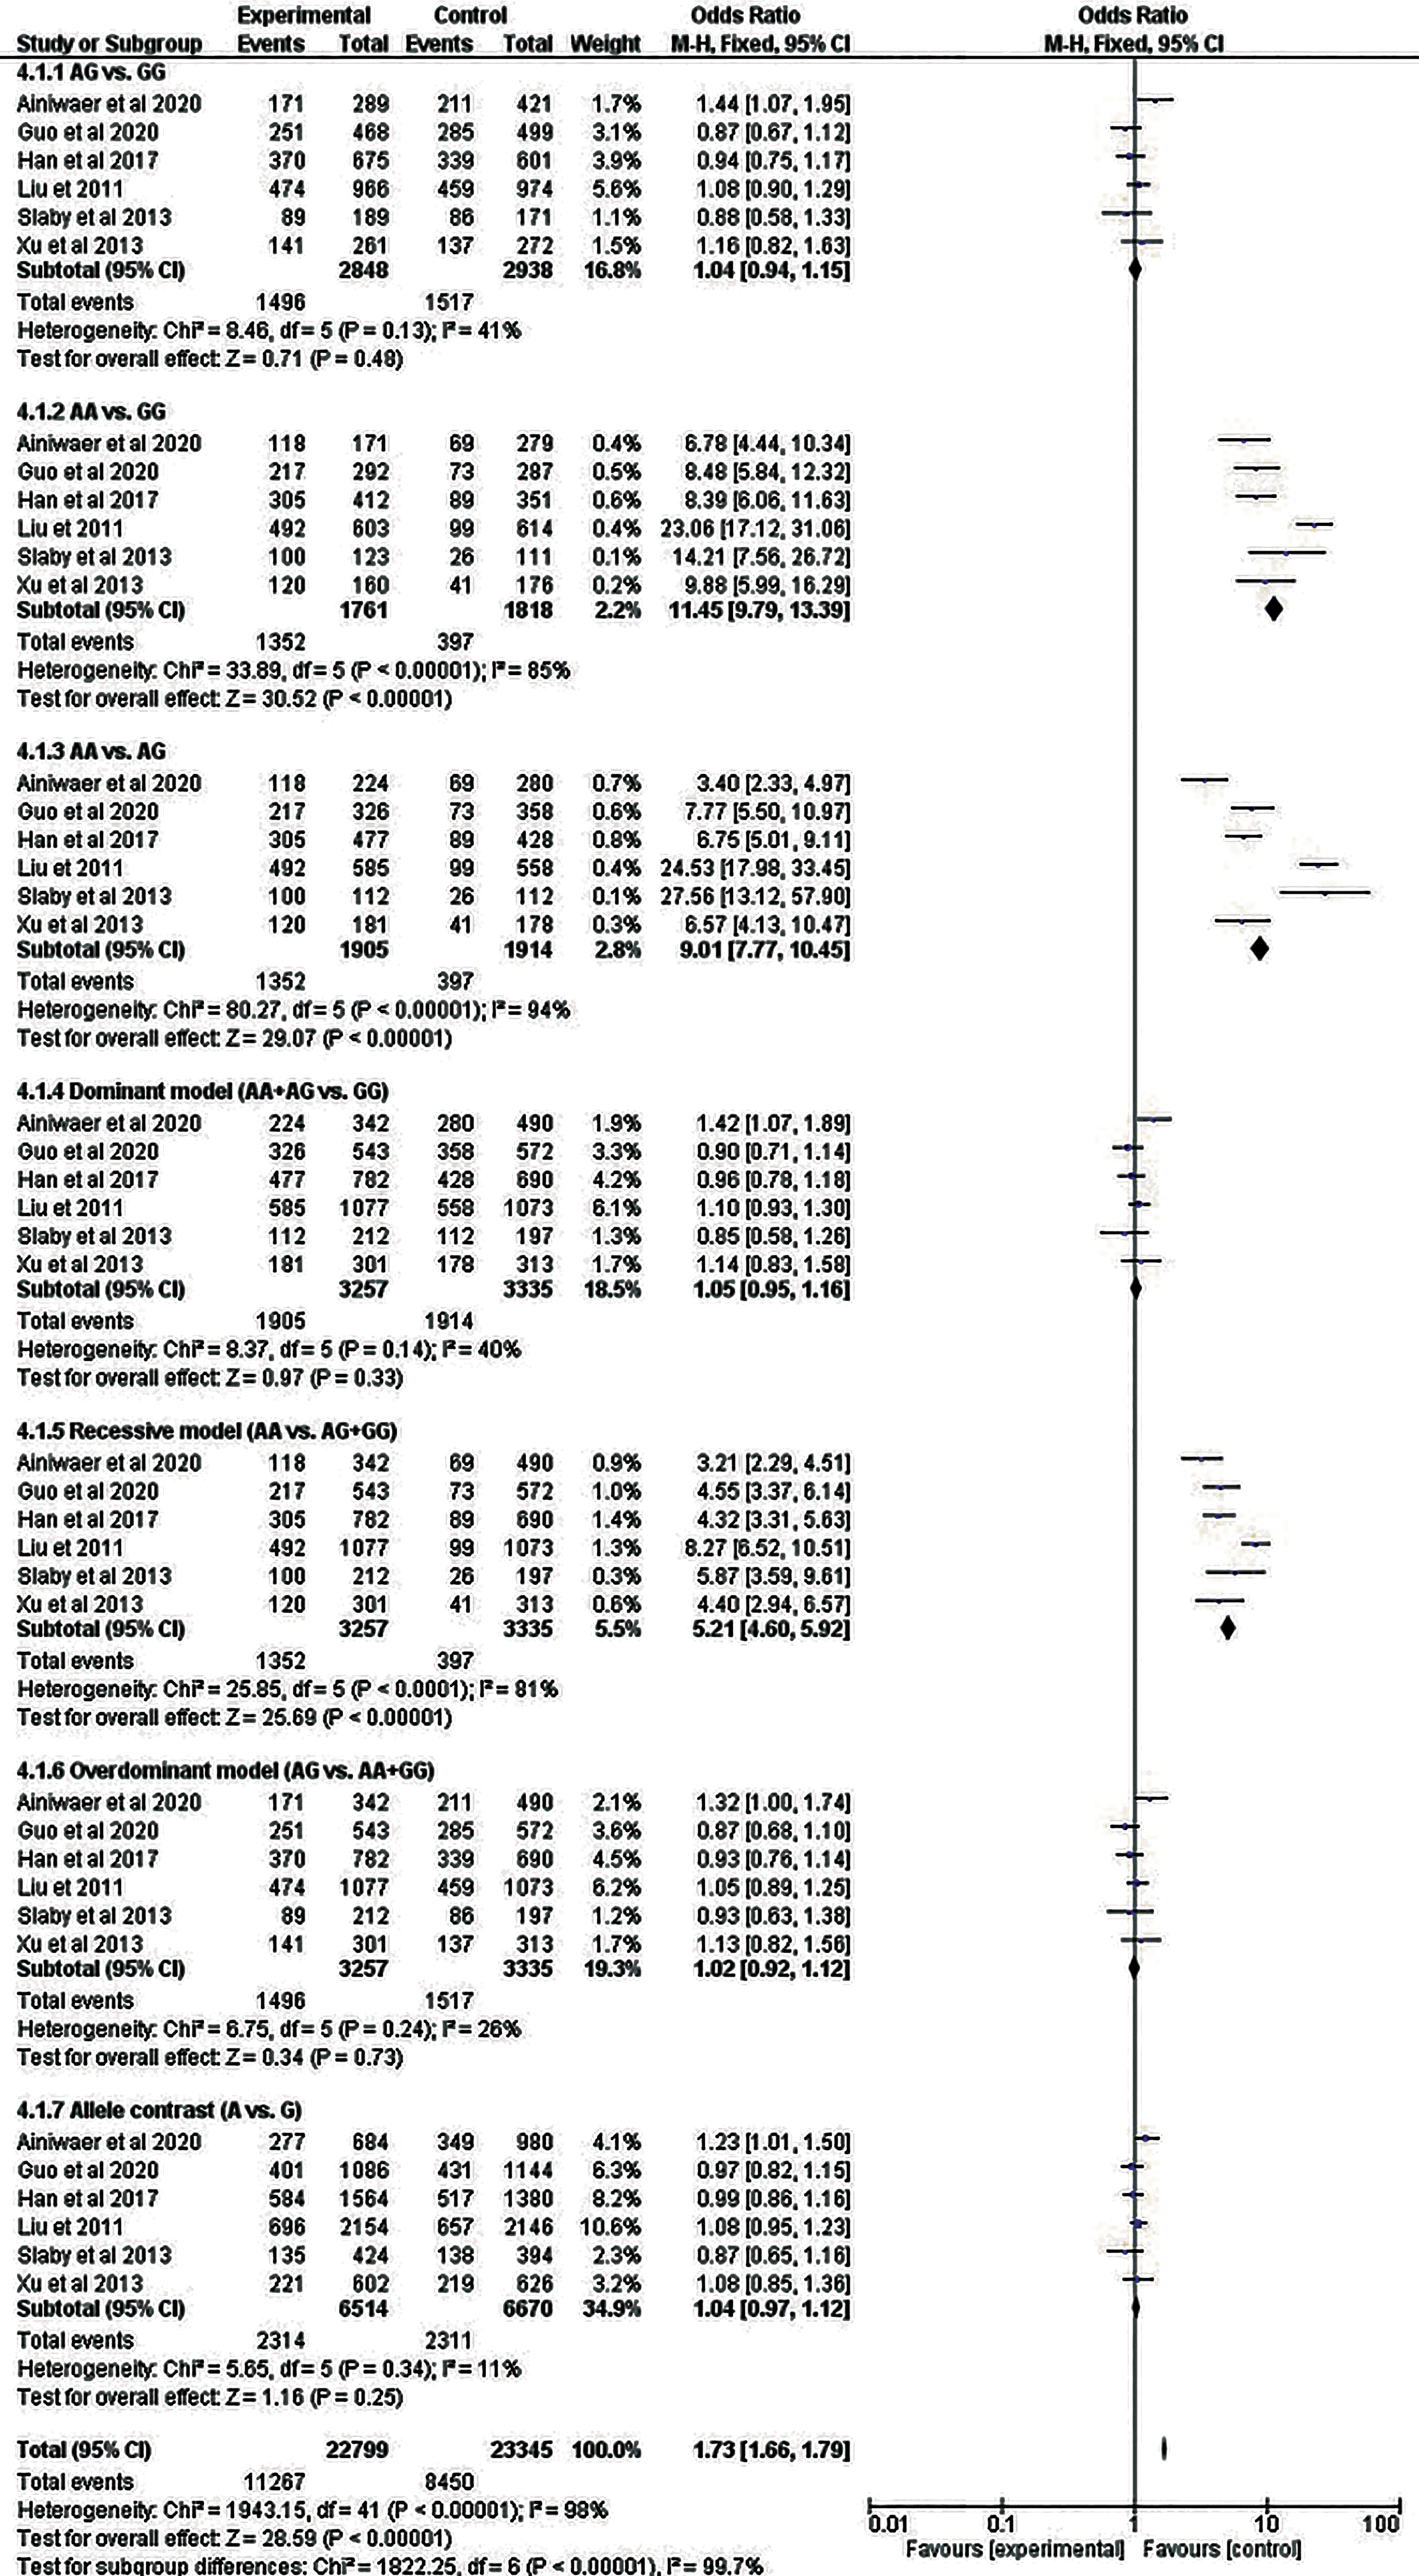
The TNFAIP8 rs1045242 polymorphism was investigated in ovarian and esophageal cancer in 2 separate studies on the Asian population that included 436 cancer patients and 479 controls (Table 1). Four distinct genetic models, including COD1, DM, ODM, and AM (GA vs AA: OR = 1.52, 95% CI = 1.14–2.03, p = .005; GG + GA vs AA: OR = 1.56, 95% CI = 1.18–2.07, p = .002; GA vs GG + AA: OR = 1.48, 95% CI = 1.11–1.98, p = .008; G vs A: OR = 1.48, 95% CI = 1.16–1.90, p = .002) showed a significant association with cancer, respectively, and the associations remained significant even after Bonferroni correction except the ODM (Table 2 and Figure 4). SNP rs3813308 was analyzed by 2 studies on Asian women with cervical cancer, with 2350 patients and 2070 controls. This SNP did not demonstrate any significant correlation with cancer in any genetic models (Table 2 and Figure 5).

Forest plot for the meta-analysis of the association of TNFAIP8 rs1045242 polymorphism with cancer risk.

Forest plot for the meta-analysis of the association of TNFAIP8 rs3813308 polymorphism with cancer risk.
Association of TNFAIP8L1 Polymorphism with Cancer
For this SNP, 3 studies involving 2692 Asian cervical cancer patients and 2568 controls were included. Only 1 genetic model, COD2, depicted a significantly protective effect against cancer (GG vs CC: OR = 0.80, 95% CI = 0.63–1.0, p = .048; as shown in Table 2 and Figure 6).

Forest plot for the meta-analysis of the association of TNFAIP8L1 rs1060555 polymorphism with cancer risk.
Association of TNFAIP2 Polymorphisms with Cancer
Six studies with 4 different cancers were included in the meta-analysis of rs710100. However, none of the genetic models demonstrated a statistically significant connection of rs710100 with cancer. For rs8126, 3 models—COD2 (CC vs TT: OR = 1.41, 95% CI = 1.16–1.71, p = .0005), COD3 (CC vs CT: OR = 1.44, 95% CI = 1.19–1.75, p = .0002), and RM (CC vs CT + TT: OR = 1.44, 95% CI = 1.19–1.72, p = .0001) revealed a statistically significant association with cancer. All of the associations were found to be significant after the Bonferroni correction (Table 2). Forest plots regarding the association of TNFAIP2 rs710100 and rs8126 gene polymorphisms with cancer risk are presented in Figures 7 and 8, respectively.
Forest plot for the meta-analysis of the association of TNFAIP2 rs710100 polymorphism with cancer risk.
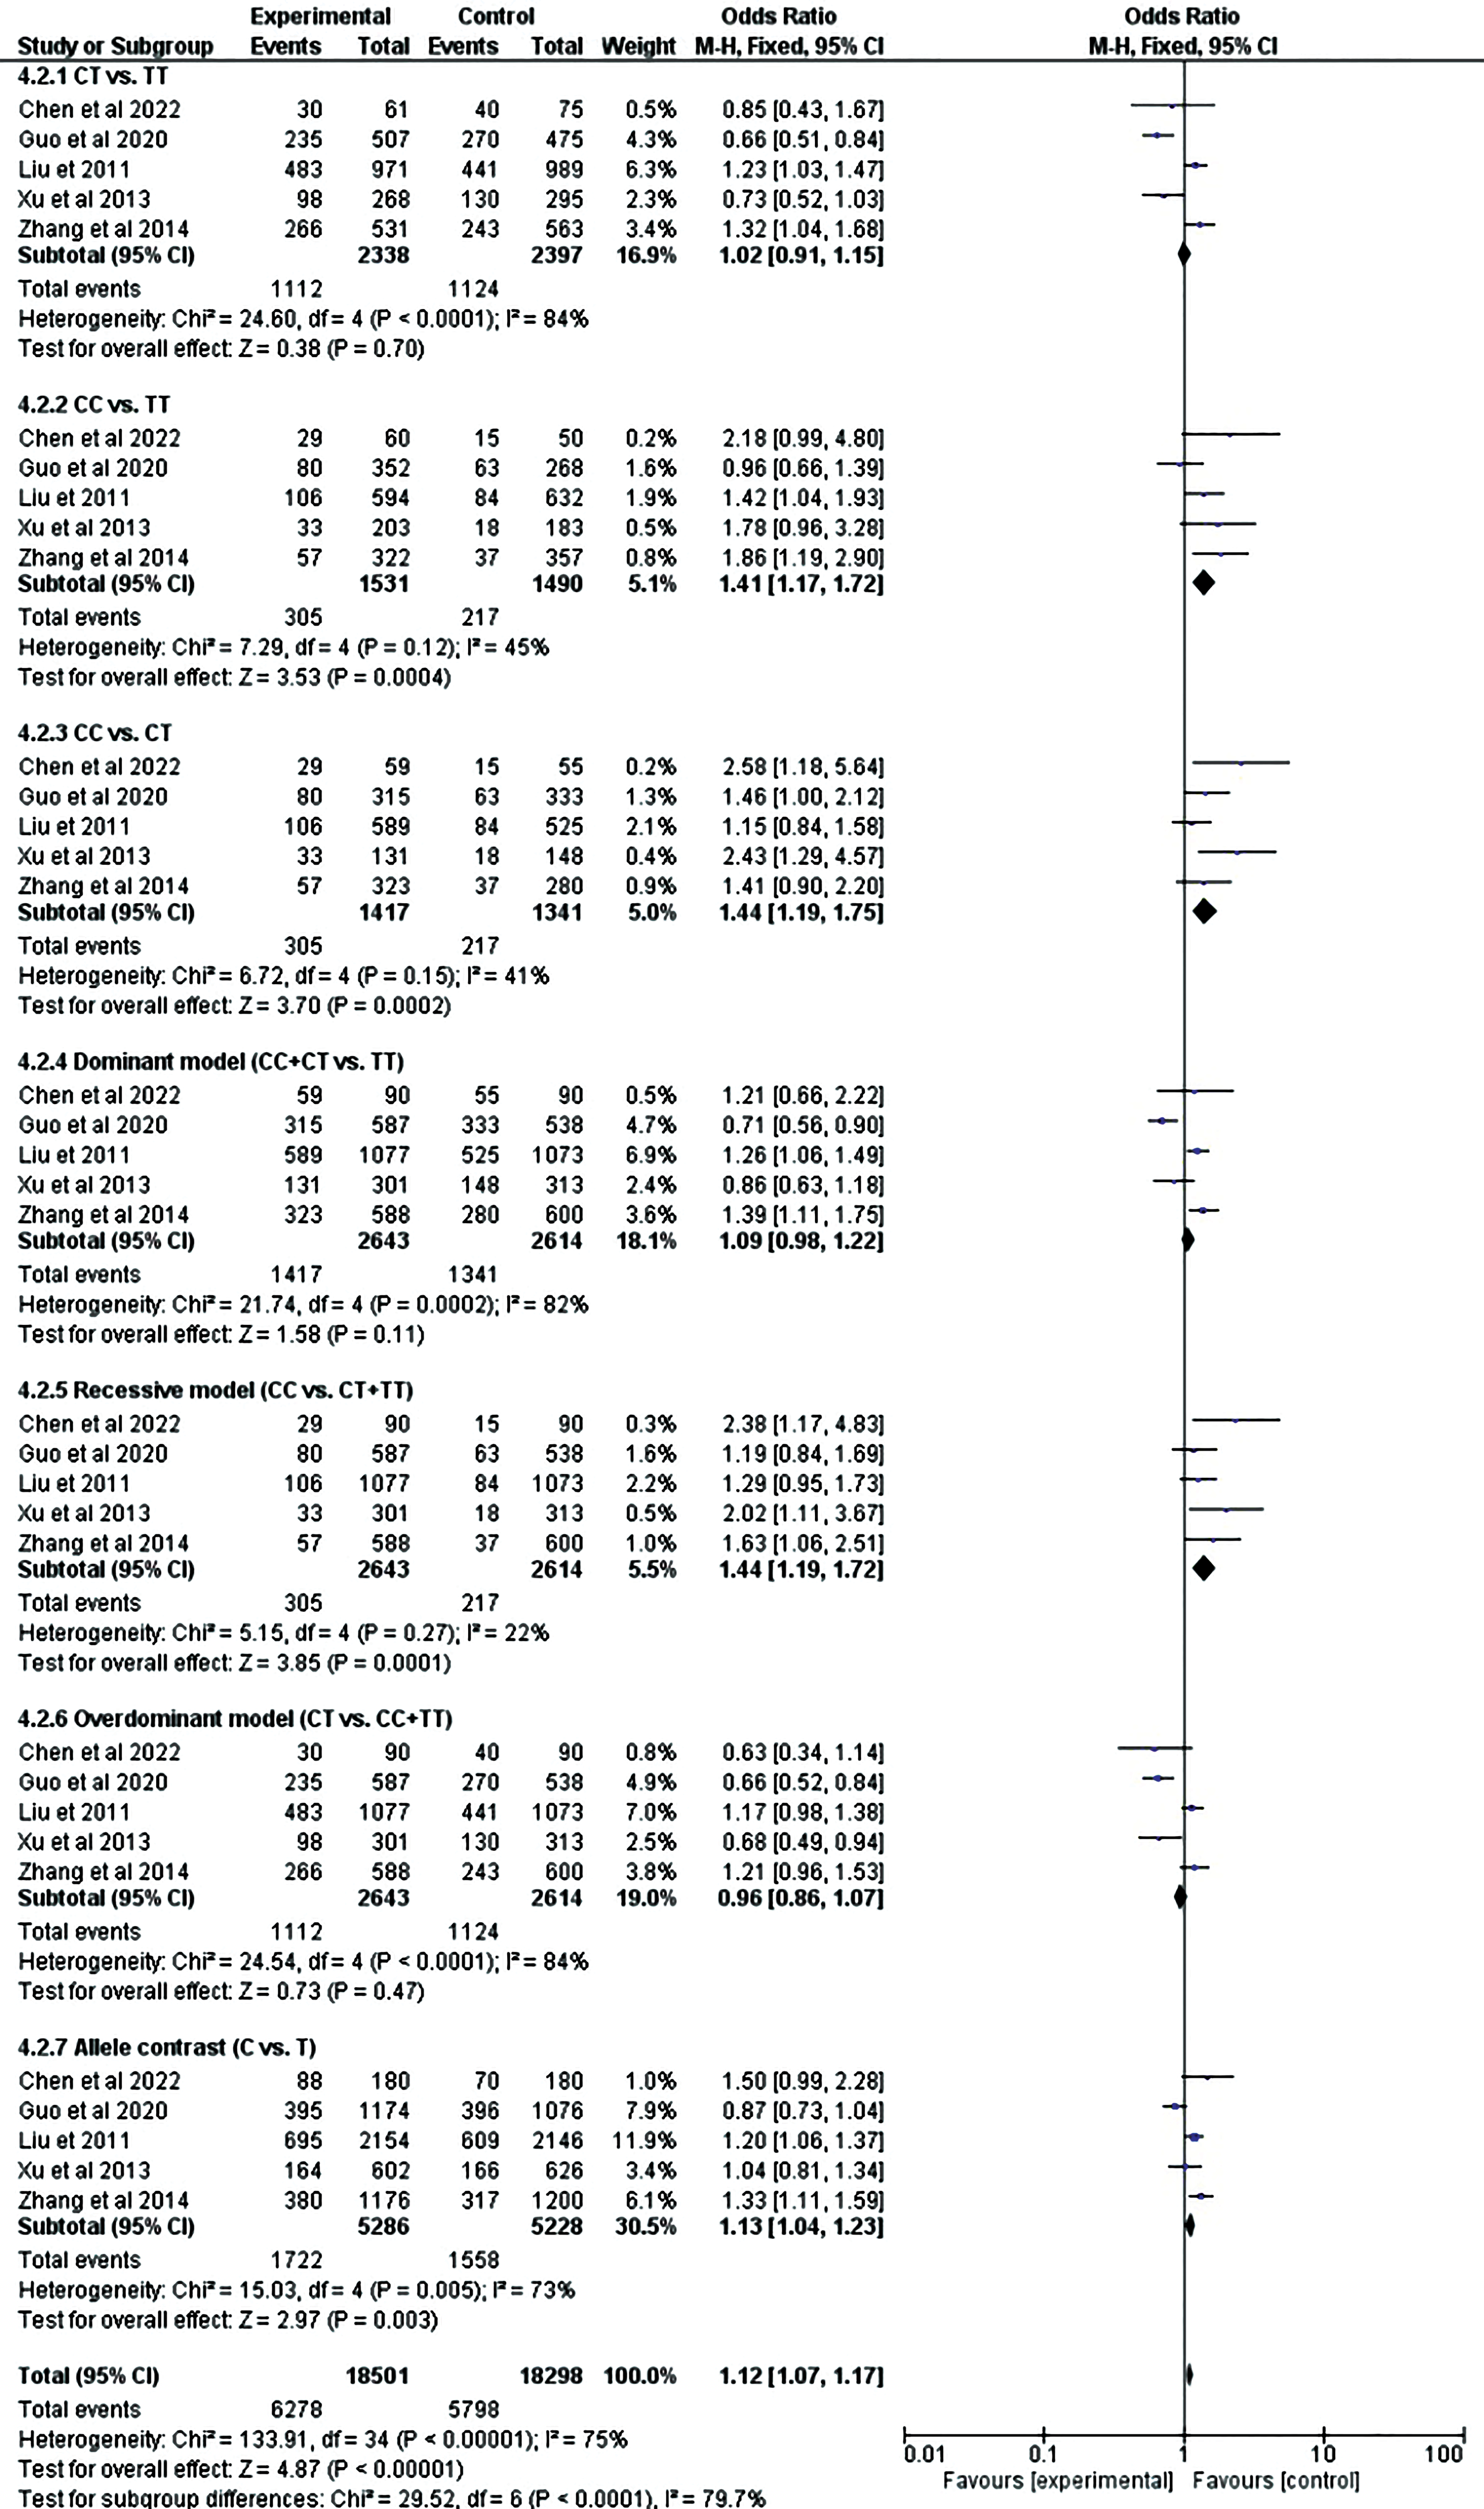
Forest plot for the meta-analysis of the association of TNFAIP2 rs8126 polymorphism with cancer risk.
Sensitivity Analysis and Publication Bias
The funnel plots exhibited no considerable asymmetry (Figure 9). As per the Begg–Mazumdar's test and Egger's regression test (Table 2), for rs11064, 4 genetic models (COD1: p = .042, DM: p = .042, OD: p = .042, and AM: p = .042) showed a significant publication bias. SNP rs1045241 also depicted a significant publication bias in 3 different genetic models, according to both Egger's test (COD1: p = .013, DM: p = .009, and AM: p = .029) and Begg–Mazumdar's test (COD2: p = .042, DM: p = .042, and AM: p = .042). The TNFAIP2 rs710100 also showed publication bias in 2 genetic models (COD3: p = .049 and RM: p = .035) for Egger's test, while Begg–Mazumdar's test did not demonstrate any publication bias. Our meta-analysis found significant publication bias in 2 genetic models (COD3: p = .012 and RM: p = .019) as determined by Egger's p-values for rs8126 and 1 genetic model (RM: p = .050) defined by Begg–Mazumdar's test revealed publication bias. The sensitivity analysis for the association of studied polymorphisms with cancer risk using AM was conducted by excluding the studies one by one, which revealed no significant changes, confirming the reliability and stability of the findings (Figure 10).

Funnel plots indicating the publication bias for detecting the association of studied polymorphism with cancer risk in the allele model.

Sensitivity analysis for the meta-analysis of the association of studied polymorphism with cancer risk in the allele model.
TSA and In-Silico Analysis
As shown in Figure 11(A to G), we conducted TSA for the meta-analysis of the association of studied polymorphism with cancer risk in TNFAIP8 rs11064 (G vs A), TNFAIP8 rs1045241 (TC vs CC), TNFAIP8 rs1045242 (GA vs AA), TNFAIP8 rs3813308 (GG vs GC + CC), TNFAIP8L1 rs1060555 (GG vs CC), TNFAIP2 rs710100 (AA vs AG + GG), and TNFAIP2 rs8126 (CC vs CT + TT) incorporating sample size of 31,499, 1,896, 2,196, 3,736, 5,450, 5,301, and 10,132, respectively. In the figures, the uppermost curves represent trial sequential monitoring boundary lines for the benefit and the lowermost curves represent trial sequential monitoring boundary lines for the harm. Two horizontal lines represent the traditional boundaries, and the crossing of Z-curves of these lines indicates statistically significant outcomes, and the futility boundaries are represented by triangular lines (red lines). According to Figure 11A, C, and E, Z-curves crossed the traditional sequential boundary, indicating the significant outcomes, but the required information size (RIS) did not reach, whereas, for Figure 11D, the RIS reached, although the outcome is not significant. In the case of Figure 11B and F, the Z-curves crossed the traditional sequential boundary, futility boundary, and RIS, indicating that our outcomes are supported with sufficient evidence, and no more studies are required. In contrast, in the case of Figure 11G, the Z-curve crossed the traditional and futility boundaries, verifying our significant outcome, but the RIS is not reached.
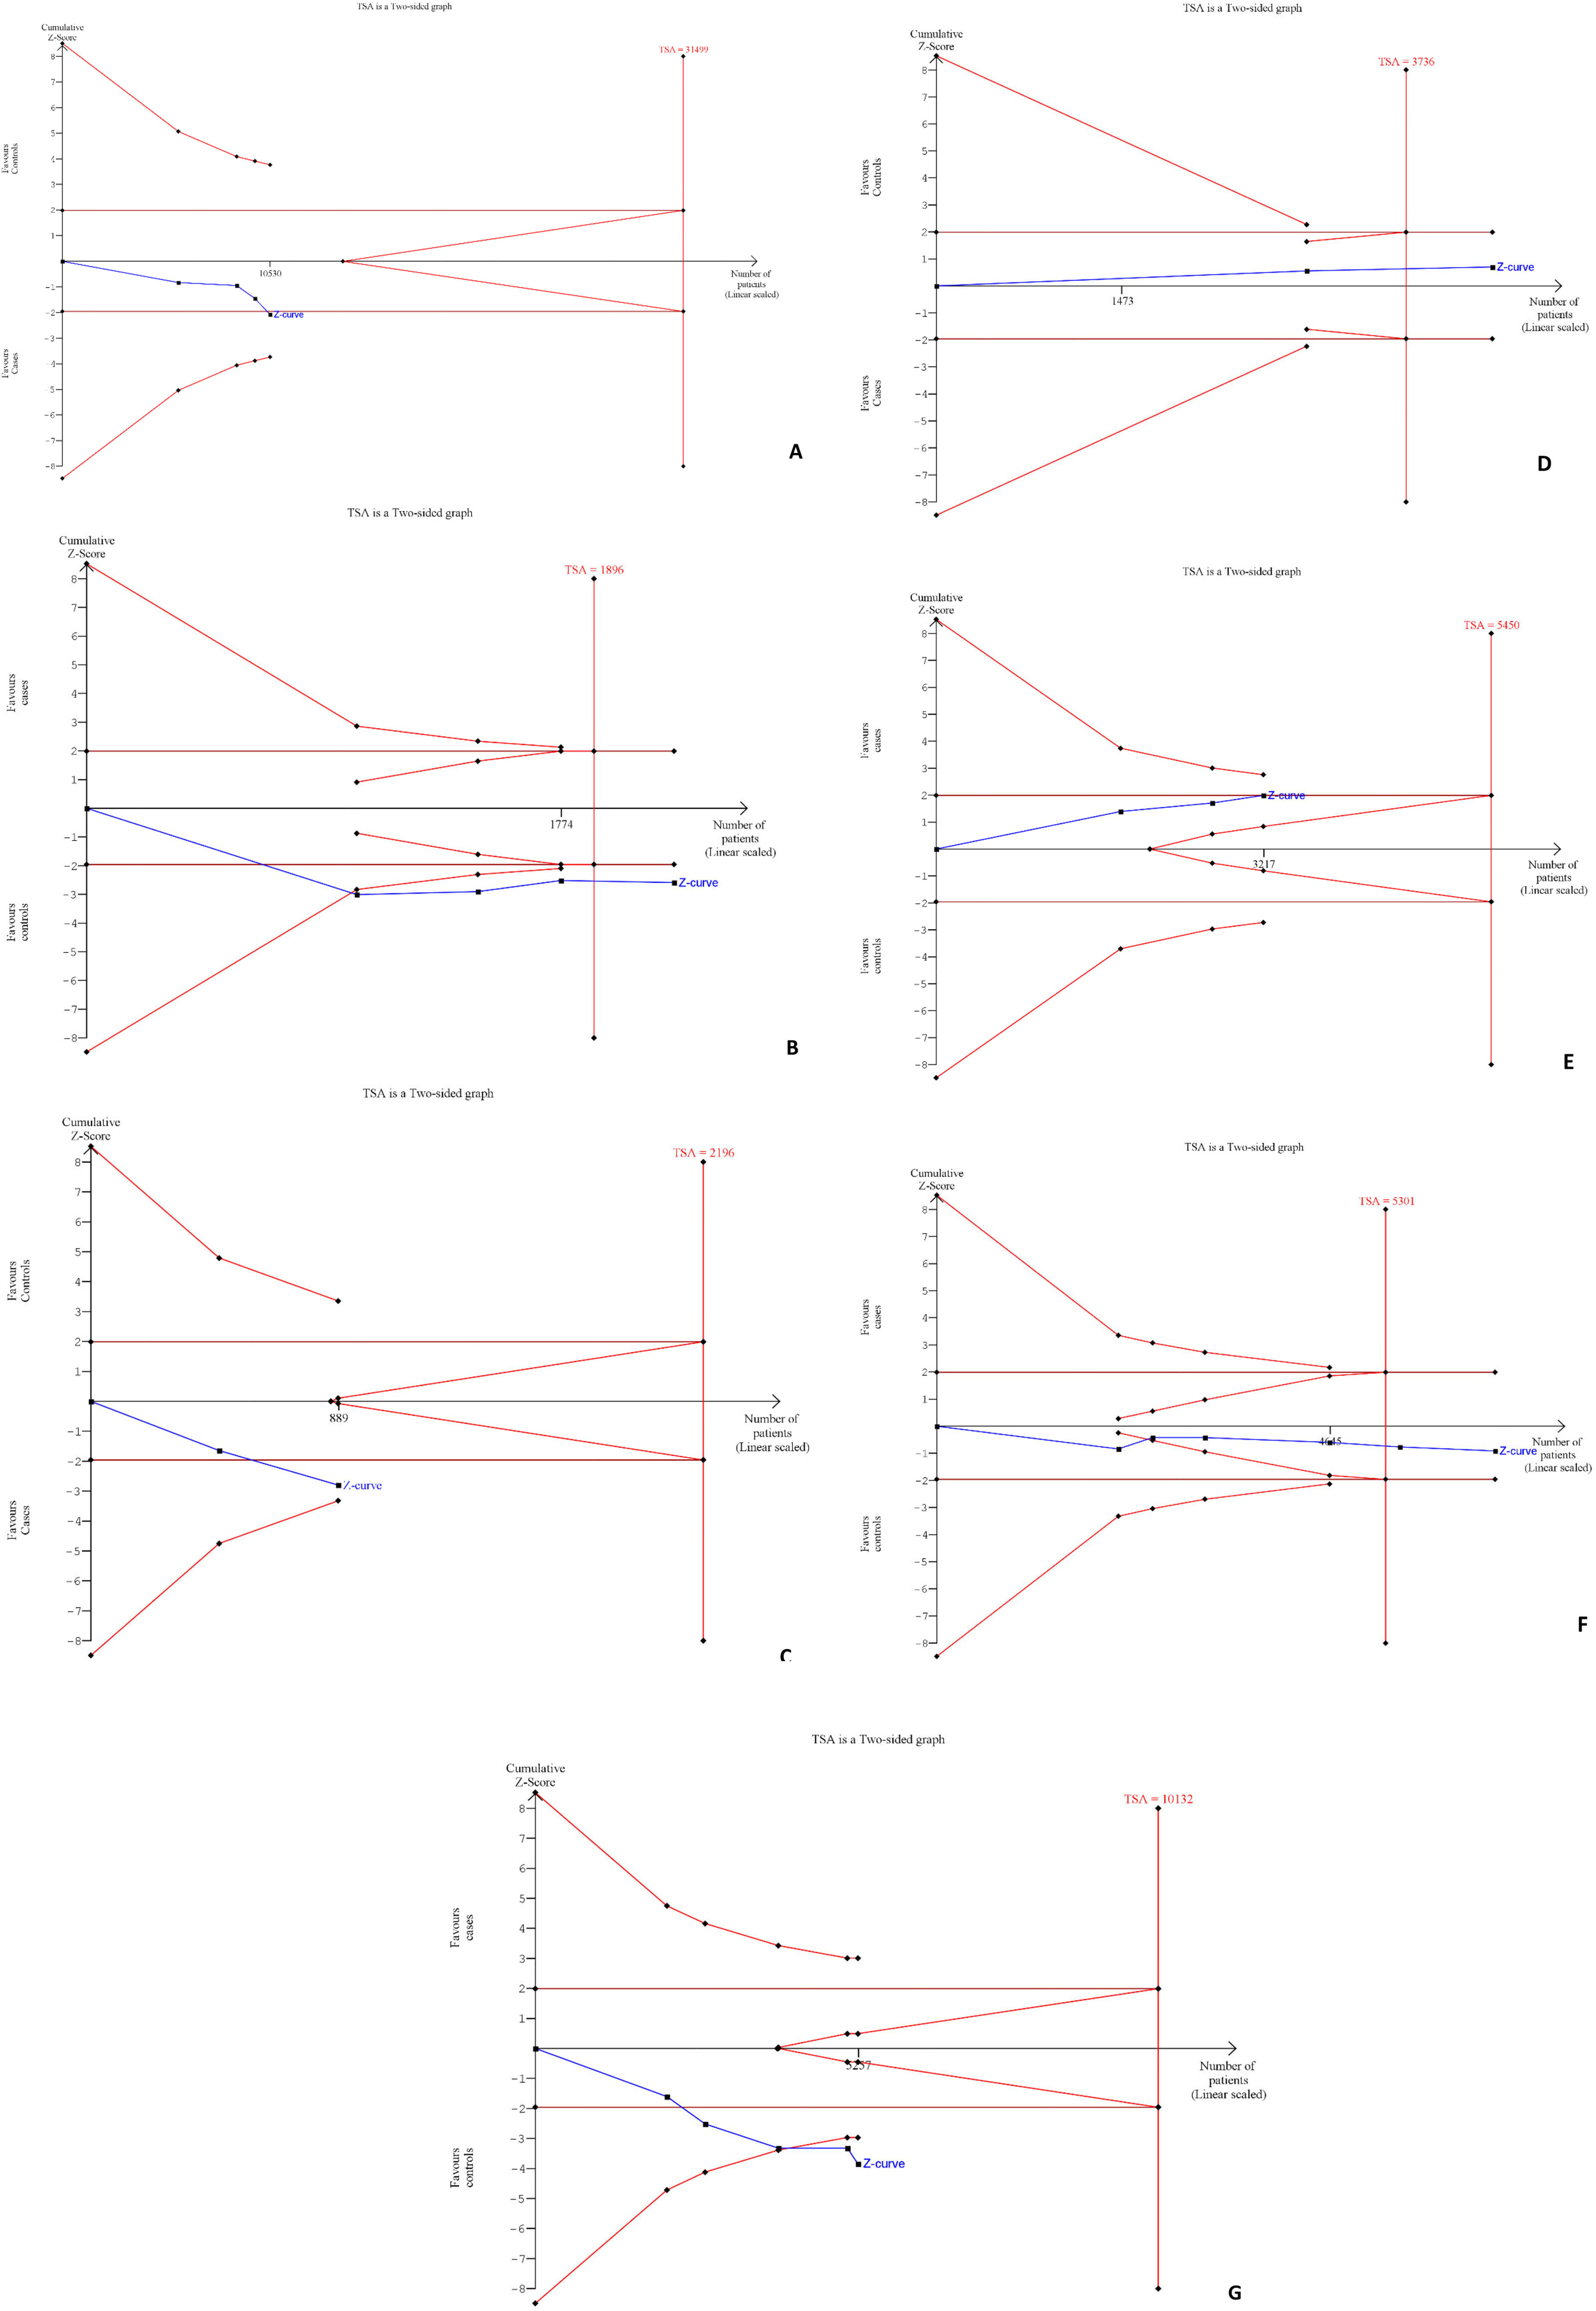
Trial sequential analysis (TSA) for the meta-analysis of the association of studied polymorphism with cancer risk in (A) TNFAIP8 rs11064 (G vs A); (B) TNFAIP8 rs1045241 (TC vs CC); (C) TNFAIP8 rs1045242 (GA vs AA); (D) TNFAIP8 rs3813308 (GG vs GC + CC); (E) TNFAIP8L1 rs1060555 (GG vs CC); (F) TNFAIP2 rs710100 (AA vs AG + GG); and (G) TNFAIP2 rs8126 (CC vs CT + TT).
According to the result of GTEx portal data (Figure 12), we found that TNFAIP8 rs11064 and rs3813308, TNFAIP8L1 rs1060555, and TNFAIP2 rs710100 and rs8126 were detected in cultured fibroblasts. Only TNFAIP8 rs1045241 and rs1045242 were detected in mammary tissues. The constructed violin plots indicated the mRNA expression of rs11064 (p = 1.7 × 10⁻⁹), rs1045241 (p = .032), rs1045242 (p = .048), rs3813308 (p = .0027), rs710100 (p = .00047), and rs8126 (p = .017) while no significant difference in mRNA expression between the mutant and wild alleles was found for rs1060555 (p = .41).

In-silico analysis (violin plots) of TNFAIP8 rs11064, TNFAIP8 rs1045241, TNFAIP8 rs1045242, TNFAIP8 rs3813308, TNFAIP8L1 rs1060555, TNFAIP2 rs710100, and TNFAIP2 rs8126 expression using the Genotype-Tissue Expression (GTEx) database. The teal area denotes the density distribution of the samples in each genotype and the white line in the box plot (black) indicates the median value of the expression of each genotype.
Discussion
Cancer is a group of disorders in which cells divide uncontrollably and abnormally. 33 Investigations into the causes of human malignancy have been continuously done for decades, and experts continue to analyze the importance of genetic and epigenetic aberrations in cancer development. In this meta-analysis, a total of 14 case–control studies on multiple cancers were included, and the association was analyzed using seven genetic models for the TNFAIP8 (rs11064, rs1045241, rs1045242, and rs3813308), TNFAIP8L1 (rs1060555), and TNFAIP2 (rs710100 and rs8126) gene polymorphisms.
Data shows that one of the most consequential regulators of apoptosis in both typical and malignant tissues is TNFAIP8, which is situated on chromosome 5q23.1. By inhibiting tumor cell growth and proliferation by modulating the Hippo signaling pathway, TNFAIP8 works as a cellular “pilot” for tumor cell migration by boosting local phosphatidylinositol 3 kinase-protein kinase B and Rac signals on the cell membrane encountering chemoattractants.34,35 In addition, TNF-α activates the NF-κB pathway to promote its expression, and TNFAIP8 mRNA expression is found in the head and neck, esophagus, breast, and lung tumors.5,36–38 SNP rs11064 was found to be correlated to a greater risk of cervical cancer in women from the Eastern Chinese region as reported by Shi et al. 11 Additionally, the results of the study imply that TNFAIP8 may serve as a valuable marker for reckoning platinum resistance and clinical outcomes in cervical cancer. 11 Polymorphisms in the TNFAIP8 gene were also reported to be associated with a greater risk of contracting ovarian cancer in another investigation. According to the results, the ovarian cancer risk was increased by rs1045242, whereas the risk was reduced by rs11064. They found no correlation between the TNFAIP8 rs1045241 and the likelihood of ovarian cancer. 21
In this meta-analysis, we found that 4 distinct genetic models of SNP rs11064, including COD2, COD3, RM, and AM (OR = 2.30, p = 7.83 × 10⁻⁵; OR = 2.10, p = .0006; OR = 2.24, p = .0001; and OR = 1.47, p = .037, respectively) and SNP rs1045242, including COD1, DM, ODM, and AM (OR = 1.52, p = .005; OR = 1.56, p = .002; OR = 1.48, p = .008; and OR = 1.48, p = .002, respectively), and 2 genetic models of SNP rs1045241, including COD1 and ODM (OR = 1.27, p = .009 and OR = 1.24, p = .018, respectively) are connected to increased cancer risk. This result is congruent with another recent study which reveals that rs11064 is not correlated to cancer. 39 The present study also revealed that rs1045241 polymorphism is associated with cancer risk in COD1 (OR = 1.27, p = .009) and ODM (OR = 1.24, p = .018), and rs1045242 is associated with cancer in 3 genetic models such as COD1 (OR = 1.52, p = .005), DM (OR = 1.56, p = .002), and AM (OR = 1.48, p = .002). Our meta-analysis found no evidence linking TNFAIP8 rs3813308 to an increased cancer risk, which is in line with prior studies.11,25
TNFAIP8L1 has a crucial function in the development and progression of malignant tumors. By binding to Rac1 and activating the caspases, TNFAIP8L1 causes cell death in hepatocellular carcinoma cells.40,41 According to research on neural cell lines, oxidative stress induces the production of the transcription factor TNFAIP8L1, which then inhibits the mammalian target of rapamycin (mTOR). 42 According to our data, TNFAIP8L1 rs1060555 is not associated with an increased risk of cancer; rather, one genetic model shows that it has a significant protective association with cancer (OR = 0.80, p = .048), which is consistent with recent research showing that this SNP has a protective role against cancer development.7,11
TNFAIP2, the principal responder gene of TNF-α, is phosphorylated by polo-like kinases in response to lipopolysaccharide stimulation, regulating the cellular inflammatory response via the NF-κB signaling pathway governing cell inflammatory, angiogenesis, cell aggrandization, relocation, and invasion.43–46 TNFAIP2 knockdown halted cell growth in the G0/G1 phase in esophageal squamous cell carcinoma cells and inhibiting TNFAIP2 expression diminishes proliferation and colony formation. 47 This meta-analysis confirms previous findings that the TNFAIP2 rs710100 genetic model is not correlated to an elevated risk of malignancy.14,28 In contrast, Ainiwaer et al 29 demonstrated that cervical cancer risk has been attributed to rs710100 in Chinese Uygur women (OR = 1.44, p = .018). Our study showed a significant link between rs8126 and cancer in 3 genetic models (COD2: OR = 1.41, p = .0005; COD3: OR = 1.44, p = .0002; and RM: OR = 1.43, p = .0001). Several studies have suggested that rs8126 has a link with stomach cancer, epidermis carcinomas, and squamous cell carcinomas of the head and neck.12,14,31 The results of TSA and sensitivity analysis also confirm the findings of our meta-analysis.
A few shortcomings should be made clear in light of the results of this investigation. First, the overall number of case–control studies is low (14 studies); for TNFAIP8 (rs1045242 and rs3813308), only 2 studies were included. Second, the number of patients and controls retained in the studies was low. Third, the controls in several pieces of research were not always designated as being of the same age and gender. Fourth, there is a significant publication bias observed in some genetic models, which may be attributed to the small number of studies as well as the small sample size. Finally, the genetic model demonstrated a publication bias. Even after these shortcomings, including case–control studies in this review, the meta-analysis is comprehensive, and the study's consequences are eminently conceivable.
Conclusion
This meta-analysis summarizes that rs11064, rs1045241, and rs1045242 polymorphisms of the TNFAIP8 gene and rs8126 polymorphism of the TNFAIP2 gene are significantly correlated to an elevated risk of cancer. Besides, TNFAIP8L1 rs1060555 polymorphism may have a protective role in cancer development. Large-scale investigations incorporating more studies in diverse populations are recommended to determine the proper correlation of these polymorphisms with cancer.
Supplemental Material
sj-docx-1-tct-10.1177_15330338221123109 - Supplemental material for Susceptibility of TNFAIP8, TNFAIP8L1, and TNFAIP2 Gene Polymorphisms on Cancer Risk: A Comprehensive Review and Meta-Analysis of Case–Control Studies
Supplemental material, sj-docx-1-tct-10.1177_15330338221123109 for Susceptibility of TNFAIP8, TNFAIP8L1, and TNFAIP2 Gene Polymorphisms on Cancer Risk: A Comprehensive Review and Meta-Analysis of Case–Control Studies by Khokon Kanti Bhowmik, Md Abdul Barek, Md. Abdul Aziz and Mohammad Safiqul Islam in Technology in Cancer Research & Treatment
Footnotes
Abbreviations
Acknowledgments
The authors wish to thank the Laboratory of Pharmacogenomics and Molecular Biology, Department of Pharmacy, Noakhali Science and Technology University, Sonapur, Noakhali, Bangladesh for their generalized support, unwavering motivation, academic supervision, constructive comments, affectionate sensation, and positive recommendations.
Authors Contributions
Both KKB and MAB contributed equally to the review and conducted the first literature search. KKB, MAB, and MAA were all involved in the writing process, review, and editing. MSI came up with the idea, performed the data analysis, and reviewed and edited the final result for accuracy. The final paper was reviewed and approved by all of the researchers.
Declaration of Conflicting Interests
The authors declared no potential conflicts of interest with respect to the research, authorship, and/or publication of this article.
Funding
The authors received no financial support for the research, authorship, and/or publication of this article
Data Availability
All data generated or analyzed during the present meta-analysis are accessible from the corresponding author upon reasonable request.
Supplemental Material
Supplemental material for this article is available online.
References
Supplementary Material
Please find the following supplemental material available below.
For Open Access articles published under a Creative Commons License, all supplemental material carries the same license as the article it is associated with.
For non-Open Access articles published, all supplemental material carries a non-exclusive license, and permission requests for re-use of supplemental material or any part of supplemental material shall be sent directly to the copyright owner as specified in the copyright notice associated with the article.