
Abstract
Introduction
Cancer is one of the top global public health burdens, which ranks first or second in terms of deaths in many countries.1,2 The latest statistics on worldwide cancer suggest that the ratio of cancer incidence and death is almost 1:5 and 1:6, respectively. 3 It is projected that there will be approximately 28.4 million new cancer incidences in 2040, which is an almost 47% rise over that of 2020 (19.3 million). 4 It has been alarmingly increasing in both developing and developed regions of the world, following a nonuniform pattern due to the complex interaction of multiple risk factors. 2 In addition, interactions between genetic and environmental components enhance the probability of different cancers. 5 Despite many efforts, there is still a long way to go in revealing the exact mechanism of cancer.
Recent advances in cancer research have demonstrated the significant link between noncoding RNAs and cancer progression. The microRNAs or miRNAs are relatively small noncoding RNAs that are described to be key players in the pathogenesis of cancer.6,7 They have a significant role in posttranscriptional modification and possess both oncogenic and tumor-suppressive activities. 8 Aberrant expression of miRNAs has been studied for the etiopathology and development of various human cancers. Line of evidence reported that an individual miRNA could affect almost 200 genes. Surprisingly, greater than 50% of the microRNA genes are reported in cancer-susceptible areas of the human genome, and mature miRNAs have been found to control around 20% of human genes.9–11
MiR-196a2 is an important member of the miRNA-196 precursor family found in the homeobox (HOX) clusters region of the human genome. 12 An extensively studied miR-196a2 variant is rs11614913 (C > T), which is investigated in a plethora of cancers, including breast cancer,13–17 gastric cancer,18–22 hepatocellular carcinoma,23–25 colorectal cancer,26–29 lung cancer,30–32 gynecological cancer,33–38 prostate cancer,39–41 and so on. Despite a large number of studies performed in almost all ethnic populations, the contribution of rs11614913 polymorphism to cancer risk is still inconclusive. Therefore, this updated meta-analysis was performed to estimate a meticulous correlation between miR-196a2 rs11614913 variant and cancer susceptibility based on the published case–control studies in different ethnicities.
Material and Methods
This updated meta-analysis was completed following the latest recommendations for the PRISMA (Preferred Reporting Items for Systematic Reviews and Meta-Analyses) by Page et al 42 and registered with INPLASY (https://inplasy.com/). The INPLASY registration number is INPLASY202250027.
Search Strategy of Literature
An organized online article search was carried out using PubMed, ScienceDirect, EMBASE, Scopus, CNKI, and Google Scholar databases to find all relevant literature using the following terms: miR-196a2, microRNA-196a2, miRNA-196-a2, miR-196a, 196a, rs11614913, polymorphism, single nucleotide polymorphism, SNP, variant, carcinoma, cancer, neoplasm, tumor, malignancy, either solely or in combination. For retrieving all possible publications, the reference list of the identified literature was also screened carefully. We did not implement any language restrictions in the literature search process. The search was limited to December 15, 2021.
Eligibility Criteria of Literature
Literature meeting the below criteria was incorporated in this meta-analysis: (a) analyzed the correlation between miR-196a2 rs11614913 and cancer susceptibility, (b) designed as a case–control study (c) contained full-text, and (d) contained sufficient genotype frequencies for calculating odds ratio (OR) and 95% confidence interval (95% CI). On the other hand, literature with the below criteria was excluded: (a) systematic or narrative reviews, case reports, editorials, conference papers, and comments, (b) without a case–control design, (c) articles on animals or cell lines, and (d) without detailed genotype frequencies.
Data Extraction Procedure
All relevant data were collected from the selected studies utilizing a predesigned data extraction form and then cross-checked to confirm the consistency. The below-listed data was collected from each study: name of the main author, time of publication, country, type of malignancy, method of genotyping, source/type of controls, amount of cases and controls, amount of total participants, the frequency distribution of genotypes, and Hardy-Weinberg equilibrium (HWE) P value of controls.
For analytical purposes, we have categorized all information as follows: (a) ethnicities into Asian, Caucasian, and African, (b) cancers into the breast, gastric, gynecological (cervical, endometrial, ovarian), blood and bone marrow (acute leukemia, acute lymphocytic leukemia, multiple myeloma, chronic lymphocytic leukemia), glioma, hepatocellular carcinoma, colorectal, oral, prostate, esophageal, head and neck (head and neck squamous cell carcinoma, nasopharyngeal carcinoma, head and neck cancer), bladder, lung, and renal cell cancer, (c) sources of controls into hospital-based (HB) and population-based (PB), and methods of genotyping into the TaqMan, polymerase chain reaction-restriction fragment length polymorphism (PCR-RFLP), and others (ARMS (amplification refractory mutation system), Sequencing, MassARRAY).
Statistical Analysis
The review manager (RevMan) 5.4 for windows (The Cochrane Collaboration) was applied to perform the present meta-analysis. The significance of the correlation between rs11614913 variant and cancer susceptibility was evaluated via calculating ORs corresponding to 95% CIs. The ORs with 95% CIs have been obtained assuming different genotypic and allelic comparisons, including codominant model 1 (CDM1-TC/CC), codominant model 2 (CDM2-TT/CC), codominant model 3 (CDM3-TT/TC), dominant model (DM-TT + TC/CC), recessive model (RM-TT/TC + CC), over-dominant model (ODM-TC/TT + CC), and allele model (AM-T/C). All of the above comparisons were implied for overall, ethnicity-based, cancer subtypes-based, control population-based, and genotyping methods-based analyses.
The variation in the outcomes of the study was measured through heterogeneity analysis applying the χ2-based Q-test and analyzed through I2. In terms of statistically significant heterogeneity (P < .05, or I2 ≥ 50%), the random-effects (RE) model was applied (the DerSimonian and Laird technique). 43 In nonsignificant cases, the fixed-effects (FE) model was used (the Mantel-Haenszel technique). 44
The consistency in the outcomes of the study and the influence of individual studies were measured through one-way sensitivity analysis. In this process, each study was deleted at a time and the values of ORs with corresponding 95% CIs were checked to determine any deviation. Any potential publication bias in the present meta-analysis was estimated using Egger's linear regression test via constructing funnel plots 45 and Begg-Mazumdar's rank correlation test. 46
HWE P values for control sources were quantified utilizing the χ2 test. The HWE P values were adjusted (corrected) by Benjamini and Hochberg's false discovery rate, 47 and all P values in this meta-analysis were regarded statistically significant if found to be <.05.
Results
Study Identification
From the initial search in online databases, we identified a total of 1819 initial records for miR-196a2 rs11614913 polymorphism, from which 152 articles13–41,48–163 were finally selected for the current meta-analysis, following the eligibility criteria mentioned above. The selection process of these studies based on the updated PRISMA guidelines is depicted in Figure 1. Overall, 120 135 subjects, including 53 818 patients with different cancers and 66 317 controls, are included in the analysis. After the adjustment of the HWE P values, 12 studies13,48,66,83,96,103,105,114,124,128,129,161 were removed from the quantitative analysis, and all subgroup analyses were performed based on the remaining 140 studies. Table 1 represents the extracted characteristics or features of the incorporated literature.
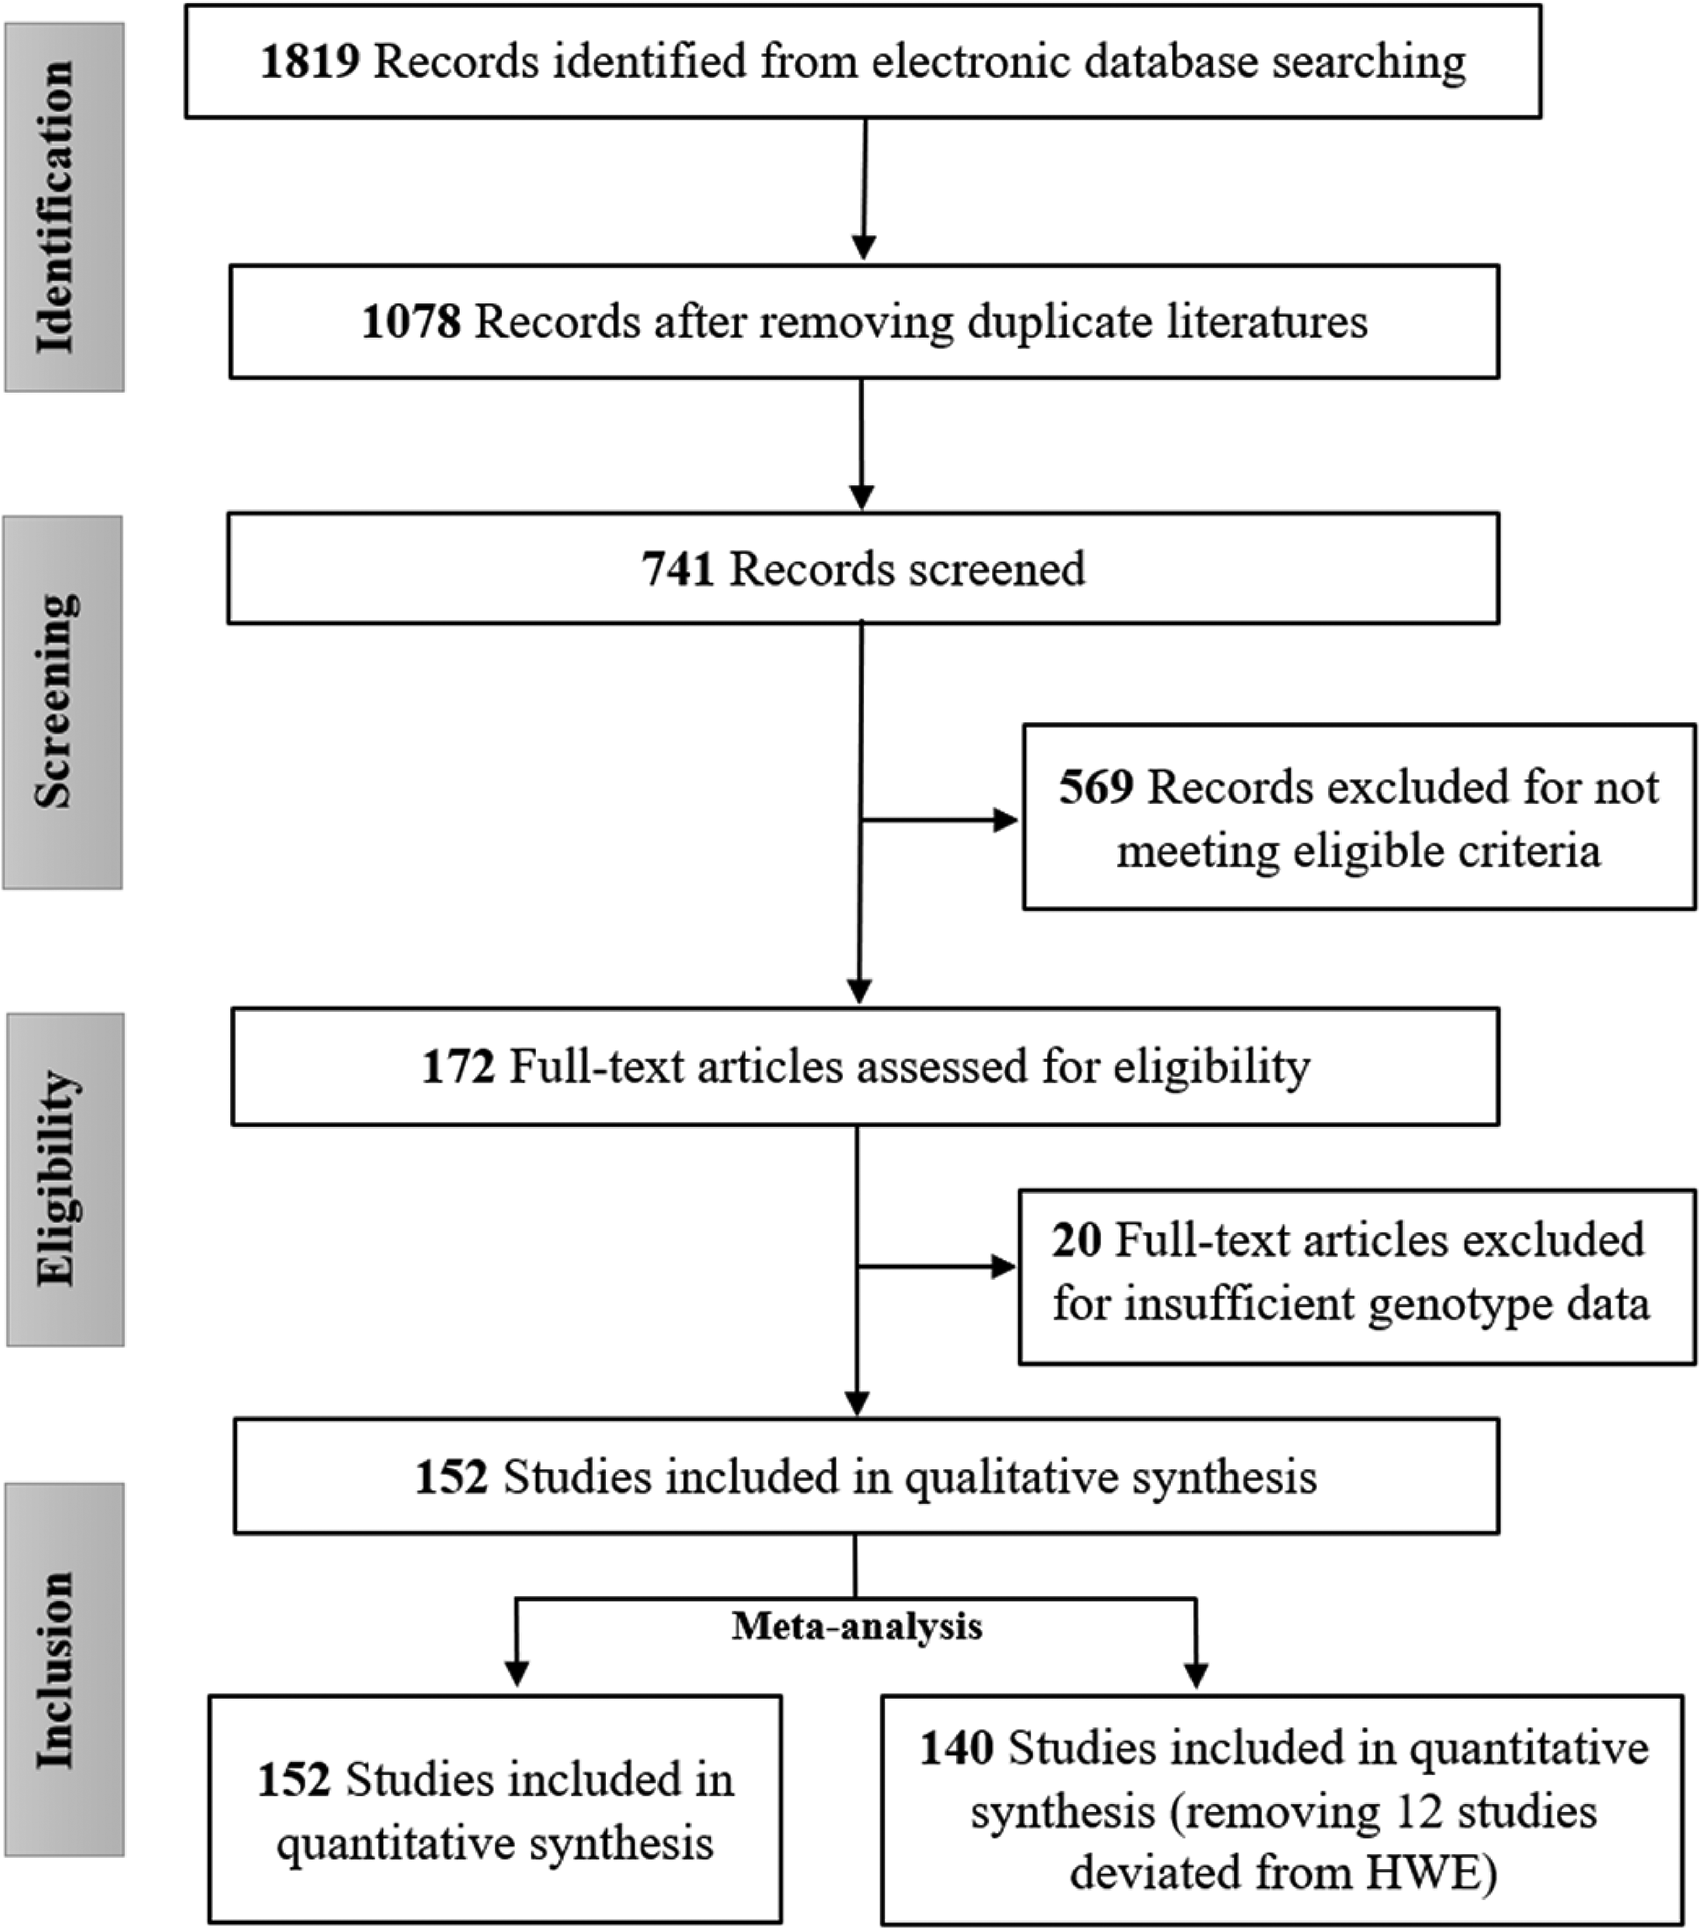
Study selection process according to PRISMA guidelines.
Characteristics of the selected studies for detecting the connection of miR-196a2 rs11614913 polymorphism with cancer.
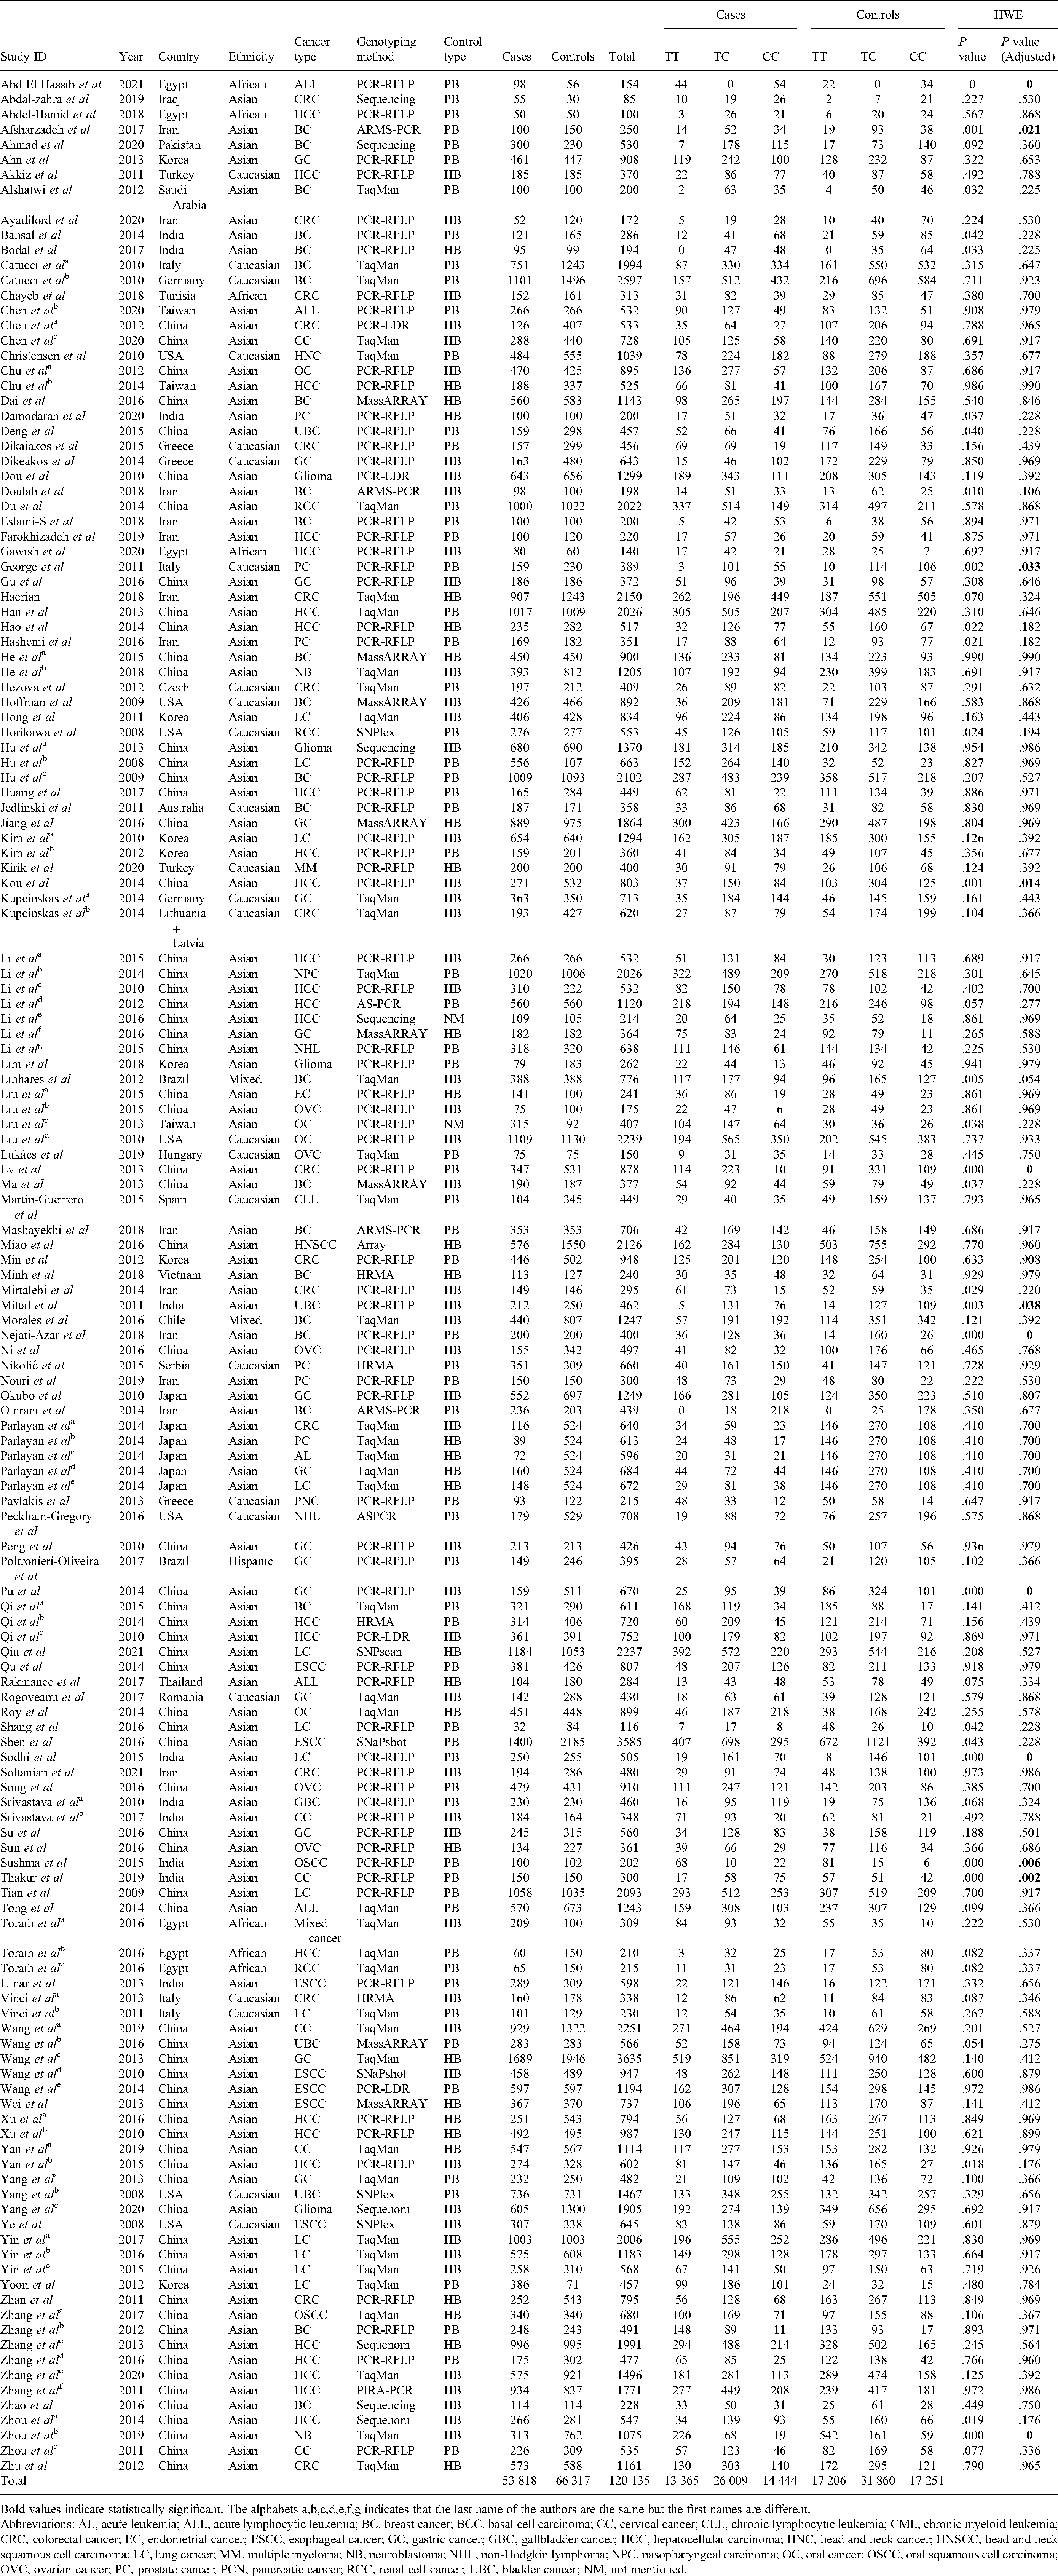
Bold values indicate statistically significant. The alphabets a,b,c,d,e,f,g indicates that the last name of the authors are the same but the first names are different. Abbreviations: AL, acute leukemia; ALL, acute lymphocytic leukemia; BC, breast cancer; BCC, basal cell carcinoma; CC, cervical cancer; CLL, chronic lymphocytic leukemia; CML, chronic myeloid leukemia; CRC, colorectal cancer; EC, endometrial cancer; ESCC, esophageal cancer; GC, gastric cancer; GBC, gallbladder cancer; HCC, hepatocellular carcinoma; HNC, head and neck cancer; HNSCC, head and neck squamous cell carcinoma; LC, lung cancer; MM, multiple myeloma; NB, neuroblastoma; NHL, non-Hodgkin lymphoma; NPC, nasopharyngeal carcinoma; OC, oral cancer; OSCC, oral squamous cell carcinoma; OVC, ovarian cancer; PC, prostate cancer; PCN, pancreatic cancer; RCC, renal cell cancer; UBC, bladder cancer; NM, not mentioned.
In total, there were 107 studies from Asian ancestry, 24 studies from Caucasian ancestry, 6 studies from African ancestry, and 3 from other populations. Among the cancer types, there were 24 studies on hepatocellular cancer, 22 on breast carcinoma, 15 on colorectal carcinoma, 14 on gastric cancer, 12 on lung cancer, 11 on gynecological cancer (cervical-5, endometrial-1, ovarian-5), 7 on esophageal cancer, 6 on blood and bone marrow–related cancer, 5 on prostate cancer, 5 on oral cancer, 4 on glioma, 3 on bladder cancer, 3 on head and neck cancer, 3 on renal cell cancer, and 2 on non-Hodgkin lymphoma.
Stratification based on the control population sources showed that 79 studies contained HB controls and 59 studies contained PB controls. Most of the included studies used the PCR-RFLP for genotyping (n = 61), while 42 studies used TaqMan and 37 studies used other genotyping methods (ARMS + Sequencing + MassARRAY).
Quantitative Data Synthesis
Results from the pooled data analysis of overall 152 studies (Table 2 and Supplementary Figure S1) showed that human miR-196a2 rs11614913 variant substantially reduced the susceptibility of overall cancer in the CDM2, CDM3, RM, and AM genetic models (OR = 0.89, P = .006, 95% CI = 0.83-0.97; OR = 0.93, P = .014, 95% CI = 0.87-0.99; OR = 0.91, P = .003, 95% CI = 0.86-0.97; and OR = 0.95, P = .017, 95% CI = 0.92-0.99, respectively). After excluding 12 studies deviating from HWE, the overall analysis of 140 studies showed that the similar genetic models (CDM2, CDM3, RM, and AM) were significantly associated with a reduced risk of cancer (OR = 0.89, P = .003, 95% CI = 0.82-0.96; OR = 0.92, P = .008, 95% CI = 0.87-0.98; OR = 0.91, P = .001, 95% CI = 0.86-0.96; and OR = 0.95, P = .010, 95% CI = 0.92-0.99, respectively). Additionally, ethnicity-based subgroup analysis (Table 2 and Figure 2) revealed a substantially reduced link of rs11614913 with cancer susceptibility among Asian population in the CDM2, CDM3, RM, and AM genetic models (OR = 0.89, P = .005, 95% CI = 0.82-0.96; OR = 0.91, P = .009, 95% CI = 0.86-0.98; OR = 0.90, P = .002, 95% CI = 0.85-0.96, and OR = 0.95, P = .011, 95% CI = 0.91-0.99, respectively). Among African population, CDM1 and ODM genetic models showed significantly enhanced association with cancer (OR = 1.33, P = .044, 95% CI = 1.01-1.77; OR = 1.46, P = .001, 95% CI = 1.16-1.85, respectively) but CDM3 genetic model showed reduced association (OR = 0.66, P = .007, 95% CI = 0.48-0.89). No strong association was observed between rs11614913 genetic variant and susceptibility of cancer among Caucasian and other population (Hispanic and mixed) (P > .05).
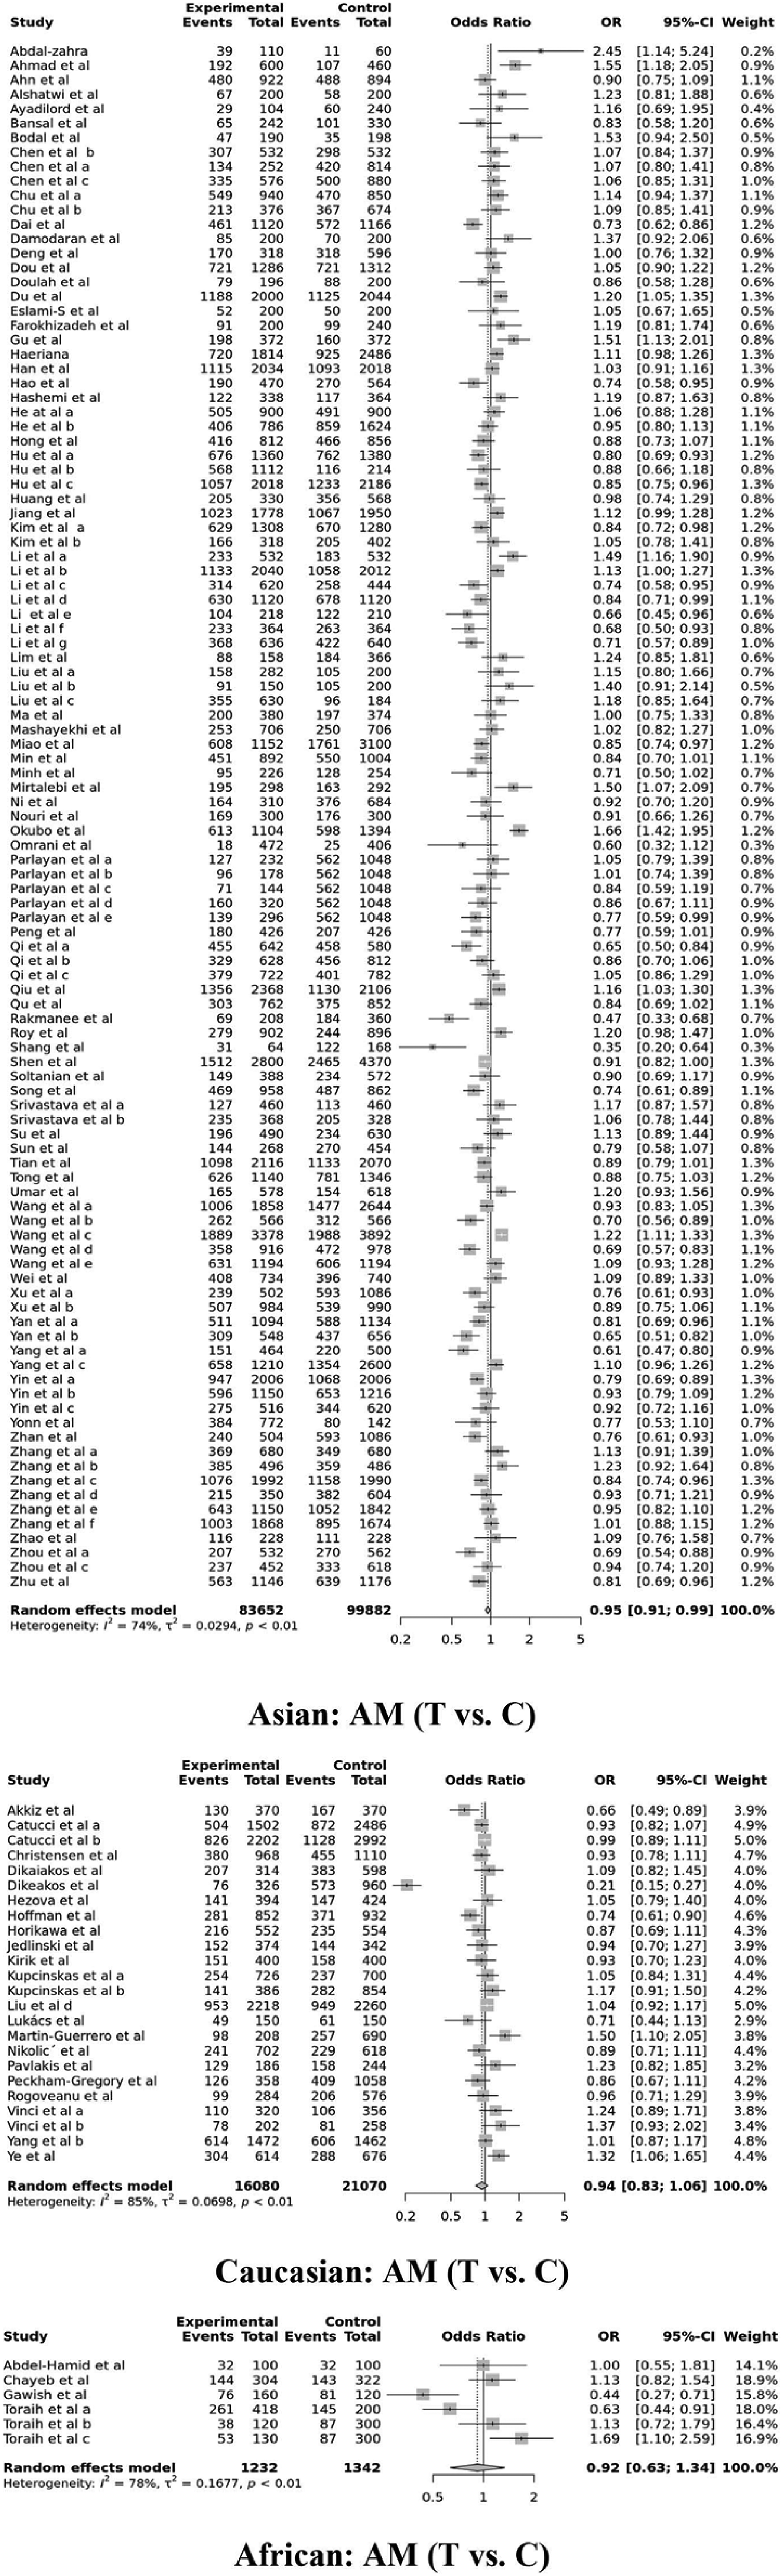
Ethnicity-based forest plot indicating the connection of miR-196a2 rs11614913 polymorphism with overall cancer susceptibility in the allele model (AM).
Meta-analysis for detecting the connection of miR-196a2 rs11614913 polymorphism with overall cancer and ethnicity.

Bold values indicate statistically significant. Abbreviations: CDM1, Codominant 1 (TC vs CC); CDM2, Codominant 2 (TT vs CC); CDM3, Codominant 3 (TT vs TC); DM, Dominant model (TT + TC vs CC); RM, recessive model (TT vs TC + CC); ODM, over-dominant model (TC vs TT + CC); AM, allele model (T vs C); FE, fixed-effects; RE, random-effects.
Stratified analysis based on the cancer types (shown in Table 3 and Figure 3) demonstrated that there were significantly reduced correlation of rs11614913 with hepatocellular cancer from 24 studies (CDM2—OR = 0.76, P = .001, 95% CI = 0.64-0.89; CDM3—OR = 0.87, P = .021, 95% CI = 0.77-0.98; DM—OR = 0.86, P = .024, 95% CI = 0.76-0.98; RM—OR = 0.83, P = .003, 95% CI = 0.74-0.94; and AM—OR = 0.89, P = .003, 95% CI = 0.82-0.96), lung cancer from 12 studies (CDM2—OR = 0.79, P = .022, 95% CI = 0.65-0.97; CDM3—OR = 0.80, P = .020, 95% CI = 0.66-0.97; DM—OR = 0.91, P = .045, 95% CI = 0.84-1.00; RM—OR = 0.79, P = .014, 95% CI = 0.66-0.95; and AM—OR = 0.88, P = .025, 95% CI = 0.79-0.99), gynecological cancer from 11 studies (CDM3—OR = 0.87, P = .010, 95% CI = 0.78-0.97; RM—OR = 0.86, P = .003, 95% CI = 0.77-0.95), and breast cancer from 22 studies (CDM2—OR = 0.84, P = .041, 95% CI = 0.72-0.99; RM—OR = 0.88, P = .039, 95% CI = 0.77-0.99). On the other hand, rs11614913 showed significantly increased association with oral cancer from 5 studies (CDM1—OR = 1.38, P = .003, 95% CI = 1.11-1.70; CDM2—OR = 1.22, P = .018, 95% CI = 1.04-1.45; DM—OR = 1.26, P = .0002, 95% CI = 1.11-1.43; ODM—OR = 1.21, P = .0007, 95% CI = 1.09-1.36; and AM—OR = 1.10, P = .019, 95% CI = 1.02-1.19), and renal cell cancer from 6 studies (CDM1—OR = 1.37, P = .001, 95% CI = 1.13-1.67). The correlation of rs11614913 with bladder (3 studies), colorectal (15 studies), esophageal (7 studies), gastric (14 studies), head and neck (3 studies), prostate (5 studies), blood and bone marrow related cancer (6 studies), and glioma (4 studies) was not statistically significant (P > .05). No statistically significant correlation was observed for non-Hodgkin lymphoma from 2 studies (Table 4).

Forest plot in allele model (AM) indicating the connection of miR-196a2 rs11614913 polymorphism with cancer types.
Meta-analysis for detecting the connection of miR-196a2 rs11614913 polymorphism with different cancer subtypes.
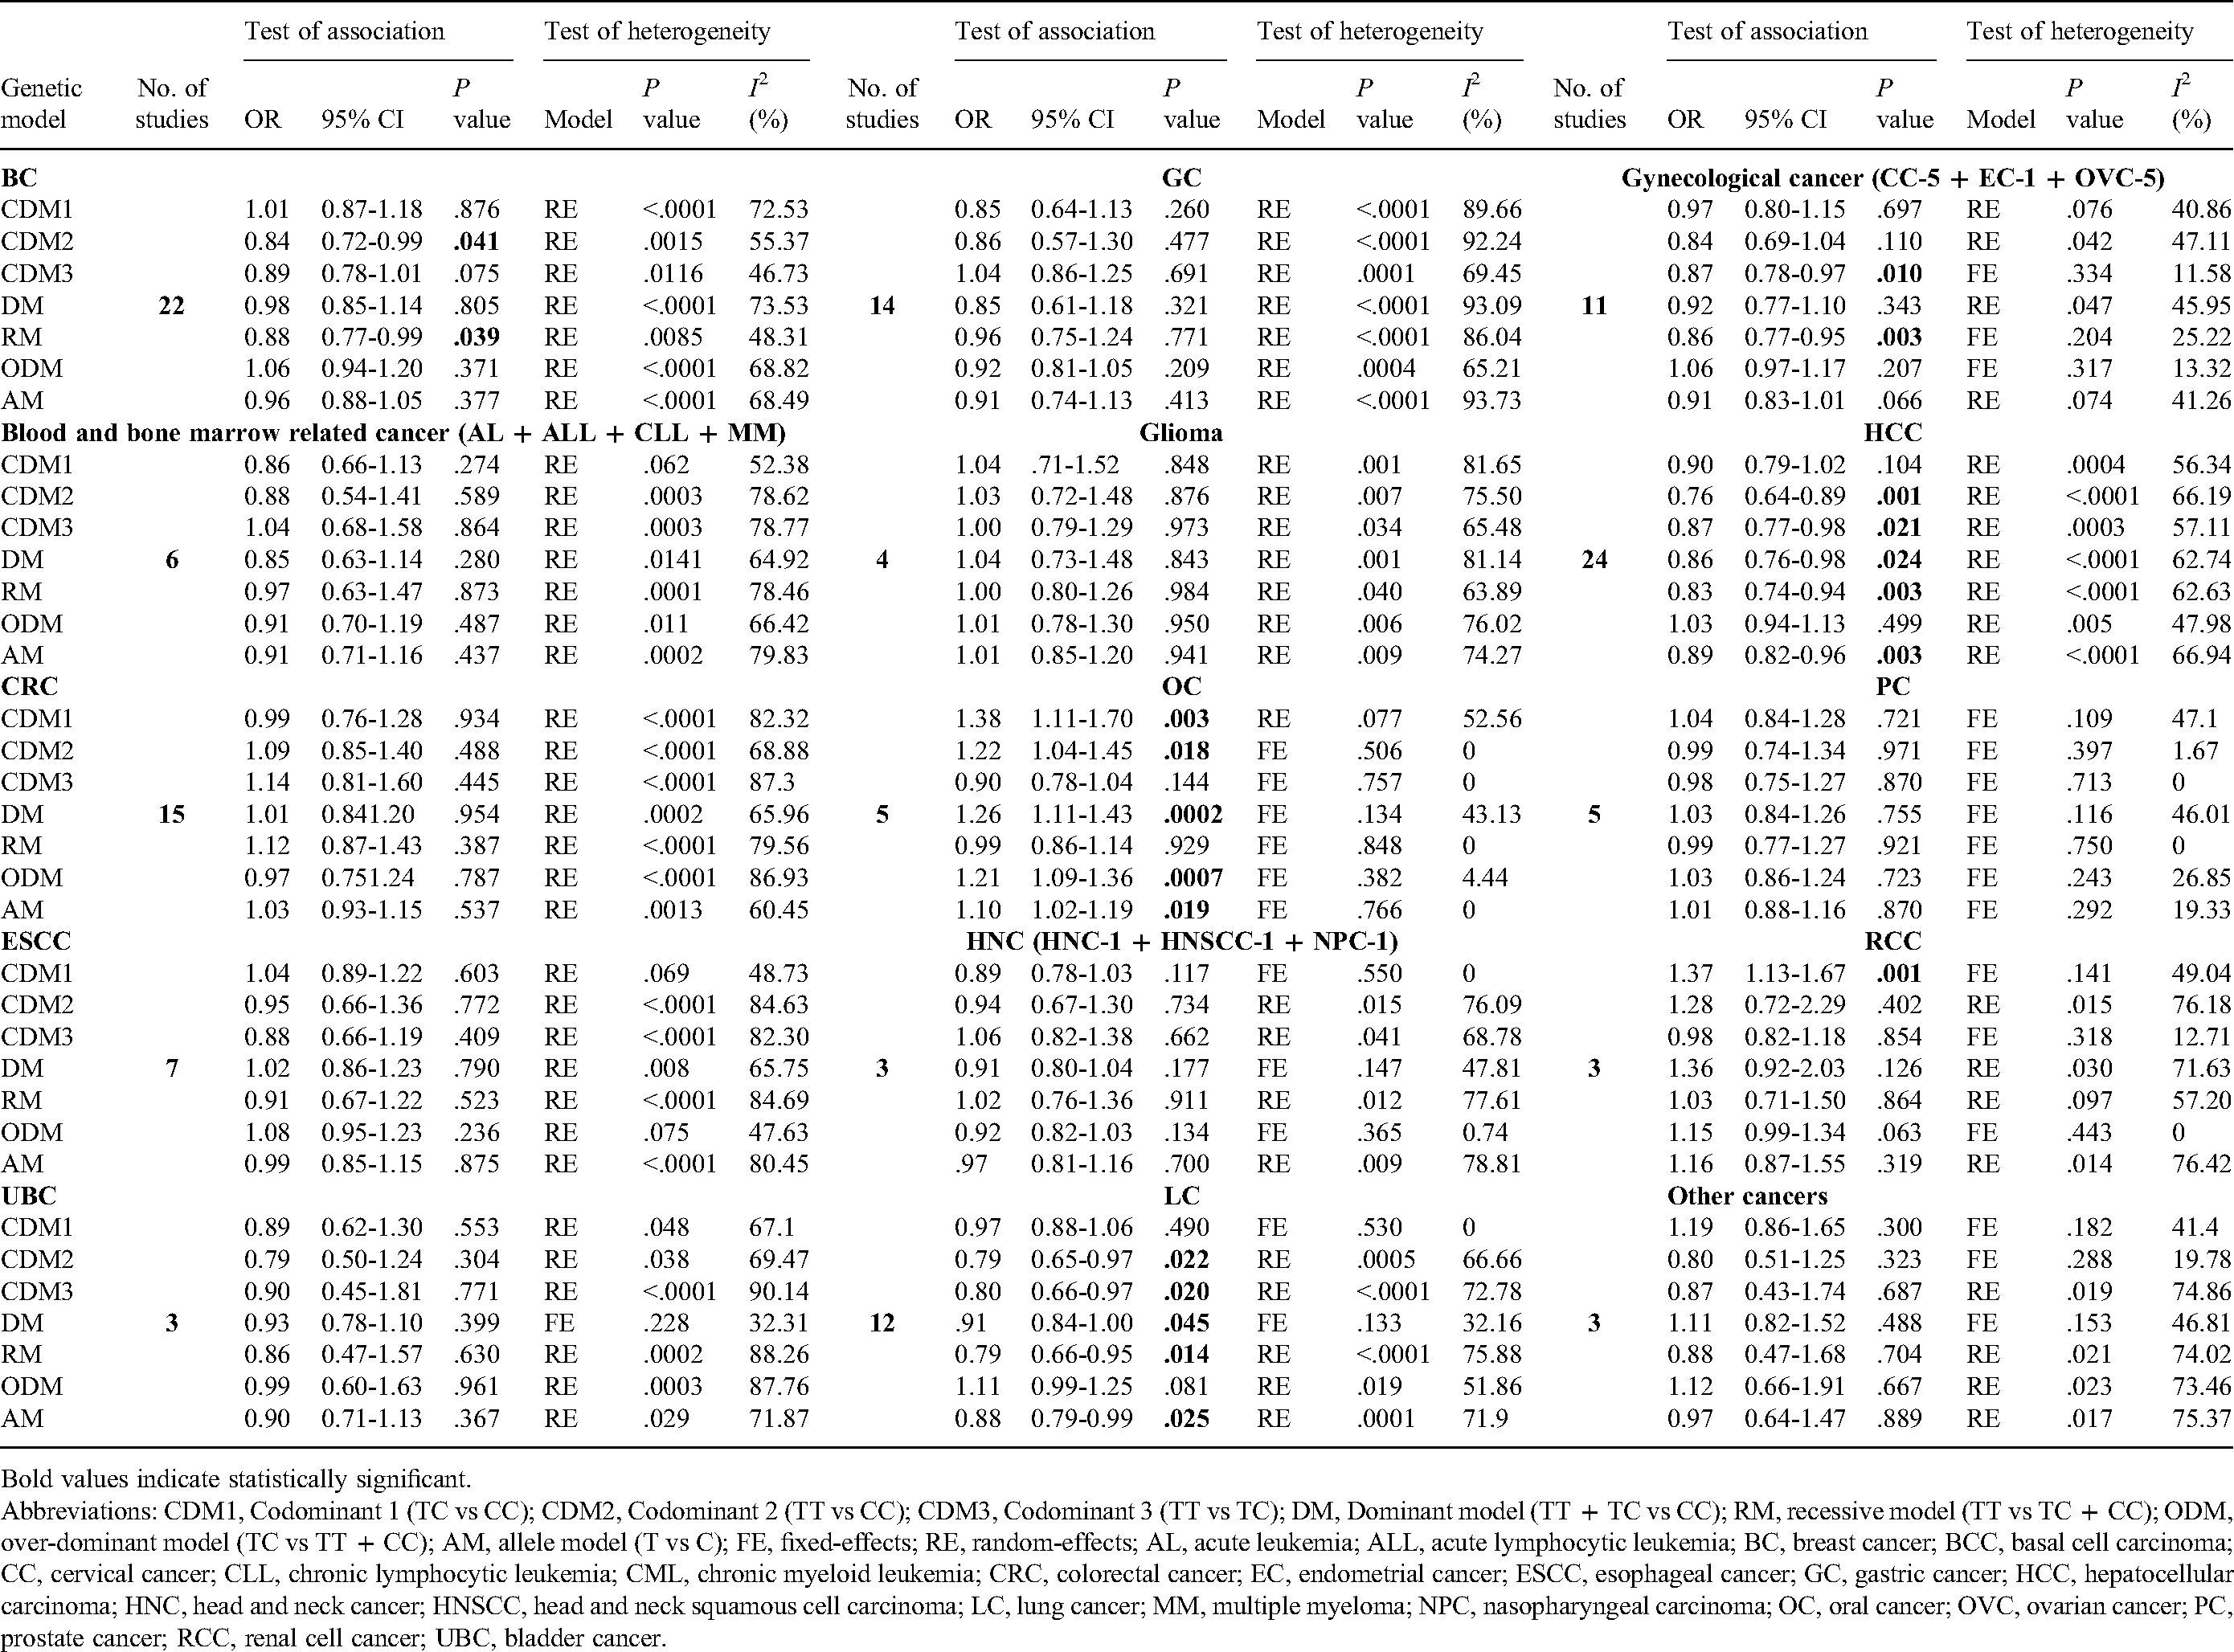
Bold values indicate statistically significant. Abbreviations: CDM1, Codominant 1 (TC vs CC); CDM2, Codominant 2 (TT vs CC); CDM3, Codominant 3 (TT vs TC); DM, Dominant model (TT + TC vs CC); RM, recessive model (TT vs TC + CC); ODM, over-dominant model (TC vs TT + CC); AM, allele model (T vs C); FE, fixed-effects; RE, random-effects; AL, acute leukemia; ALL, acute lymphocytic leukemia; BC, breast cancer; BCC, basal cell carcinoma; CC, cervical cancer; CLL, chronic lymphocytic leukemia; CML, chronic myeloid leukemia; CRC, colorectal cancer; EC, endometrial cancer; ESCC, esophageal cancer; GC, gastric cancer; HCC, hepatocellular carcinoma; HNC, head and neck cancer; HNSCC, head and neck squamous cell carcinoma; LC, lung cancer; MM, multiple myeloma; NPC, nasopharyngeal carcinoma; OC, oral cancer; OVC, ovarian cancer; PC, prostate cancer; RCC, renal cell cancer; UBC, bladder cancer.
Meta-analysis for detecting the connection of miR-196a2 rs11614913 polymorphism with cancer based on the cancer subtype (NHL), control sources, and genotyping methods.

Bold values indicate statistically significant. Abbreviations: CDM1, Codominant 1 (TC vs CC); CDM2, Codominant 2 (TT vs CC); CDM3, Codominant 3 (TT vs TC); DM, dominant model (TT + TC vs CC); RM, recessive model (TT vs TC + CC); ODM, over-dominant model (TC vs TT + CC); AM, allele model (T vs C); NHL, non-Hodgkin lymphoma; FE, fixed-effects; RE, random-effects.
Again, control population-based subgroup analysis (Table 4) reported a strongly reduced correlation between rs11614913 and cancer susceptibility for the HB population from 79 studies in the CDM2, RM, and AM genetic models (OR = 0.88, P = .028, 95% CI = 0.79-0.99; OR = 0.91, P = .020, 95% CI = 0.84-0.99; OR = 0.94, P = .027, 95% CI = 0.89-0.99, respectively) but no association was found for PB-based controls from 59 studies. Although no significant association was observed for PCR-RFLP (61 studies) and TaqMan (42 studies) genotyping methods during subgroup analysis, a substantially decreased risk was observed for other genotyping methods (ARMS + Sequencing + MassARRAY) from 37 studies in the CDM2, CDM3, RM, and AM genetic models (OR = 0.84, P = .007, 95% CI = 0.74-0.95; OR = 0.89, P = .037, 95% CI = 0.80-0.99; OR = 0.88, P = .011, 95% CI = 0.79-0.97; and OR = 0.94, P = .037, 95% CI = 0.88-1.00, respectively) as shown in Table 4.
Test of Heterogeneity
Heterogeneity analysis was performed for all applied genetic models in overall analysis (Table 2) and subgroup analyses based on ethnicity (Table 2), cancer types (Table 3), control sources, and genotyping methods (Table 4). We have observed significant heterogeneity in the overall analysis and all subgroup analyses (P< .05 or I2 > 50%) in our meta-analysis, and we have applied RE models consequently.
Publication Bias
Table 5 and Figure 4 present publication bias to detect the connection of miR-196a2 rs11614913 genetic variant with overall cancer in all genetic models. However, no statistically substantial bias was reported in any genetic models that were confirmed by Egger's symmetric funnel plots and P values of Begg-Mazumdar's assessment (P values were found to be greater than .05 in every comparison).

Funnel plots indicating the publication bias for detecting the connection of miR-196a2 rs11614913 polymorphism with overall cancer susceptibility.
Publication bias for the meta-analysis to detect the connection of miR-196a2 rs11614913 polymorphism with overall cancer.

Abbreviations: CDM1, Codominant 1 (TC vs CC); CDM2, Codominant 2 (TT vs CC); CDM3, Codominant 3 (TT vs TC); DM, dominant model (TT + TC vs CC); RM, recessive model (TT vs TC + CC); ODM, over-dominant model (TC vs TT + CC); AM, allele model (T vs C).
Sensitivity Analysis
One-way sensitivity analysis was implemented in all genetic models to measure the robustness in the outcomes of the study and the influence of individual studies by deleting each study at a time. Our estimation showed that the values of ORs and 95% CIs were consistent in all genotypic and allele models, which demonstrates the reliability and robustness of the meta-analysis, as shown in Figure 5.

Sensitivity plot in allele model (AM) for detecting the connection of miR-196a2 rs11614913 polymorphism and overall cancer.
Discussion
The potential impact of miRNAs on the susceptibility of cancer, especially miR-196a2, has drawn the attention of the scientists that led to the production of hundreds of studies, including genetic epidemiological studies and systemic reviews and meta-analyses. The inconsistencies of these studies have influenced to perform an updated meta-analysis for estimating a meticulous correlation between human miR-196a2 rs11614913 genetic variant and a wide range of malignancies. The outcomes of the current meta-analysis confirm that the rs11614913 variant is linked with the overall cancer susceptibility.
Accumulating studies have explicated that single nucleotide polymorphisms in the miRNA-encoding genes might modulate the binding and processing capacity of microRNAs by attenuating the secondary structures of their progenitors. This results in biological dysfunctions and abnormal expression of miRNA target genes that ultimately lead to cancer development.164–166 More than 150 genetic association studies have been performed until now to analyze the role of the human miR-196a2 rs11614913 variant with the susceptibility to a variety of cancer; however, these concluded in contradictory findings. As a result, multiple meta-analyses were performed both on overall cancer and individual cancer risk to verify the contribution of rs11614913 polymorphism.7,167–170 Notably, these meta-analyses also lacked some potential and updated studies that must be taken into consideration to reveal the absolute correlation between this variant and cancer susceptibility. Therefore, we performed this meta-analysis, including the largest possible number of association studies conducted in different cohorts or ethnicities to provide a cement outcome.
Our quantitative data synthesis from 152 studies (before adjusting the HWE P value) showed that rs11614913 in human miR-196a2 is significantly correlated with the reduced risk of overall cancer in the CDM2, CDM3, RM, and AM genetic models (OR = 0.89, 0.93, 0.91, and 0.95, respectively). Again, analysis from the overall 140 studies (after adjusting the HWE P value) revealed that rs11614913 is also associated with the decreased risk of cancer in the same genetic models (OR = 0.89, 0.92, 0.91, and 0.95, respectively). Additionally, an ethnicity-based stratified analysis of 107 studies of Asian ancestry revealed a substantially decreased link of rs11614913 with cancer in the CDM2, CDM3, RM, and AM models (OR = 0.89, 0.91, 0.90, and 0.95, respectively) and of 6 studies from African ancestry showed a significantly increased correlation with cancer in the CDM1 and ODM genetic models (OR = 1.33 and 1.46) and decreased correlation in the CDM3 genetic model (OR = 0.66). A total of 24 studies of Caucasian ancestry were analyzed, but no significant association was observed for rs11614913 with cancer susceptibility (P > .05). Although our findings are comparable to the past studies,7,167–170 there are discrepancies because of the small number of literature incorporated in these analyses.
Stratified analyses based on the cancer types, control population sources, and genotyping methods were also performed. A significantly reduced correlation of rs11614913 was observed with hepatocellular carcinoma, lung cancer, gynecological cancer, and breast cancer. In terms of the association of rs11614913 with oral cancer and renal cell cancer, a significantly increased association was reported. No significant correlation was reported for rs11614913 with bladder, colorectal, esophageal, gastric, head and neck, prostate, blood and bone marrow related cancer, non-Hodgkin's lymphoma, and glioma (P > .05). Again, the control population-based subgroup analysis reported a strongly reduced correlation between rs11614913 and cancer susceptibility for the HB population, but no association was found for PB-based controls. Although no significant association was observed for PCR-RFLP and TaqMan genotyping methods during subgroup analysis, a substantially reduced risk was observed for other genotyping methods (ARMS + Sequencing + MassARRAY). However, while some previous meta-analyses are consistent with our findings for hepatocellular carcinoma,171,172 some others found no correlation between HCC and rs11614913 polymorphism. 173 Ren et al 174 reported the association of rs11614913 with lung cancer in a meta-analysis with 5 studies, which is consistent with our findings. Other meta-analyses with individual cancer susceptibility also produced conflicting outcomes, such as in breast cancer, 175 gastric cancer,176,177 colorectal cancer,178,179 esophageal cancer, 180 and prostate cancer. 181
Moreover, we have performed heterogeneity analysis for all applied genetic models in the overall analysis and stratified analyses based on the cancer types, ethnicity, control sources, and genotyping methods. Even though we have conducted stratification based on the multiple parameters, we have observed significant heterogeneity in the case of the overall analysis and all stratified analyses in which RE models were applied. Notably, we did not observe any statistically significant publication bias in any genetic models, as depicted by Egger's funnel plots and Begg-Mazumdar's P values. Again, sensitivity analysis was implemented in all genetic models to measure the robustness of the outcomes of the study by omitting each study at a time. Our estimation showed that the values of ORs and 95% CIs were consistent in all genotypic and allele models, which demonstrates the reliability of our meta-analysis.
As far as we are aware, this is the most comprehensive and updated meta-analysis regarding the correlation between the human miR-196a2 rs11614913 variant and cancer susceptibility. Also, ours is the first meta-analysis of miR-196a2 rs11614913 which performed quantitative synthesis based on the ethnicity, cancer types, control sources, and genotyping methods at a time under 7 genetic models. Nevertheless, a few drawbacks of our study should be addressed. First, there is significant heterogeneity in most of the genetic models. Second, we may miss some potential studies due to the unresponsiveness of the authors who were contacted for full-text articles or detailed genotype data. Thirdly, there are relatively fewer studies on the African population, which might affect the statistical power of the current meta-analysis.
Conclusions
To summarize, the findings of the current meta-analysis confirm that the human miR-196a2 rs11614913 genetic variant is correlated with cancer susceptibility in the overall population, especially in Asians and Africans. It is also correlated with breast cancer, lung cancer, hepatocellular carcinoma, gynecological malignancy, renal cell cancer, blood and bone marrow-related cancer, NHL, and oral cancer.
Supplemental Material
sj-docx-1-tct-10.1177_15330338221109798 - Supplemental material for Effect of miR-196a2 rs11614913 Polymorphism on Cancer Susceptibility: Evidence From an Updated Meta-Analysis
Supplemental material, sj-docx-1-tct-10.1177_15330338221109798 for Effect of miR-196a2 rs11614913 Polymorphism on Cancer Susceptibility: Evidence From an Updated Meta-Analysis by Md. Abdul Aziz, Tahmina Akter and Mohammad Safiqul Islam in Technology in Cancer Research & Treatment
Footnotes
Abbreviations
Authors’ Note
Acknowledgments
The scientific contribution of this study is dedicated to the freedom fighters of Bangladesh who sacrificed their lives in the 1971 liberation war on the 50th anniversary of Bangladesh.
Declaration of Conflicting Interests
The author(s) declared no potential conflicts of interest with respect to the research, authorship, and/or publication of this article.
Funding
The author(s) received no financial support for the research, authorship, and/or publication of this article.
Supplemental Material
Supplemental material for this article is available online.
References
Supplementary Material
Please find the following supplemental material available below.
For Open Access articles published under a Creative Commons License, all supplemental material carries the same license as the article it is associated with.
For non-Open Access articles published, all supplemental material carries a non-exclusive license, and permission requests for re-use of supplemental material or any part of supplemental material shall be sent directly to the copyright owner as specified in the copyright notice associated with the article.