
Abstract
Keywords
Introduction
Neoadjuvant chemotherapy (NAC) is known to be a suitable treatment and first-line defense for locally advanced breast cancer. NAC can reduce tumor size, thereby allowing a wider range of surgical options and decreasing the chance of metastasis.1,2 NAC has a high clinical response rate of 70% to 98% for locally advanced breast cancer, whereas NAC is reported to be unhelpful for 2% to 30% of patients. 3 Early detection of those patients who do not benefit from NAC is needed to reduce unnecessary therapy and side effects and to allow the early application of more appropriate therapies such as hormone therapy or radiotherapy. 4 The response of breast cancer to NAC is studied using various modalities and methods, from tumor biomarkers to imaging analysis. With imaging analysis, dynamic contrast-enhanced MRI (DCE-MRI) seems to be the best imaging modality for evaluating the response of breast cancer to treatment with NAC.5-7 With breast DCE-MRI, it is possible to perform both spatial and temporal evaluations and analyses. Furthermore, histogram, texture, fractal, and perfusion analyses, as well as functional tumor properties, have all been recently studied with breast DCE-MRI, and the technique has evolved to enable more appropriate response evaluation.8-13 However, the NAC response may include unexpected outcomes, and it is not easy to predict the NAC response precisely. Furthermore, although many recent radiological processes using exciting new methods may be impressive, many methods involve costly machines, protocols, and programs, and difficult techniques that are not possible in real clinical practice. Therefore, in this study, we evaluated MRI methods for determining the response of breast cancer to NAC, focusing on methods that are suitable for use in general clinical settings without special additional programs or protocols.
Diffusion-weighted imaging (DWI) is an MRI protocol widely used for breast cancer evaluation in general clinical settings. DWI can measure water diffusion and present information on tumor cellularity. DWI has been shown to increase the accuracy for discriminating between benign and malignant masses when added to dynamic contrast-enhanced MRI. As it can reflect changes in tumor cellularity, DWI can provide more accurate information about the NAC response than a change in tumor size.14-16 The apparent diffusion coefficient (ADC) values calculated from DWI are reported to correlate with several prognostic factors of breast cancer.17-19 However, there is some disagreement over the importance of ADC values, and the reported results vary. Furthermore, the most meaningful ADC values, such as minimum, maximum, or mean ADC values, differ according to the study design and method, and there is no standard ADC cutoff value for determining the response of breast cancer. For evaluating the response to NAC, most previous studies used ADC values acquired after the first or a few NAC cycles. If the early prediction of the NAC response on pretreatment imaging is possible, it would be effective for reducing the rate of ineffective NAC.
Thus, we investigated the use of the ADC difference value (ADC-diff), which is the difference between the maximum and minimum ADC values,20-22 for evaluating pretreatment MRI. A recent study demonstrated that ADC-diff reflects tumor heterogeneity and correlates with clinicopathologic and imaging prognostic factors of breast cancer more than other ADC values. 22 The purpose of this study was to determine whether pretreatment ADC-diff is effective for predicting the response of breast cancer to NAC.
Materials and Methods
Patients
Between December 2017 and December 2019, 47 breast cancer patients with pre- and post-NAC breast MRI were enrolled from our hospital database. Two patients had bilateral breast cancer, and, therefore, 49 cases of breast cancer were evaluated. Of these 49 cases, 43 underwent surgery in our hospital. Breast MRI analysis was performed by one radiologist with 10 years of experience in breast imaging.
Imaging Techniques and Interpretation
MRI was performed using a 1.5-T scanner (Signa Excite, GE Healthcare) equipped with a dedicated 8-channel bilateral breast coil. Images were acquired in the axial plane with the following sequences. T2-weighted (T2W) fat-suppressed fast spin-echo imaging with repetition time (TR)/echo time (TE), 4500/86 ms; flip angle, 90°; field of view (FOV), 280 to 360 mm; acquisition matrix, 320 × 256; number of excitations (NEX), 3; and slice thickness, 4.5 mm. Precontrast and postcontrast, T1-weighted (T1W) 3-dimensional (3D) fast spoiled gradient-recalled echo sequence with parallel volume imaging (VIBRANT, GE Healthcare) with TR/TE, 6.6/3.2 ms; flip angle, 10°; FOV, 280 to 360 mm; acquisition matrix, 360 × 360; NEX, 0.8; and slice thickness, 1.1 mm. DWI using spin-echo single-shot echo-planar imaging with b values of 0 and 1000 s/mm2, TR/TE, 4000/61.6 ms; FOV, 280 to 360 mm; acquisition matrix, 90 × 128; NEX, 6; slice thickness, 4.5 mm; and gap, 0.6 mm. DWI was obtained in each of 3 orthogonal directions along the x, y, and z axes. Images from each direction were combined to produce a single image at each slice location showing the diffusion-restricted area. The signal intensities of all three directions were combined (Scmb) so that Scmb = {Sx·Sy·Sz}/3, where Sx, Sy, and Sz are the signal intensity values of the three orthogonal directions. Short T1 inversion recovery was used as a fat suppression technique in MRI, including DWI. The average scan time of DWI was 4 min. ADC values were calculated according to the following formula: ADC = [1/ (b2 − b1)]ln(S1/S2), where S1 and S2 are the signal intensities in the ROIs obtained from the two gradient factors b2 and b1 (b1 = 0 and b2 = 800 s/mm2 for the 1.5 T scanner). Gadolinium-based contrast agent was administered as an intravenous bolus injection (0.2 mmol per kg body weight) at 3 mL/s, and imaging was performed before the injection and 4 times after the injection over a period of 7.3 min. The image postprocessing included subtraction of unenhanced images from enhanced images, sagittal reformations, and 3D maximum intensity projections using the first contrast-enhanced series. Interpretation of the extent and patterns of enhancement was performed by visual assessment. One breast radiologist (with 10 years of experience) reviewed the MRI images of breast cancer. The vertical and horizontal dimensions of the masses were measured on the image section showing the largest mass on early enhancement T1W images, and the largest diameter among the vertical and horizontal dimensions was recorded. The tumor size was measured on MRI images before and after NAC, and the NAC response was evaluated based on the size change, according to RECIST 1.1; a size increase of 20% or more was defined as progressive disease (PD), a partial response for a size reduction of 30% or more, a complete response for disappearance of all lesions, and both PR or PD as stable disease (SD). 23 The ADC values of the masses were measured by manually placing ROIs within a mass on the ADC maps. Axial ADC maps representing the largest diameters of the masses were selected for ROI placements. Multiple ROIs of 17 to 23 mm2 were placed within the mass, with as many as possible being used 24 (Figure 1D). Regions of interest were carefully placed to avoid cystic areas, necrotic areas, and visual DWI artifacts. The lowest ADC value from the multiple ROIs was regarded as the minimum ADC value and the highest ADC value as the maximum ADC value. The difference between the maximum and minimum ADC values was recorded as ADC-diff. A high-signal rim surrounding a mass was recorded as a positive DWI rim sign, irrespective of whether it was complete or incomplete. 24
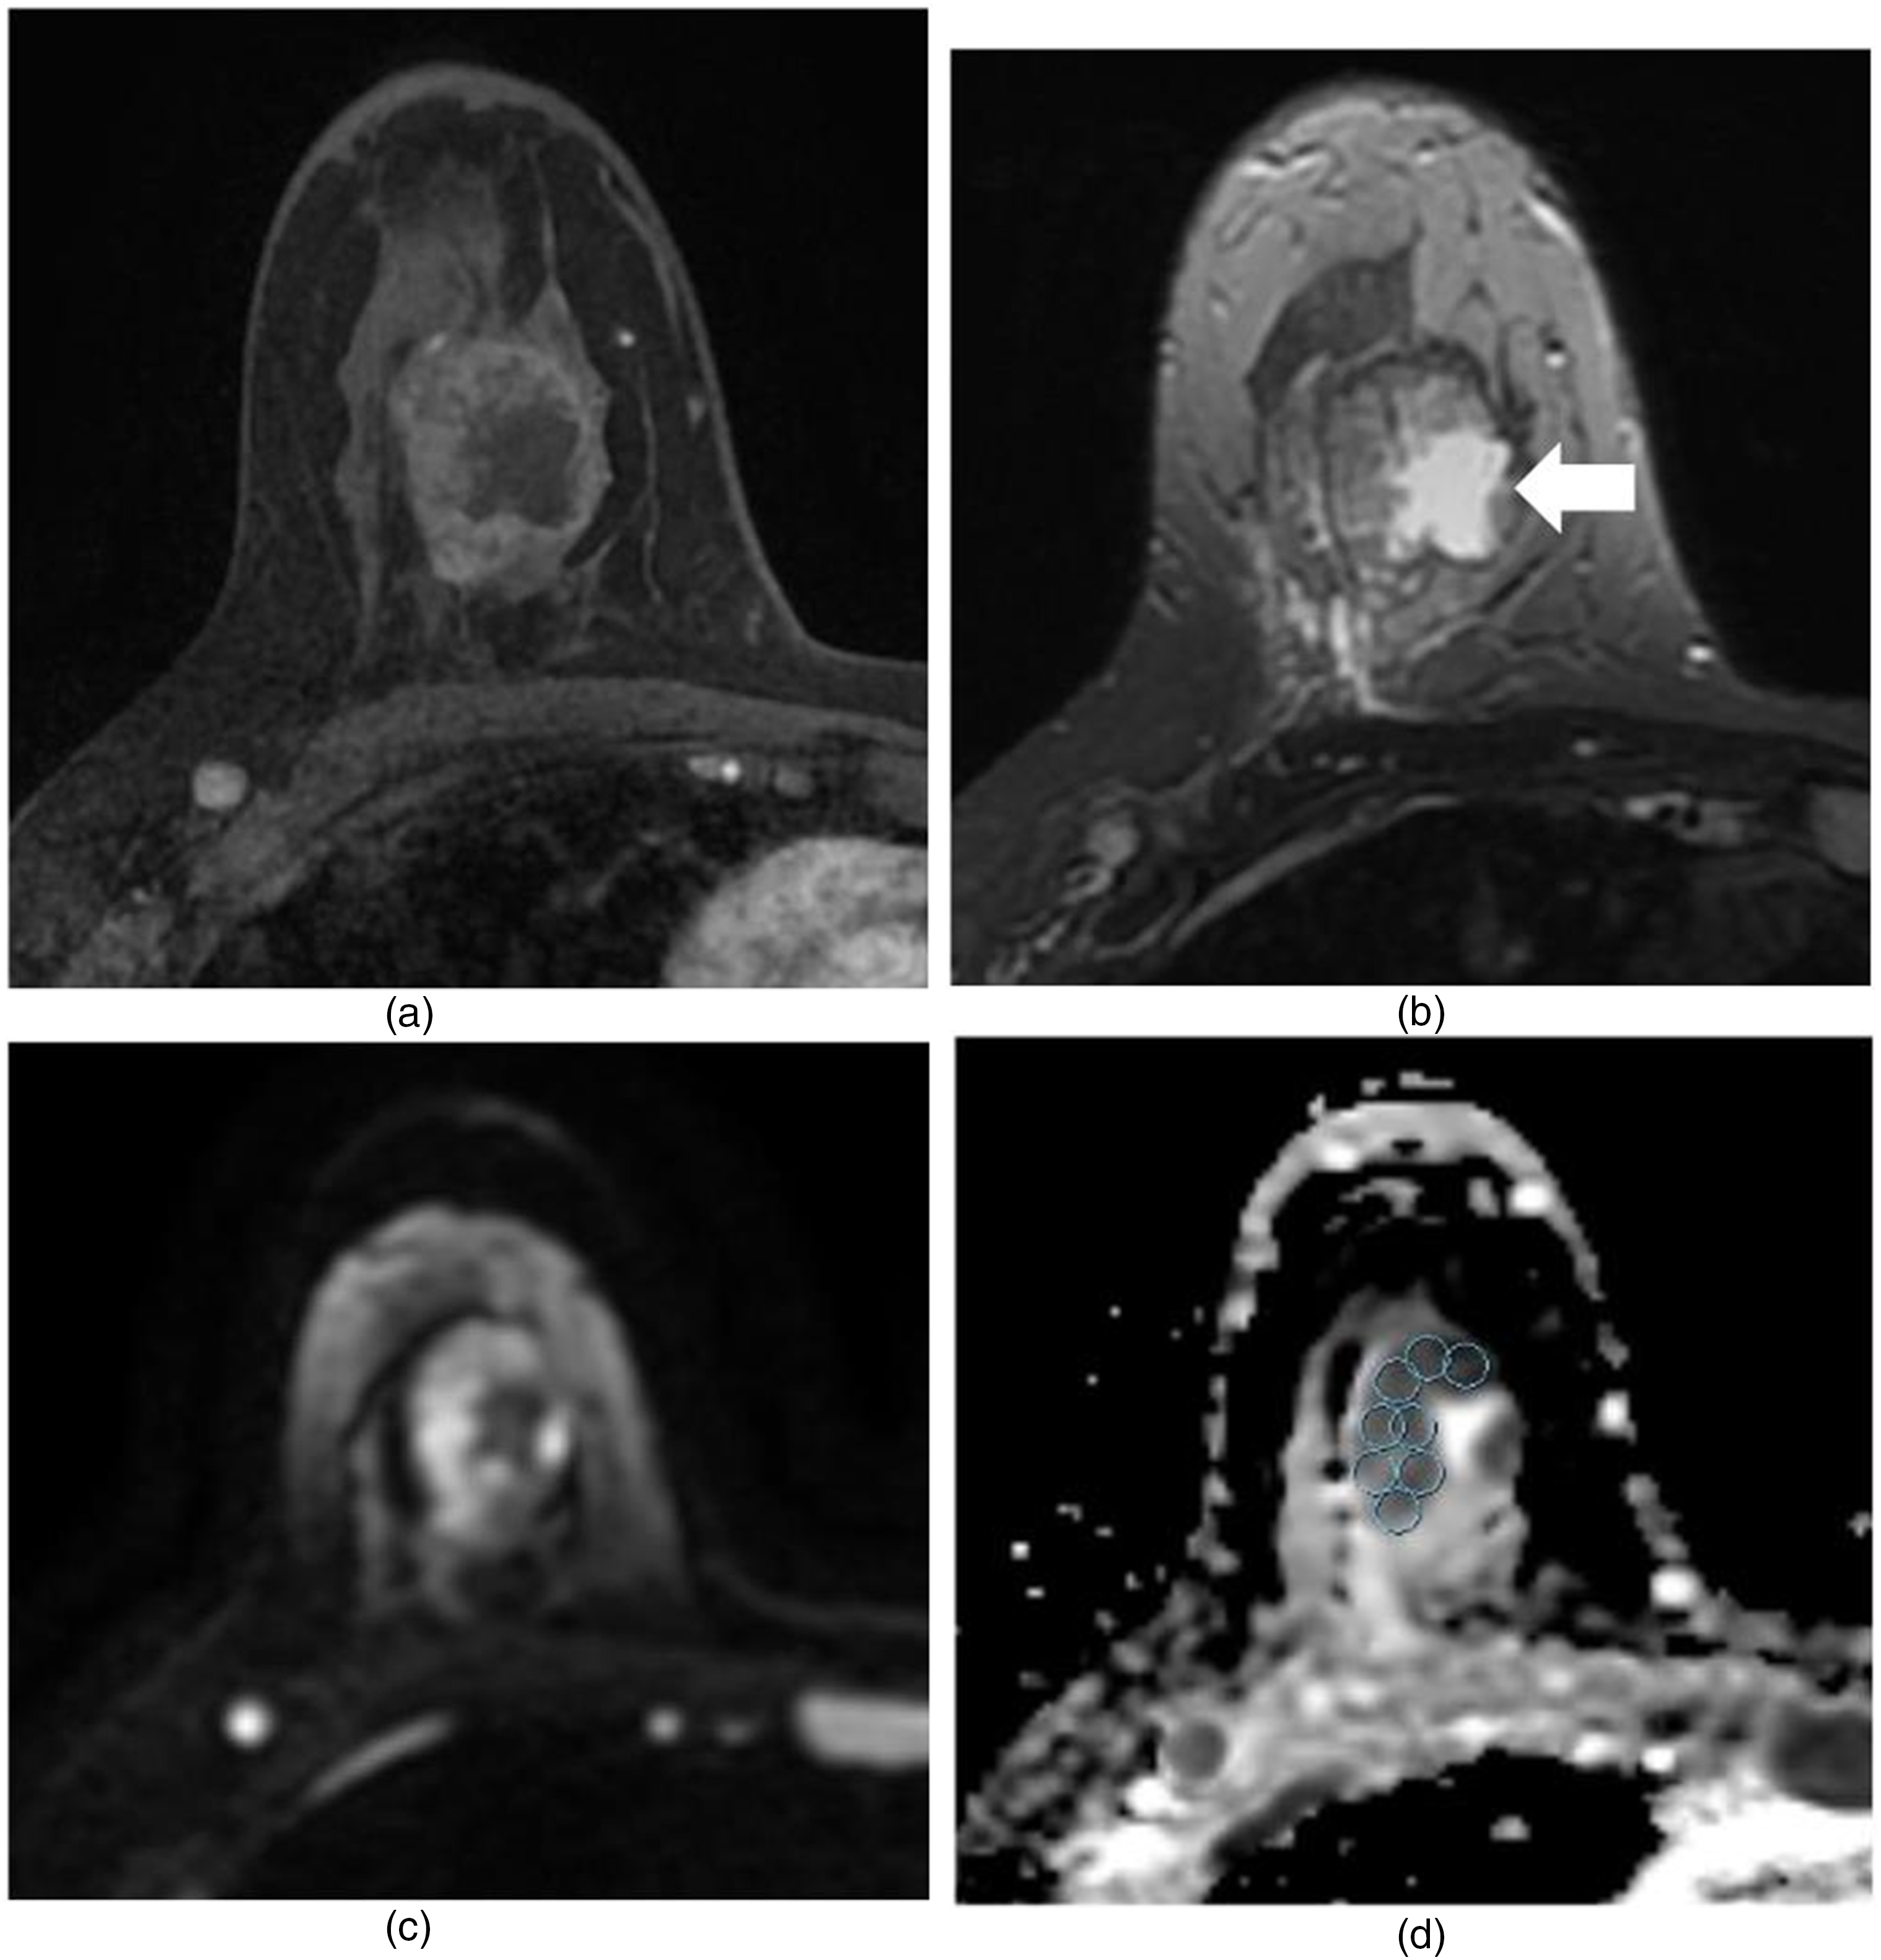
MR images in a 43-year-old-woman who underwent X (NAC) for invasive ductal carcinoma, and who experienced a pathologic complete response. (a) and (b) Pre-NAC transverse contrast-enhanced T1-weighted (a) and T2-weighted (b) images. In (a), heterogeneous enhancing mass with a maximal diameter of 3.4 cm is noted. In (b), there is a central T2 high-signal intensity area in the mass, representing cystic or necrotic area (arrow). (c) and (d) Pre-NAC DWI (c) and ADC map (d). (d) Multiple ROIs of 20.31 mm2 were manually placed within the mass avoiding cystic or necrotic area. Minimum ADC value was 446 × 10−6 mm2/s, and the maximum ADC value was 1182 × 10−6 mm2/s. The calculated ADC difference was 736 × 10−6 mm2/s. After NAC, there was no enhancing mass in Rt. breast at contrast-enhanced MRI, suggesting complete response (not shown). Pathologic result after Rt. breast modified radical mastectomy showed no residual invasive tumor, suggesting complete response.
Histopathologic Analysis
Pathological records from core needle biopsy, breast-conserving surgery, or mastectomy specimens were reviewed. Final pathological reports were determined for specimens obtained at the final procedure. Immunohistochemistry staining tests were used to determine the expression of the following molecular markers: estrogen receptor (ER), progesterone receptor (PR), human epidermal growth factor receptor 2 (HER-2), and Ki-67. ER and PR positivity were defined as the presence of 10% or more positively stained nuclei in 10 high-power fields. The intensity of c-erbB-2 staining was scored as 0, 1+, 2+, or 3+. Tumors with 2+ or 3+ scores were classified as HER-2 positive, whereas tumors with a score of 0 or 1+ were classified as negative. The molecular subtype was classified as luminal (ER-positive/PR-positive/HER-2 negative), HER-2 enriched (ER-negative/PR-negative/HER-2 positive), or triple negative (ER/PR/HER-2 negative). Ki-67 was assessed as a percentage, and with reference to the study of Surov et al, 25 a Ki-67 value of ≥25% was defined as high expression, whereas a value of <25% was defined as low expression. The pathological cancer size was measured as the invasive focus of the mass in the surgical specimen. In the final pathology report after surgery, cases with DCIS or no invasive tumor cells were classified as pathologic complete response (pCR) group and other cases were classified as the non-pCR group.
Statistical Analysis
Data were analyzed using PASW statistics 18.0 (IBM). The Kolmogorov–Smirnov test was used to test for normality in the numerical data. Associations between ADC values and clinicopathological and imaging characteristics were evaluated with t-tests. A p-value of <.05 was considered statistically significant.
Results
Patient Characteristics
The mean age of the 47 breast cancer patients was 53 years (range, 32-83 years). The mean tumor size of the 49 pretreatment breast cancer lesions was 5.2 cm. The mean tumor size on posttreatment MRI was 3.3 cm. There was a significant difference between pretreatment tumor size and post-treatment tumor size in the paired sample t test (p = .0).
Clinicopathological and Imaging Characteristics
For clinicopathological characteristics, we analyzed for tumor histological type, Ki-67, tumor molecular type (ER±), and for imaging characteristics, high-signal rim sign on DWI was evaluated (Table 1). The most common findings were invasive ductal carcinoma, not otherwise specified type.
Clinicopathologic and Image Characteristics of the Included Breast Cancer Cases (n = 49).

Abbreviations: NOS, not otherwise specific type; CR, complete response; PR, partial response; SD, stable disease; PD, progressive disease.
Associations Between ADC Values With Clinicopathological, Image Characteristics, and Response Evaluation After NAC
Table 2 demonstrates the associations of minimum, maximum, mean ADC value, and ADC-diff with clinicopathological, image characteristics, and response after NAC. ADC-diff was correlated with the change in tumor size after NAC. ADC-diff was high in complete response (CR) and partial response (PR) cases, when evaluated on breast MRI (p = .002) (Figures 1 and 2). ADC-diff correlated with the DWI high-signal rim sign, with a positive rim sign being associated with a higher ADC-diff (p = .02). ADC-diff was high in ER + type than ER − type, with partial statistical correlation (p = .05). There was no correlation between ADC-diff and ki-67 and pCR status.
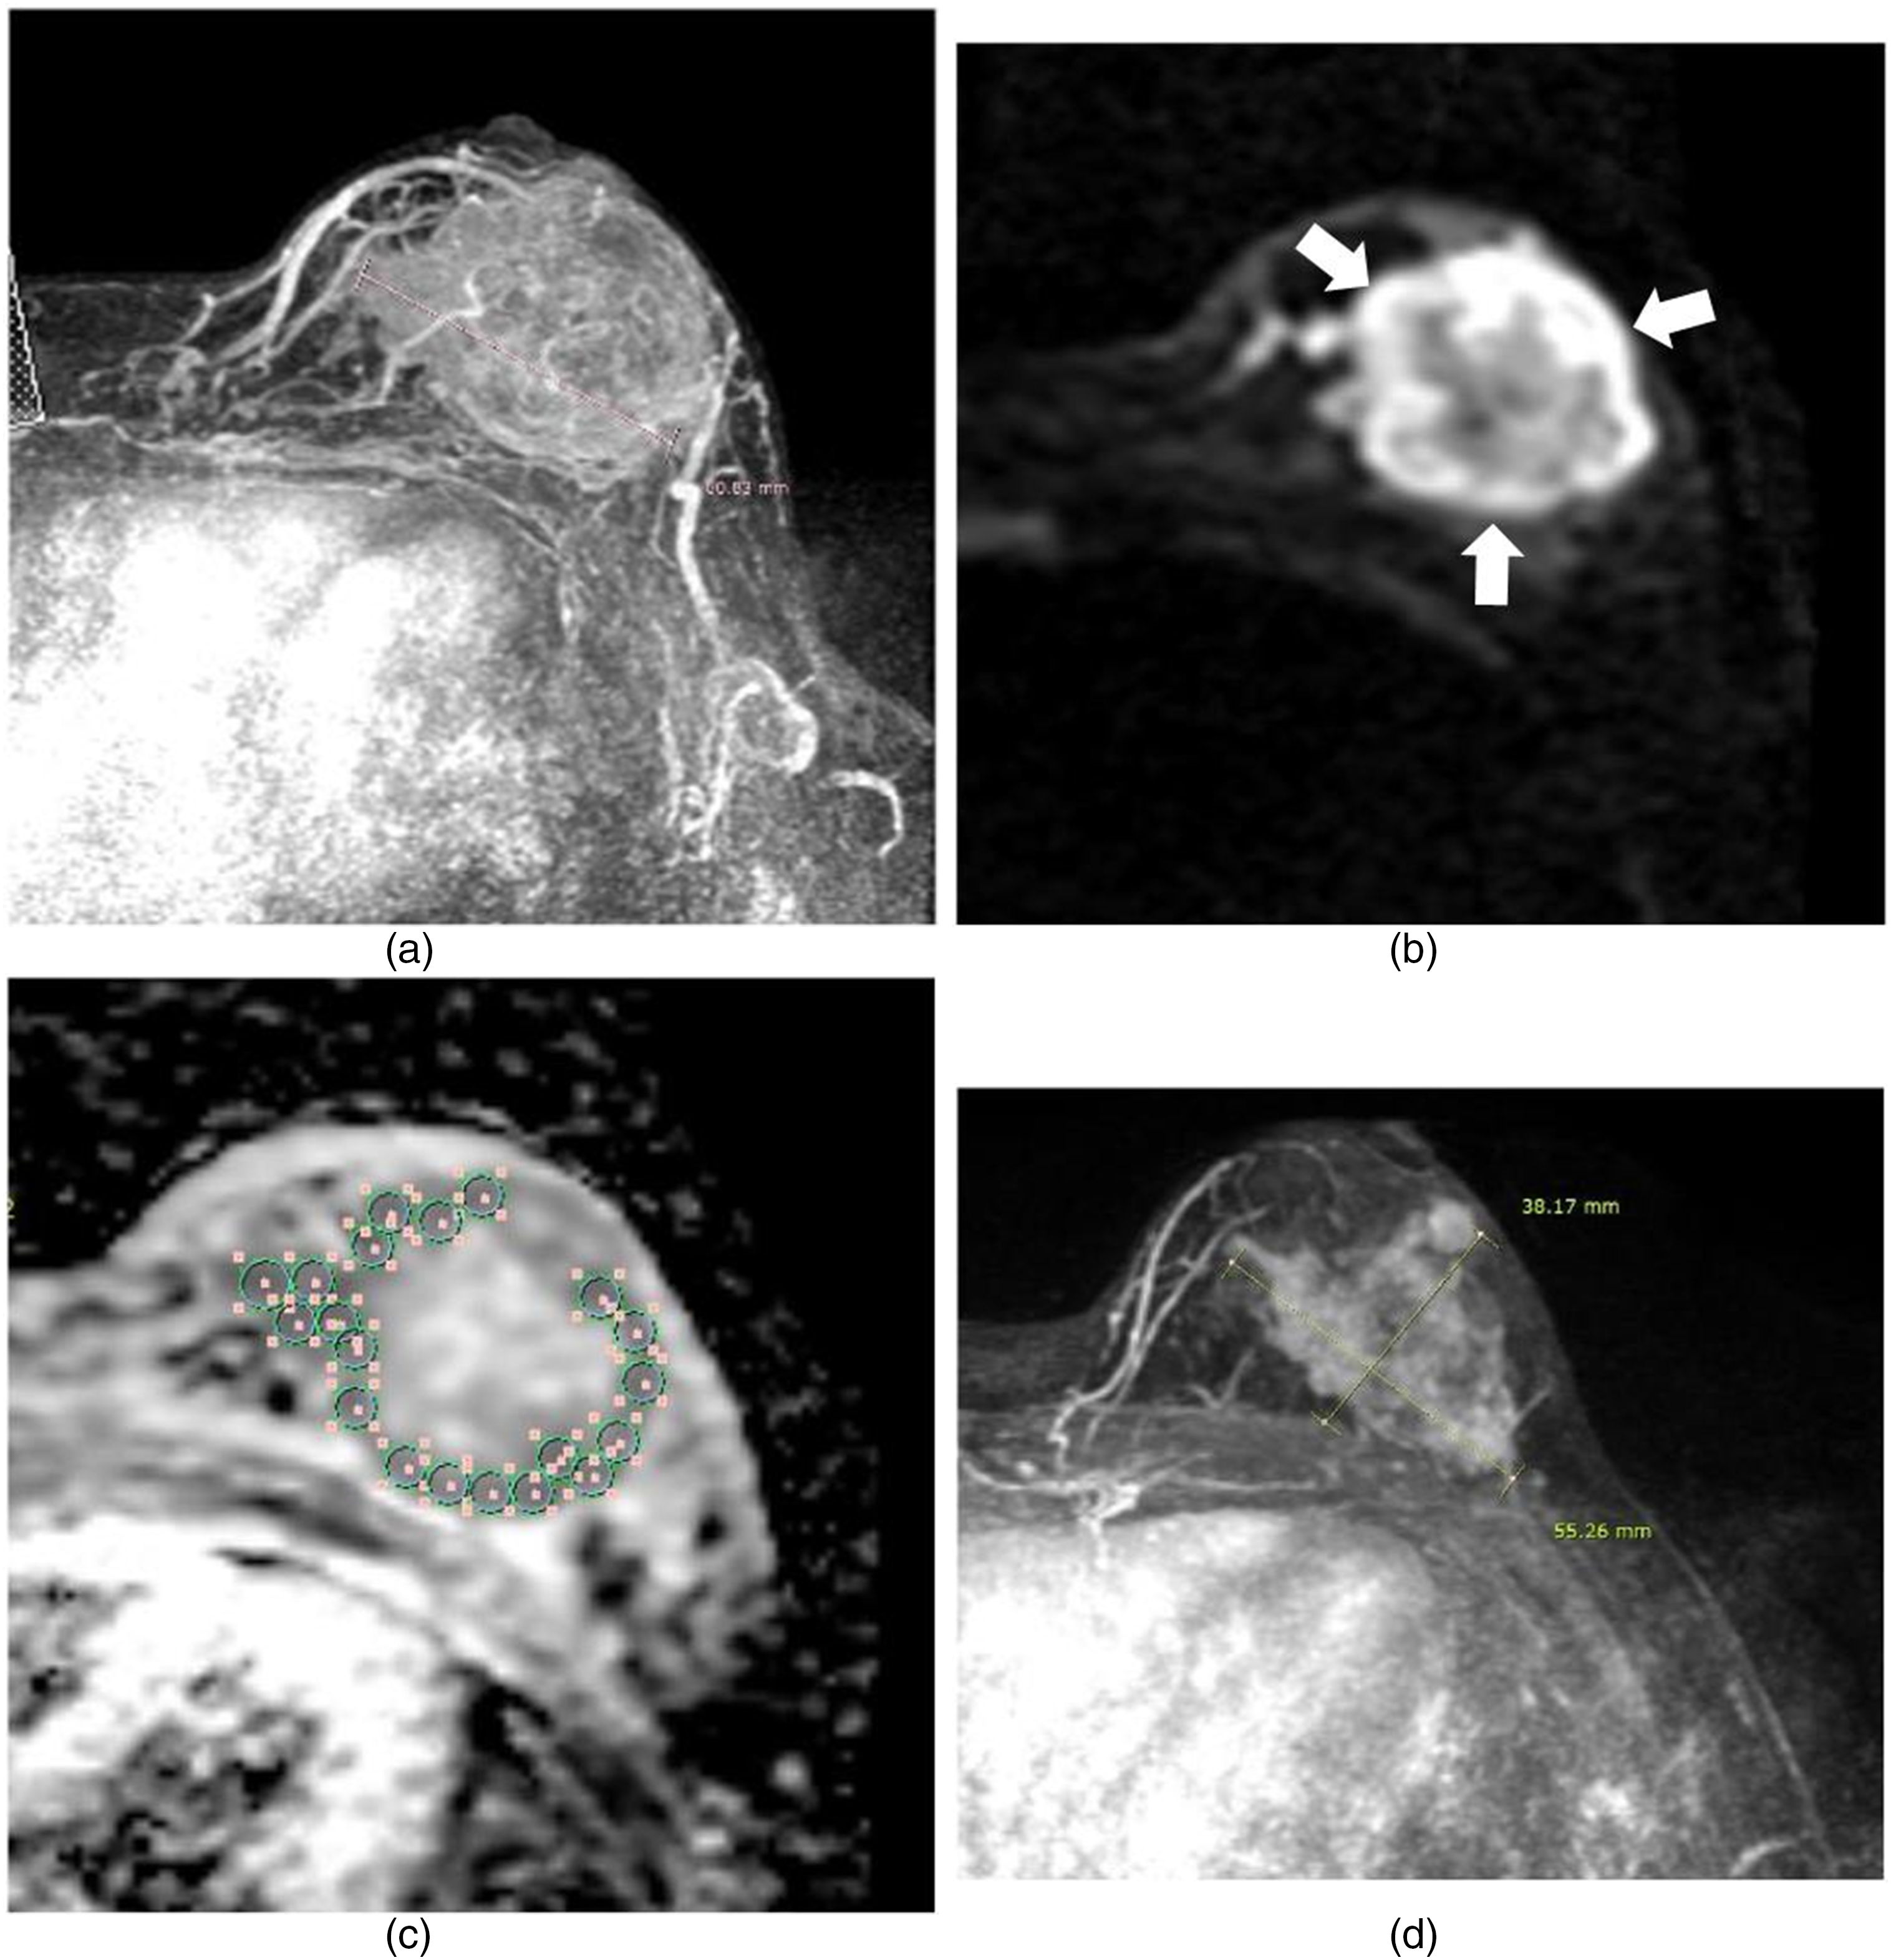
MR images in a 41-year-old woman who underwent NAC for invasive ductal carcinoma. (a) Pre-NAC MIP image shows about 6.1 cm mass in Lt. breast. (b) and (c) Pre-NAC DWI (b) and ADC map (c). In (c), a high signal intensity rim around the mass is noted (arrows). (d) Multiple ROIs of 20.31 mm2 were manually placed within the mass at the area corresponding to DWI high-ADC low signal intensity. Minimum ADC value was 1120 × 10−6 mm2/s, and maximum ADC value was 1338 × 10−6 mm2/s. The calculated ADC difference was 218 × 10−6 mm2/s. (d) Post-NAC MIP image. In (d) maximal diameter of the mass was 5.5 cm, suggesting a stable disease. At histologic analysis on Lt. breast specimen after modified mastectomy, the size of invasive cancer was 3.5 cm.
Associations Between Pre-NAC ADC Values and Response After NAC, Clinicopathological, Image Characteristics (t-Test).

Abbreviations: CR, complete response; PR, partial response; SD, stable disease; PD, progressive disease; DWI, diffusion-weighted imaging; ER, estrogen receptor.
Discussion
NAC is known as a standard treatment for locally advanced breast cancer, with the potential to reduce the size of the inoperable tumor, thereby facilitating local surgery or radiation therapy. However, it is reported that 2% to 30% of patients do not benefit from NAC. 3 The ability to predict the response to NAC is important so that those patients who are unlikely to benefit from it can avoid unnecessary treatment. In particular, it would be highly desirable to be able to predict the NAC response from pre-NAC imaging.
Most studies investigating the imaging characteristics of the response of breast cancer to NAC have evaluated images acquired after the first or several cycles of NAC, not pre-NAC images. Among the breast MRI protocols used, many studies have achieved good results with DWI. The ADC values calculated from DWI can be a sensitive measure of the response of the cellular microenvironment to cytotoxic drugs. 26 DWI does not involve a contrast injection, which is a strong merit of the technique. Among previous studies using ADC values to evaluate the NAC response, Pereira et al 26 demonstrated that a pCR group showed a higher ADC value change than a non-pCR group at midterm of the NAC. Studies on pre-NAC images are rare, although Park et al 27 reported that cancer with low-ADC values on pretreatment imaging showed a good response to chemotherapy. They also reported that masses with high-ADC values were low cellularity masses containing necrosis, which were less sensitive to chemotherapy because of the hypoxic tumor environment. However, the correlation between ADC value on pretreatment imaging and pCR remains controversial. Some studies reported that breast cancer with a low-ADC value on pretreatment MRI showed a better response to NAC, whereas other studies reported that the ADC value alone is insufficient to predict pCR.28-30 Nevertheless, the author believes that pretreatment MRI is important for NAC response evaluation. Yuan et al 31 reported that baseline ADC values were different between pCR and non-pCR groups in all breast cancer subtypes. They also demonstrated that in the case of the non-pCR group, there was more necrosis and more destruction of normal blood vessels, so the ADC value was higher due to the increase in free diffusion molecules. In our study, the minimum, maximum, and mean ADC values of pCR were higher than non-pCR, but the difference was not statistically significant (Table 2). The reason for the different results about the relationship between ADC values and pCR seems to be as follows. There is currently no standard procedure for the use of ADC values for defining benign or malignant lesions, and this lack of standardized ADC value measurements creates discrepancies across study results. In this study, we used ADC-diff to reduce discrepancies in ADC values. As ADC-diff is the difference between the max ADC value and minimum ADC value, we could reduce bias from different measurement methods as long as the measurement methods for max and minimum ADC value are the same as those used in the present study. As ADC-diff can reflect the heterogeneity of tumor cellularity, it may be a suitable parameter for the prediction of the NAC response on pretreatment imaging.
Breast cancer can be very heterogeneous with respect to its histopathologic, molecular, and functional characteristics. Intertumoral heterogeneity (ITH) is a major indicator of tumor aggressiveness and treatment resistance, and ITH is a new viewpoint for the early prediction of treatment outcome and long-term survival of cancer.32,33 Many previous studies using DCE-MRI of breast cancer reported tumor heterogeneity. Studies on the morphologic and spatial characteristics of breast cancer demonstrated that a rim enhancement pattern or peritumoral edema was related to the survival or prognosis of breast cancer patients.10,34 A large tumor size and a heterogeneous enhancement pattern on MRI are reported to be related to gene expression and poor prognosis.35,36 Asharf et al. 4 studied the kinetic heterogeneity of breast cancer after NAC and found that the NAC responder group showed pronounced enhancement, rapid washout, and heterogeneous contrast uptake, with the more aggressive phenotype having further-progressed neoangiogenic properties.
In our study with ADC-diff, masses with a larger ADC-diff showed a greater size reduction rate after NAC than masses with a smaller ADC-diff (mean ADC-diff on MR CR, PR group; 420 vs mean ADC-diff on MR stable disease [SD], progressive disease [PD] group; 238, p < .05). The patterns of signal differences on ADC maps reflecting cellularity differences were noted as a heterogeneous signal on DWI and a thick/thin low-ADC-signal rim (high DWI signal). In particular, a thick/thin high rim-signal sign on DWI was statistically correlated with a high-ADC-diff (Table 2, p = .02). The DWI high rim-signal sign refers to a mass with a thick/thin peripheral rim with a high DWI signal and a relatively low signal at the mass center. The DWI rim sign has not been actively studied as yet, but Kang et al 24 demonstrated that a positive DWI rim sign is related to tumor malignancy. The cause of the high rim signal on DWI is not well established, and it is not correlated with rim enhancement on DCE-MRI. 24 Nevertheless, the high DWI rim signal sign might be related to tumor heterogeneity, and this sign can help to predict tumor size reduction after NAC. There are many complex factors determining the chemotherapy response, and it is difficult to predict the NAC response accurately. Alongside other important clinical factors, the ADC-diff and/or DWI rim sign can suggest important clues for NAC response determination.
The NAC response of breast cancer can differ according to the breast cancer subtype. Previous studies reported that triple-negative breast cancer (TNBC) showed a good NAC response in comparison with other subtypes.37,38 This may be because of the inflammatory cells of TNBC.37-39 Inflammatory cells are related to the sensitivity and response of chemotherapy, and also to survival after chemotherapy.37,38 TNBC is known to be strongly affected by inflammatory cells in comparison with other subtypes, and TNBC shows a high level of tumor-infiltrating lymphocytes. 39 In our study, there was no correlation between TNBC or other breast cancer subtypes and pCR. One of the reasons might be small cases of pCR (9 cases) compared to non-pCR (34 cases). Even though the result showed no relationship between breast cancer subtype and pCR, there was an interesting result about breast cancer subtype and ADC values. As we divided cancer subtypes as ER-positive group and -negative group, ADC-diff was larger in the ER-negative subtype group than in the ER-positive group (p = .039). Other ADC values were not related to the ER group. This result suggests that tumor heterogeneity is bigger in the ER-negative group. This result can give great information for in-depth studies about the breast cancer subtype.
There are several limitations to this study. First, there were difficulties in measuring ADC-diff on post-NAC MRI because in many cases the tumor size was too small to allow measurement of the ADC values. If a more detailed analysis method could be used, a comparison of ADC-diff between pre-NAC MRI and post-NAC MRI would be very helpful for determining the actual NAC response. Second, other factors that might affect the NAC response such as chemotherapy regimen were not considered. Third, although the ROIs for ADC value measurement were equal within the same masses, they were not equal between all masses because of variable mass size. Also, to avoid a central necrotic portion or cystic area in some masses, multiple smaller ROI circles should be applied, regardless of the mass size.
Conclusion
High-ADC difference value on pretreatment MRI can provide information for a better response of NAC on breast cancer.
Footnotes
Abbreviations
Declaration of Conflicting Interests
The author declared no potential conflicts of interest with respect to the research, authorship, and/or publication of this article.
Funding
The author received no financial support for the research, authorship, and/or publication of this article.