
Abstract
Objective:
To explore the value of diffusion-weighted imaging for early response detection of locally advanced esophageal squamous cell carcinoma with concurrent chemoradiotherapy.
Methods:
Fifty-five (42 males, 13 females) patients with locally advanced esophageal cancer who were undergoing chemoradiotherapy were recruited for this study. Diffusion-weighted imaging was performed in all patients before therapy, at the first weekend, the second weekend, and the end of chemoradiotherapy. The rate of change in apparent diffusion coefficient value and the maximum diameter between pretherapy and posttherapy were calculated.
Results:
Fifty-five patients with locally advanced esophageal squamous cell carcinoma were classified as responders (40 cases) and nonresponders (15 cases). Before chemoradiotherapy, the responders group had a significantly lower apparent diffusion coefficient values than the nonresponders group (t = −4.815, P = .000). At the 3 time points after chemoradiotherapy (first weekend, second weekend, and the end of chemoradiotherapy), there was no statistically significant difference in apparent diffusion coefficient values between responders and nonresponders (P > .05). The responders group had a significantly higher rate of change in apparent diffusion coefficient value than the nonresponders group at each time point (P < .05). At the first weekend of chemoradiotherapy, the rate of change in the maximum diameter was not significantly different in the 2 groups (t = 0.928, P = .357). There was a negative correlation between the tumor apparent diffusion coefficient value of pretherapy and the reduction ratio of tumor maximum diameter at the end of chemoradiotherapy (r = −0.592, P = .000).
Conclusions:
The change rate of apparent diffusion coefficient value by the end of the first week after beginning chemoradiotherapy may be a sensitive indicator to detect the early response to locally advanced esophageal squamous cell carcinoma.
Keywords
Introduction
As a common malignant tumor in the world, esophageal cancer is the fourth most common cause of cancer deaths. 1 Esophageal cancer occurs frequently in China, mainly includes esophageal squamous cell carcinoma (ESCC) and adenocarcinoma in accordance with the histopathological appearance of tumor tissues, and more than 90% of cases present as ESCC in Asian countries. Most patients are diagnosed in the middle or advanced stage, which often brings certain difficulty to treatment. Chemoradiotherapy (CRT) is currently regarded as the standard treatment for locally advanced esophageal carcinoma with or without surgery, which could improve locoregional control and overall survival rates of the tumor. 2 However, there is a difference in sensitivity to the treatment for esophageal carcinoma among different patients. Therefore, early detection and assessment of the response would be essential for the choice and adjustment of subsequent therapeutic managements at an early time of CRT.
Currently, monitoring the response to therapy is usually achieved by monitoring the tumor size at computed tomography or magnetic resonance imaging (MRI), which includes measurement of tumor length, area, and volume. However, these techniques evaluate therapeutic effect mainly through morphological changes in tumors, which is not good for the formulation and modification of the treatment programs since it is unable to evaluate the therapeutic effect of CRT for esophageal cancer at an early time. Diffusion-weighed magnetic resonance imaging (DW-MRI) may observe the physiological and pathological changes in tumors at a microscopic point of view, such as changes to the microenvironment before and during the treatment. 3 Diffusion-weighed MRI can be quantitatively analyzed by measuring apparent diffusion coefficients (ADCs), a quantitative index that reflects the cell organization, size, and density of tissues. Previous studies have reported that ADC has the potential value in early predicting or evaluating the therapeutic effect of CRT for esophageal cancer. 4 -6 This study was designed to investigate the value of ADC in early predicting or evaluating the therapeutic effect of CRT for esophageal cancer.
Materials and Methods
Study Population
As a retrospective study, the requirement for the institutional review board and informed consent was waived. A total of 55 (42 males, 13 females) consecutive patients with locally advanced ESCC (clinical stage T3 to T4) were included between September 2014 and September 2018. The inclusion criteria for patients were as follows: (1) all the patients were diagnosed by esophagoscopy biopsy at 1 week before MRI, (2) all the patients underwent conventional MRI and DWI scans, (3) all the patients underwent concurrent CRT, (4) with no history of tumors previously, and (5) without chemotherapy or radiotherapy previously. The exclusion criteria for patients were as follows: (1) with contraindications for MRI examination, (2) unfinished 4 times of MRI examination, and (3) treatment interruption or patient died during treatment.
Treatment Protocol
All patients underwent CRT. The CRT treatment regimen consisted of nedaplation (30 mg at day 1 to day 4) and docetaxel (60 mg at day 1 and day 8) for 5 weeks with concurrent radiotherapy (50 Gy in 25 fractions of 2 Gy). The therapeutic effect was assessed according to the Response Evaluation Criteria in Solid Tumours (RECIST). 7 Patients were divided into 2 groups, responders and nonresponders, using RECIST assessment. The former included patients with complete response and partial response, while the latter included patients with stable disease and progressive disease.
Magnetic Resonance Imaging Technique
All patients were examined with a 3.0-T MR whole-body imager (Signa EchoSpeed Plus with EXCITE; GE Medical Systems) with a 33mT/m maximum gradient capability and equipped with an 8-channel phased-array body coil. Patients were in the supine position on a flat table top. The conventional esophagus MRI protocol included: (1) T1WI axial scan (TR: 140 milliseconds; TE: 2.5 milliseconds; matrix, 256 × 256; field of view (FOV), 36 × 36 cm; layer thickness, 6.0 mm; and interlayer interval, 20%), (2) T2WI axial scan (TR: 1580 milliseconds; TE: 72 milliseconds; matrix: 384 × 276; FOV, 350 × 350 mm; slice thickness: 5.0 mm; gap:0.5 mm), and (3) DWI axial scan (TR: 6800 milliseconds; TE: 70 milliseconds; matrix: 128 × 128; FOV: 400 × 400 mm; slice thickness: 5.0 mm; and gap: 0.5 mm). Two different diffusion-sensitive factors were simultaneously collected during the scans: b = 0, and 700 s/mm2.
Magnetic Resonance Imaging Analysis
The image quality of DWI was sufficient to identify the tumor region in all patients. Magnetic resonance images were analyzed in consensus by 2 experienced radiologists. The following parameters were measured and recorded: lesion size, location, number, and mean ADC. The lesion size was recorded by the mean maximum diameter (Diamax) of the tumor, which was calculated by the Diamax of tumor of all levels. The lesion location and number were observed on the axial T1-weighted, T2-weighted, and DW-MRI. The region of interest (ROI) was manually drawn in the MRIs according to T2-weighted imaging. The ROI was placed to include the whole target lesion on the ADC map and exclude the necrotic tissues in the tumor according to T1- and T2-weighted imaging. The change rate of ADC (△ADC) was calculated by △ADC = (ADCx − ADC0)/ADC0 × 100%, where ADC0 was the ADC value tumor before CRT and x was a time point during or after CRT. The rate of change in the Diamax (△Dia) was also calculated by △Dia = (Dia x − Dia0)/Dia0 × 100%, where Dia0 was the maximum diameter of the tumor before CRT and x was a time point during or after CRT.
Statistical Analysis
All statistical analyses were performed using SPSS (version 19.0) software (IBM Corporation) and Microsoft Office 2010 software for Windows (Microsoft Corporation). The results were expressed as the mean ± SD. All data in our study were conducted by normality test. Paired-sample t test was used to analyze the difference in ADCs between responders and nonresponders and high pretherapy ADC group and low pretherapy ADC group before treatment. One-way analysis of variance was used to analyze the difference in ADCs between responders and nonresponders at pretherapy, 1 week, and 2 weeks after CRT. Receiver operator characteristic (ROC) curves were performed for assessing the diagnostic performance of ADCs for the prediction of early response to short-term effect of CRT at different time points. A level of P < .05 was considered statistically significant.
Results
Apparent Diffusion Coefficient Value and Clinicopathologic Variables of Esophageal Cancer
Before CRT, the demographic data of the 55 patients with esophageal cancer were included in the study, 42 were male and 13 were female. The age ranged from 41 to 87 (median: 62) years. The tumor primary site distribution was upper thoracic (25 patients), middle thoracic (20 patients), and lower thoracic (10 patients). The lesion length before CRT ranged from 1 to 10.0 cm (median: 5 cm); 35 and 20 patients were determined to be at theT3 and T4 stage, respectively. Forty-two patients were assigned to be at the N0 stage and 13 patients were at the N0 stage (Table 1). The average ADC value of the esophageal cancer tissue was 1.40 × 10⁻³ mm2/sec. According to RECIST, 40 patients were responders and 15 patients were nonresponders following CRT. The ADC values were measures at the four time points (pretherapy, 1st weekend, 2nd weekend and posttherapy) (Figure 1).
Apparent Diffusion Coefficient Values and Clinical Variables in 55 Patients With Esophageal Cancer.
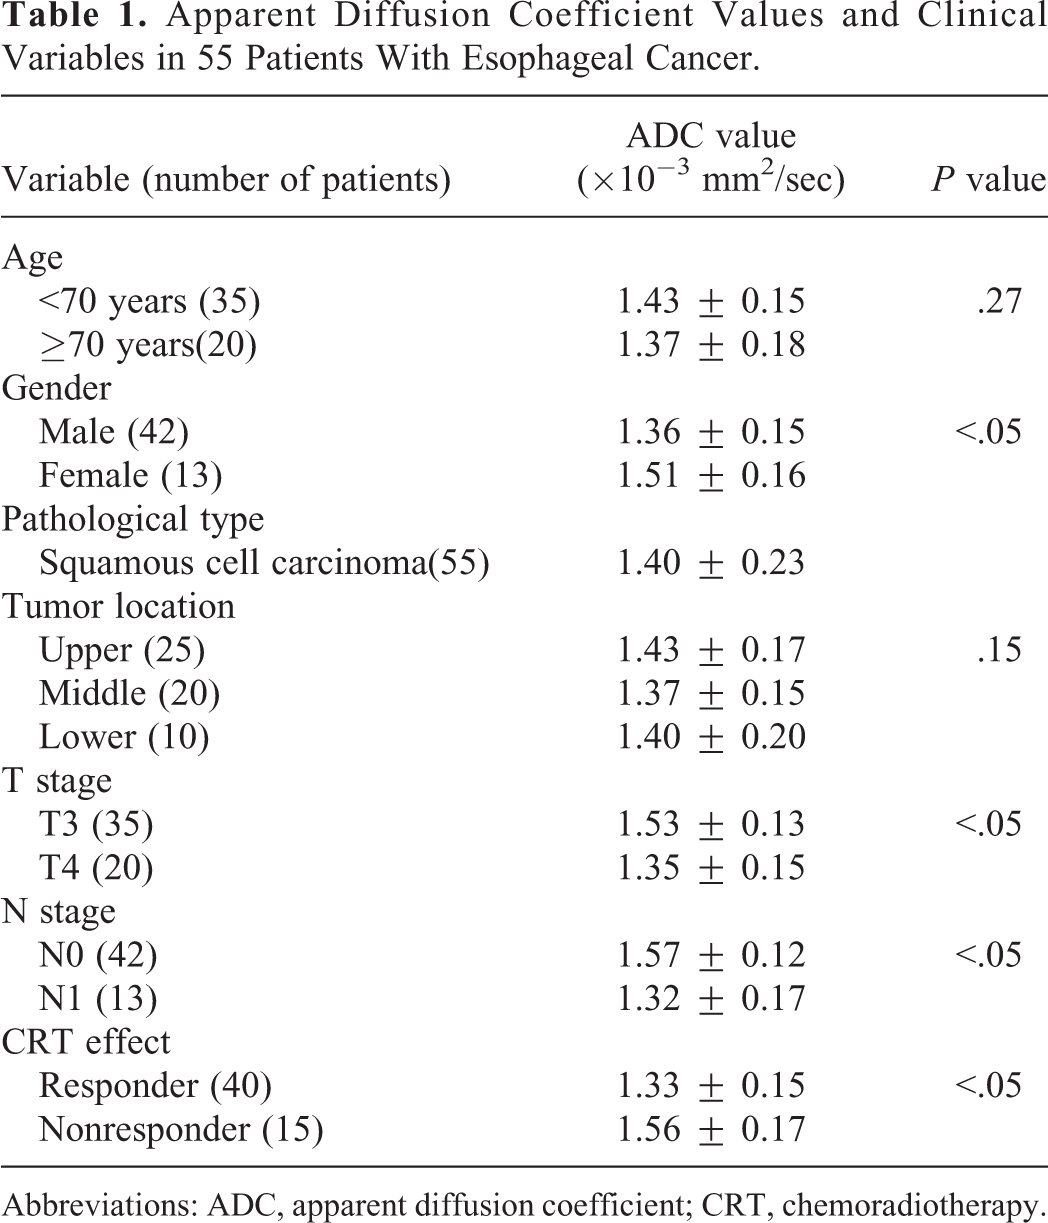
Abbreviations: ADC, apparent diffusion coefficient; CRT, chemoradiotherapy.

Images of a 71-year-old female patient with upper esophageal squamous carcinoma of the middle histological differentiation. A, Axial fast spin-echo T2-weighted MR images at 4 time points. B, Axial DW-MRI with b = 700 s/mm2 at 4 time points. C, Resulting axial ADC maps calculated from different DW images at 4 time points. Tumor mean ADCs were 1.13 × 10⁻³ mm2/s before therapy, 1.58 × 10⁻³ mm2/s at the first weekend of CRT, 1.83 × 10⁻³ mm 2 /s at the second weekend of CRT, and 2.35 × 10⁻³ mm2/s after therapy. The ADC of the tumor showed a slight shift at the first weekend of CRT. At the second weekend of CRT, the ADCs showed a clear shift to higher values, and the ADCs were reduced after CRT. ADC indicates apparent diffusion coefficient; CRT, chemoradiotherapy; DW-MRI, diffusion weighted-magnetic resonance imaging.
Comparison of △ADC Values Between High Pretherapy ADC Group and Low Pretherapy ADC Group
The statistical distribution of the pretherapy ADC value (mm2/s) of the EC tissues was 1.40 ± 0.19, with a median of 1.37. Based on the median of the pretherapy ADC values, low ADC (≤1.37 mm2/s, 28 patients) and high ADC (>1.37 mm2/s, 27 patients) groups among the 55 patients were classified. Significant differences were found in △ADC values between the high pretherapy ADC group and low pretherapy ADC group at the first weekend, second weekend, and the end of CRT (P = .000, P = .019, P = .002; Table 2).
Comparison of △ADC Values Between the High Pretherapy ADC Group and Low Pretherapy ADC Group.
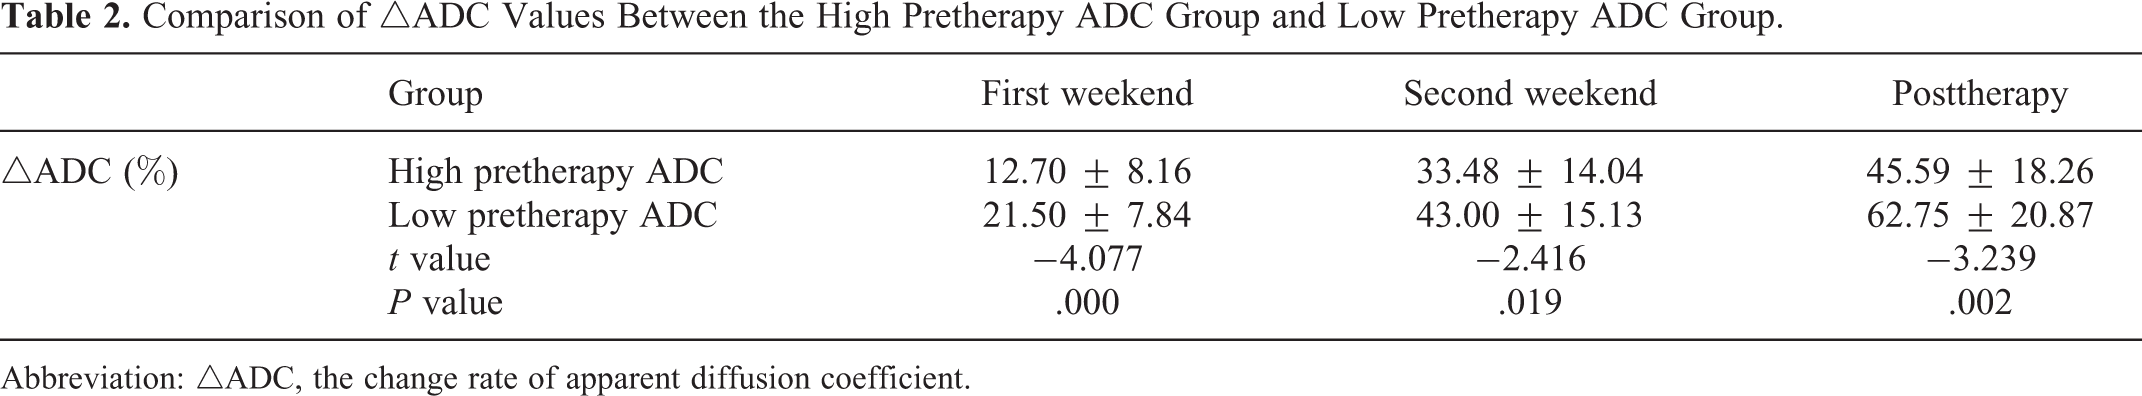
Abbreviation: △ADC, the change rate of apparent diffusion coefficient.
Comparative Analysis of ADC Value Changes Between Responders and Nonresponders
Table 3 shows the comparisons of ADC and △ADC values between responders and nonresponders. Before CRT, the responders group had a significantly lower ADC value than the nonresponders group (t = −4.815, P = .000). At the 3 time points after CRT (first weekend, second weekend, and posttherapy), there was no statistically significant difference in ADC values between responders and nonresponders (P > .05). But, the responders group had a significantly higher △ADC values than the nonresponders group (P < .05).
Comparisons of ADC and △ADC Values Between the Responders and Nonresponders.
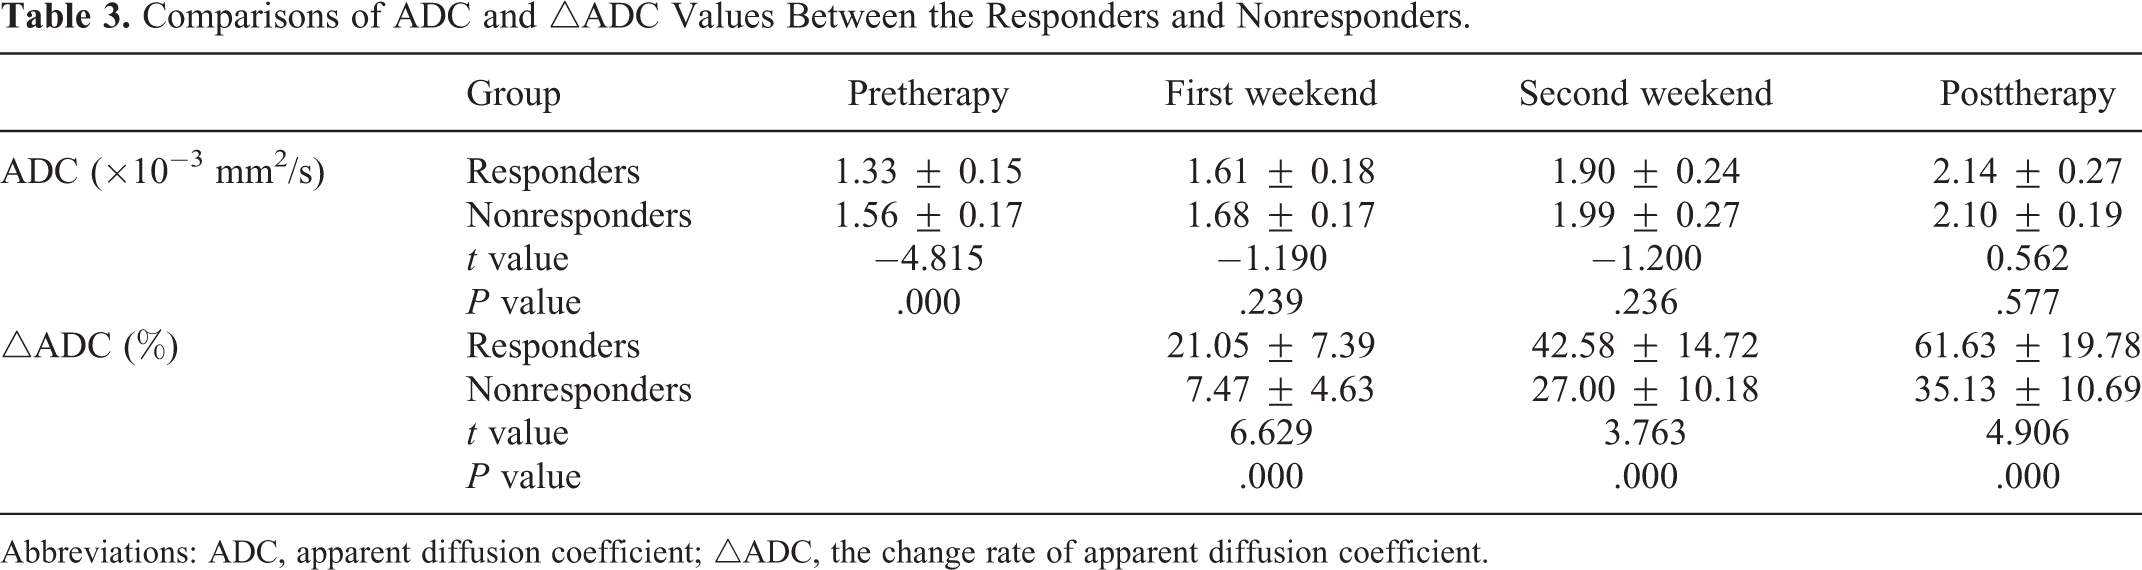
Abbreviations: ADC, apparent diffusion coefficient; △ADC, the change rate of apparent diffusion coefficient.
Comparative Analysis of the Diamax Changes Between Responders and Nonresponders
Table 4 shows the Diamax and △Dia of the tumor between the responders and nonresponders. Before CRT and at the first weekend of CRT, there were all no statistically significant differences in Diamax between responders and nonresponders (P > .05). And, at the second weekend and the end of CRT, there was a statistically significant difference in Diamax between responders and nonresponders (P < .05). At the first weekend of CRT, there was no statistically significant difference in △Diamax between responders and nonresponders (P > .05). But, at the second weekend and the end of CRT, the responders group had a significantly higher △Diamax than the nonresponders group (P < .05). There was a negative correlation between the tumor ADC values of pretherapy and the △Diamax of the tumor at the end of CRT (r = −0.592, P = .000).
Comparative Analysis of the Diamax and △Dia of Tumor Between the Responders and Nonresponders.
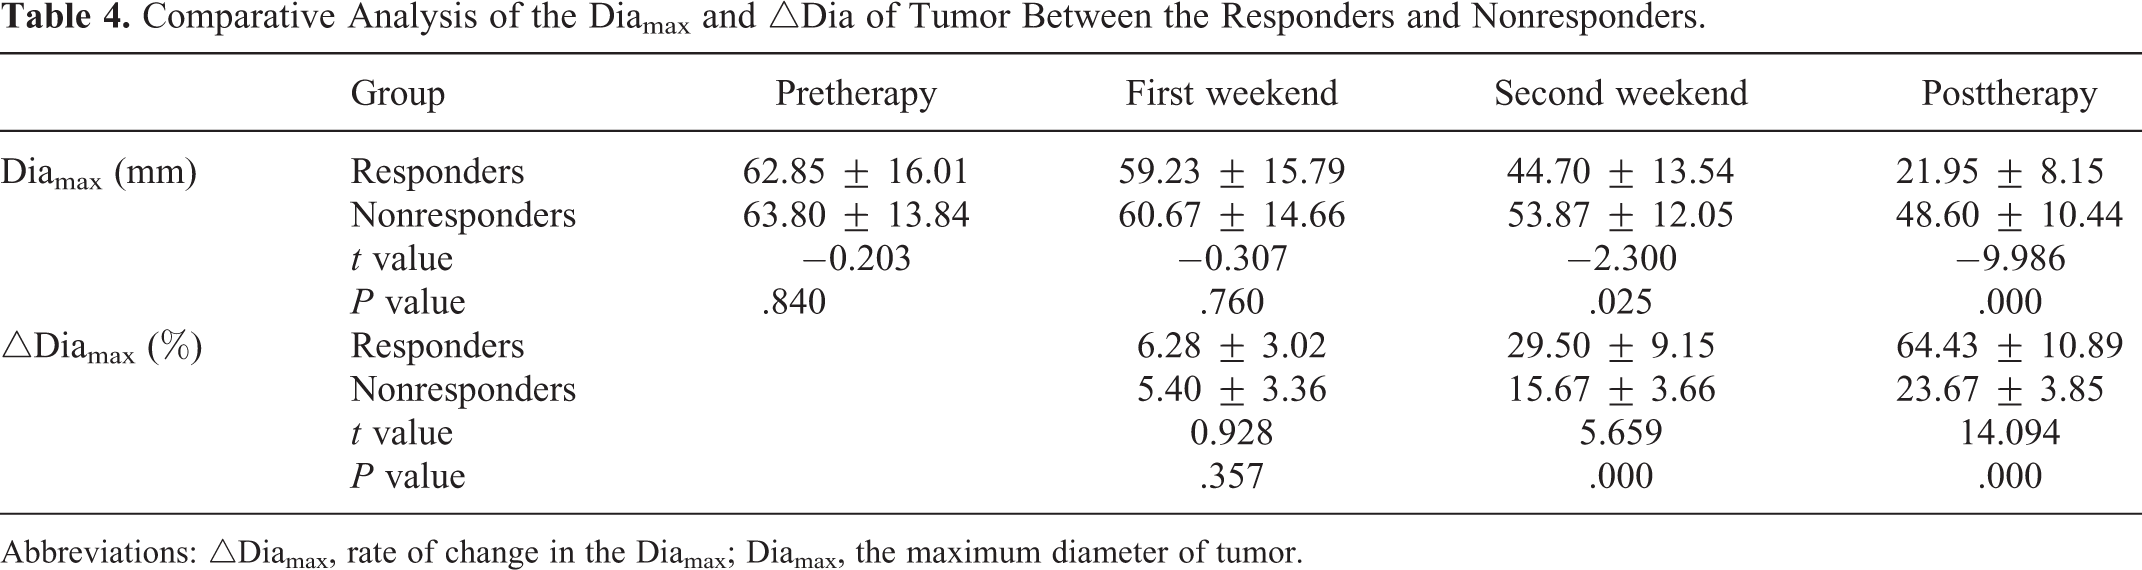
Abbreviations: △Diamax, rate of change in the Diamax; Diamax, the maximum diameter of tumor.
Receiver–Operator Characteristic Analysis of △ADC (%) Between the Responders and Nonresponders
Receiver–operator characteristic analysis of △ADC (%) between the responders and nonresponders group was established at different time points (Table 5). We can conclude that △ADC (%) at the first weekend after CRT have a higher diagnostic performance with △ADC (%) of 9.5% as the best diagnostic threshold, the overall sensitivity, specificity, positive predictive value, and negative predictive value were 100%, 80.0%, 83.3%, and 100%, respectively.
The △ADC at Different Time Points During CRT Was Analyzed by ROC Curve.
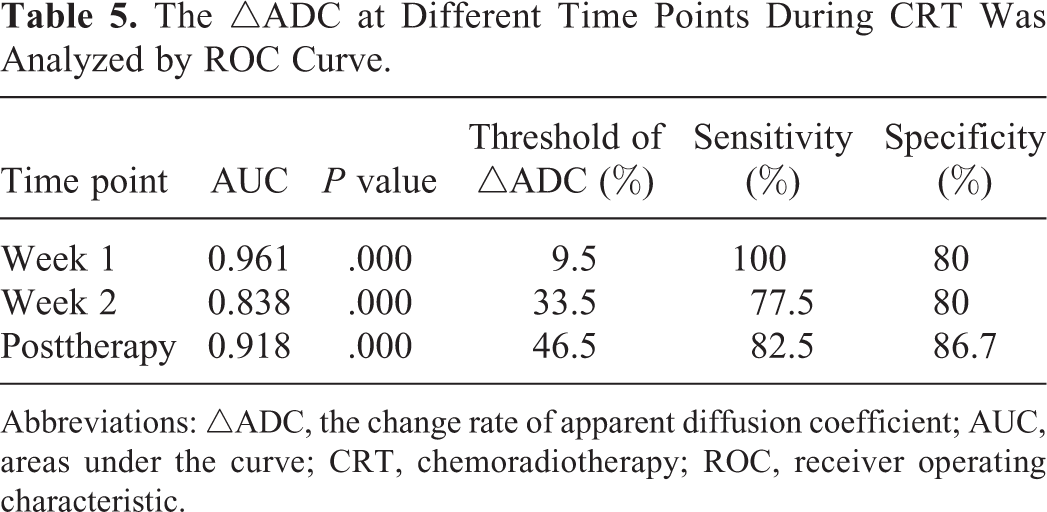
Abbreviations: △ADC, the change rate of apparent diffusion coefficient; AUC, areas under the curve; CRT, chemoradiotherapy; ROC, receiver operating characteristic.
Discussion
Concurrent CRT is currently regarded as the standard treatment for locally advanced esophageal carcinoma with or without surgery. Chemoradiotherapy has improved greatly the prognosis of patients with advanced ESCC. Good evaluation of the therapeutic effect of CRT for ESCC especially at an early time is essential for the choice and adjustment of subsequent therapeutic management. Now tumor volume measurement was widely used to evaluate the response of antitumor treatment. It was hard to measure the volume of ESCC since the esophagus is an irregular hollow organ. It is unreliable to judge the effect early by the reduction of tumor volume after CRT.
Diffusion-weighted imaging is a functional imaging modality which can be used to detect the early change in morphology, pathology, and physiology and related to tissue water content. It has been widely reported the application of DWI to evaluate the therapeutic effect in cervical cancer, breast cancer, and colorectal cancer. 8 -10 Research has shown that the increase in the ADC value was related to the decrease in tumorous cellular density after effective treatment. 11 Before CRT, esophageal cancer with high tumor cell proliferation, high cellularity, decreased extracellular volume, cell membrane barrier, and increased absorption of protein to water molecules all districted the diffusion of water molecules and decreased the ADC value of tumor. After CRT, cell membrane of tumor was destroyed, resulting in the apoptosis and necrosis of tumor cells, enlarged extracellular volume, increased water molecules diffusion and finally inducing the increased of the ADC value. 12 There are a few studies which were aimed to use DWI to guide target delineation or evaluating prognosis 6,13 and to investigate the feasibility of using DWI parameters to predict early response to CRT for esophageal cancers. 14
Our results showed that the ADC value in responders increased significantly at the first weekend of CRT, which was consistent with previous studies of animal experiment and clinical research. The studies of breast cancer, glioma, hepatocellular carcinoma, and prostate cancer demonstrate that the increase in ADCs was because of the damage of cell membrane. 15 -19 As cell membrane of tumor was damaged, leading to necrosis and swelling of tumor cells, the release of a lot of vascular endothelial growth factor (VEGF), an increased extracellular space and finally the increased of the ADC value. In addition, some clinical studies suggest that the increased ADC value after treatment was a common phenomenon and did not depend on the pathological type or therapeutic method. 20,21 In our study, slight increases in tumor ADC value were observed in the nonresponders at the first weekend of CRT as well. The ADC value continued to increase during the second weekend of CRT and reached a statistically significant difference from that of before CRT. In our study, the △ADC increase was compared between responders and nonresponders at 3 different time points (first weekend, second weekend, and posttherapy). We found that the percentage of increase in tumor ADC value was significantly higher in the responders than in the nonresponders at all 3 time points. We think the reason for this result is that the sensitivity of the tumor of nonresponders to CRT is lower than that of responders. Therefore, the difference in ADC value increase in the 2 groups was mainly affected by the different sensitivity of tumors to CRT. Besides, the study indicated there were no changes in the maximum diameter of tumor of the 2 groups at the first weekend of CRT, and we can conclude that the change in ADC value after treatment is more early and reliable than morphological measurement of tumor.
Some studies suggested lower ADCs may have a better effect than that of higher ADCs before CRT. 6,22 In this study, we compare the △ADC values between high pretherapy ADC group and low pretherapy ADC group at 3 different time points (first weekend, second weekend, and posttherapy), and significant differences were found. Besides, in our study, pretreatment ADCs of the responders were lower than that of the nonresponders, which was contradicted with the study of Aoyagi et al 23 who found that the response to CRT and overall survival rate of higher pretreatment ADCs were superior to that of lower pretreatment ADCs. The reason may be related to small sample size and different pathological types. Correlation analysis between the tumor pretreatment ADCs and the tumor maximum diameter regression rate was made in our study, and the result showed the negative correlation between them; the higher tumor pretreatment ADCs is, the lower the tumor maximum diameter regression rate will be. As a result, esophageal carcinoma with lower pretreatment ADCs may be more sensitive to CRT compared with that of higher pretreatment ADCs. The tumor tissue with higher pretreatment ADCs may have more necrotic tissues, accompanied by hypoxia, acidosis, and hypoperfusion, and lead to reduced sensitivity to CRT. Besides, some patients with decreased ADCs after CRT may be relevant to interstitial fibrosis and radioinflammation retrogression.
The ROC curves of the responders and the nonresponders in our study showed that △ADC (%) at the first weekend after CRT have a higher diagnostic performance with the area under the curve of 0.961, and △ADC (%) of 9.5% as the best diagnostic threshold; the overall sensitivity, specificity, positive predictive value, and negative predictive value were 100%, 80.0%, 83.3%, and 100%, respectively. However, no significant changes were found between the 2 groups in the maximum diameter of the tumor at the first weekend after CRT. Therefore, the change in ADCs at the first weekend is an optimal time point to predict response to CRT in ESCC, which was more reliable than morphological measurement. However, the diagnostic threshold of △ADC (%) depends on a bulk of samples and multicenter clinical study.
Conclusion
Diffusion-weighted imaging can be a new imaging method to predict and evaluate the early response to concurrent CRT of esophageal carcinoma, with the rate of change of ADCs at the end of the first week as a sensitive indicator to predict the early response.
Footnotes
Abbreviations
Declaration of Conflicting Interests
The author(s) declared no potential conflicts of interest with respect to the research, authorship, and/or publication of this article.
Funding
The author(s) received no financial support for the research, authorship, and/or publication of this article.